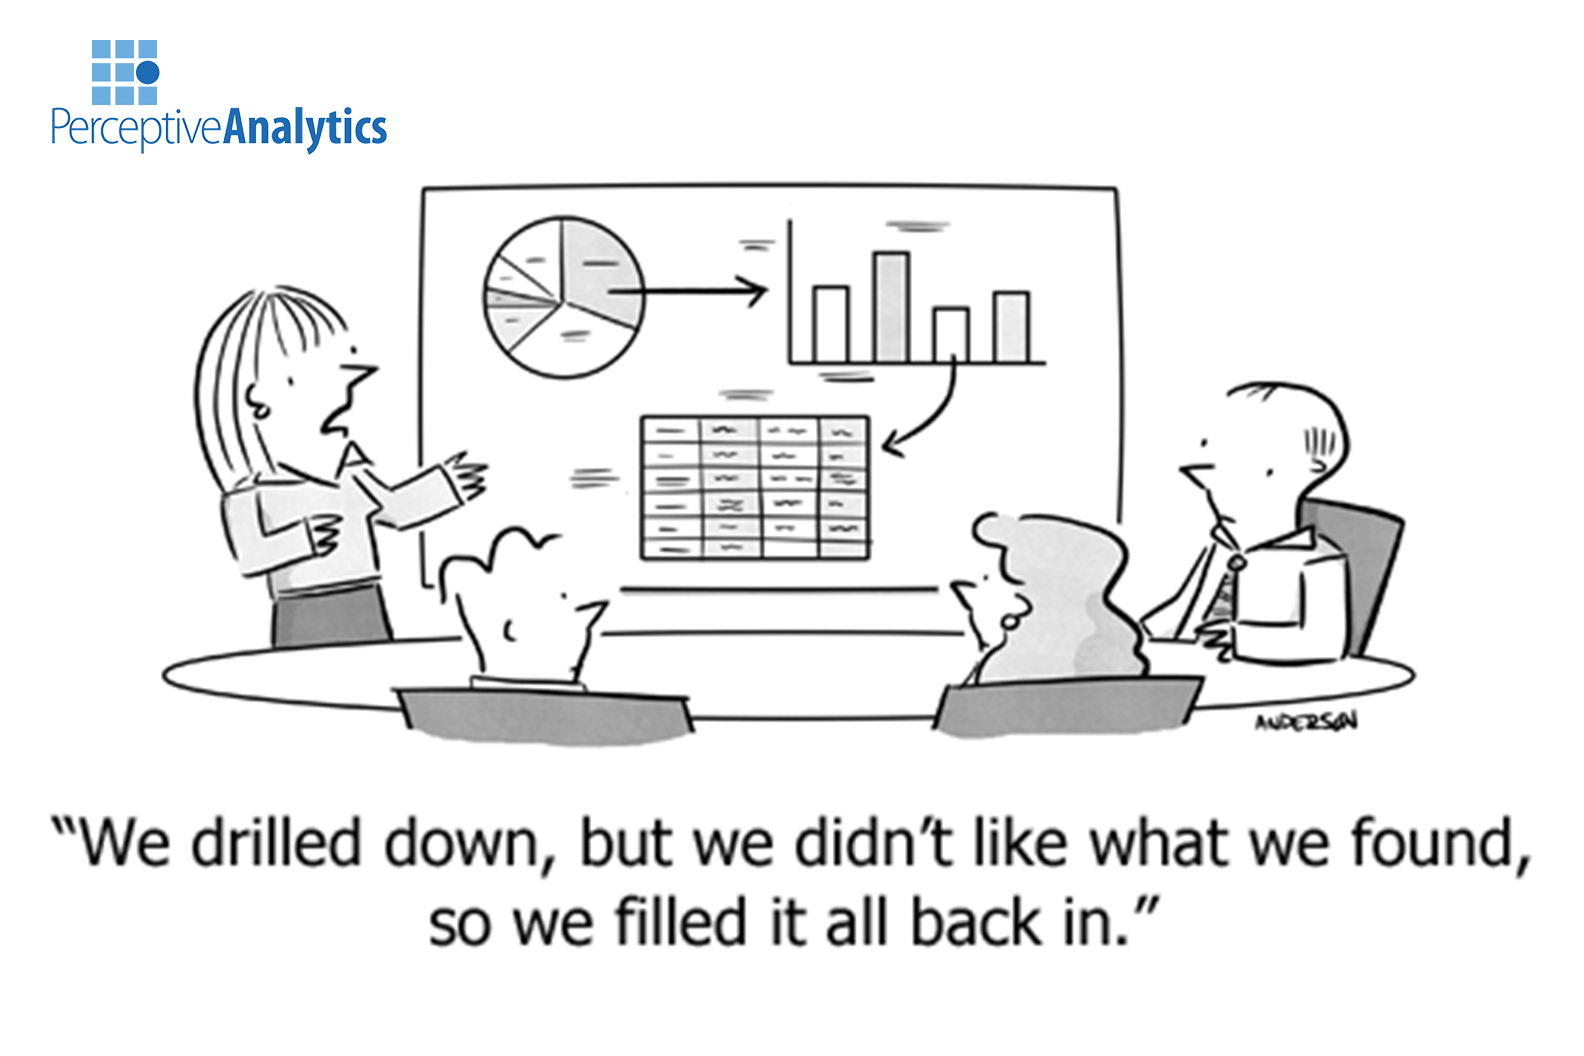
Markdown Optimization – Modeling Markdowns to Maximize Revenue Markdowns are omnipresent in retailing and play...
Optimizing Marketing Spend with Marketing Mix Modeling Marketers in CPG industry are constantly faced with...
Business Model for a Hedge Fund The client has started a closed-ended hedge fund of...
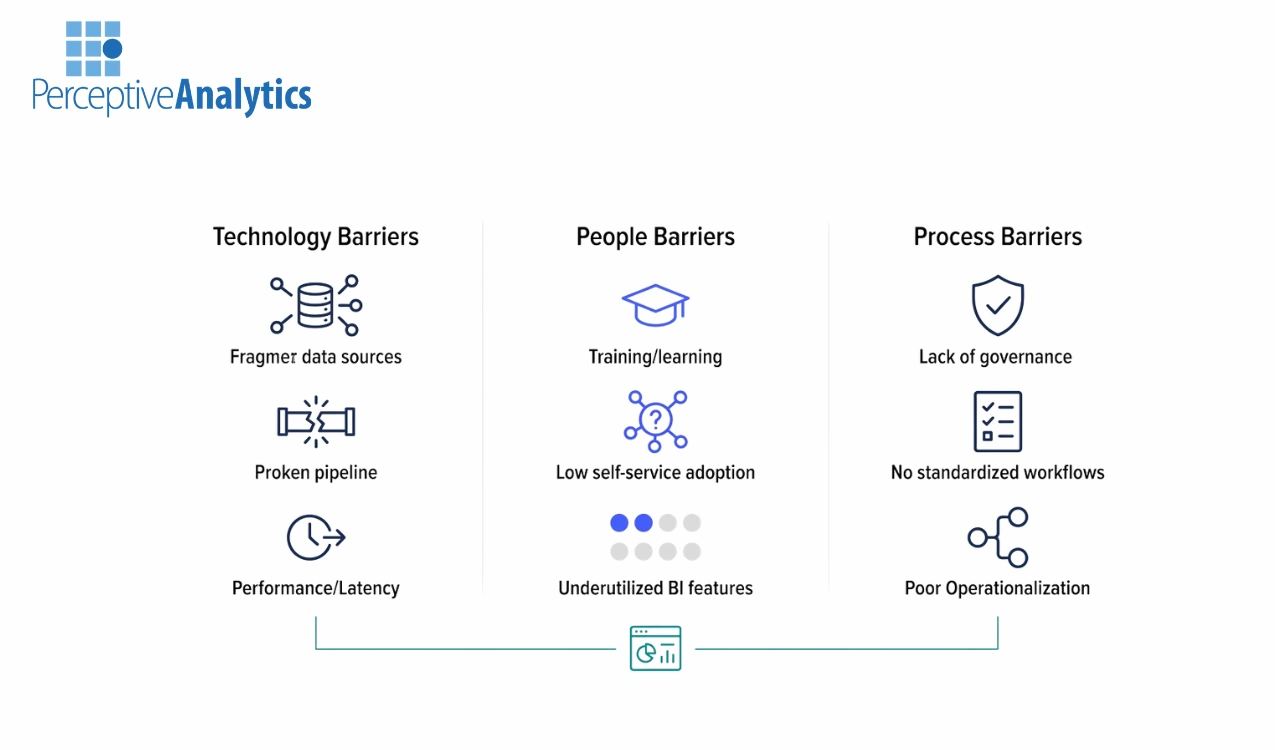
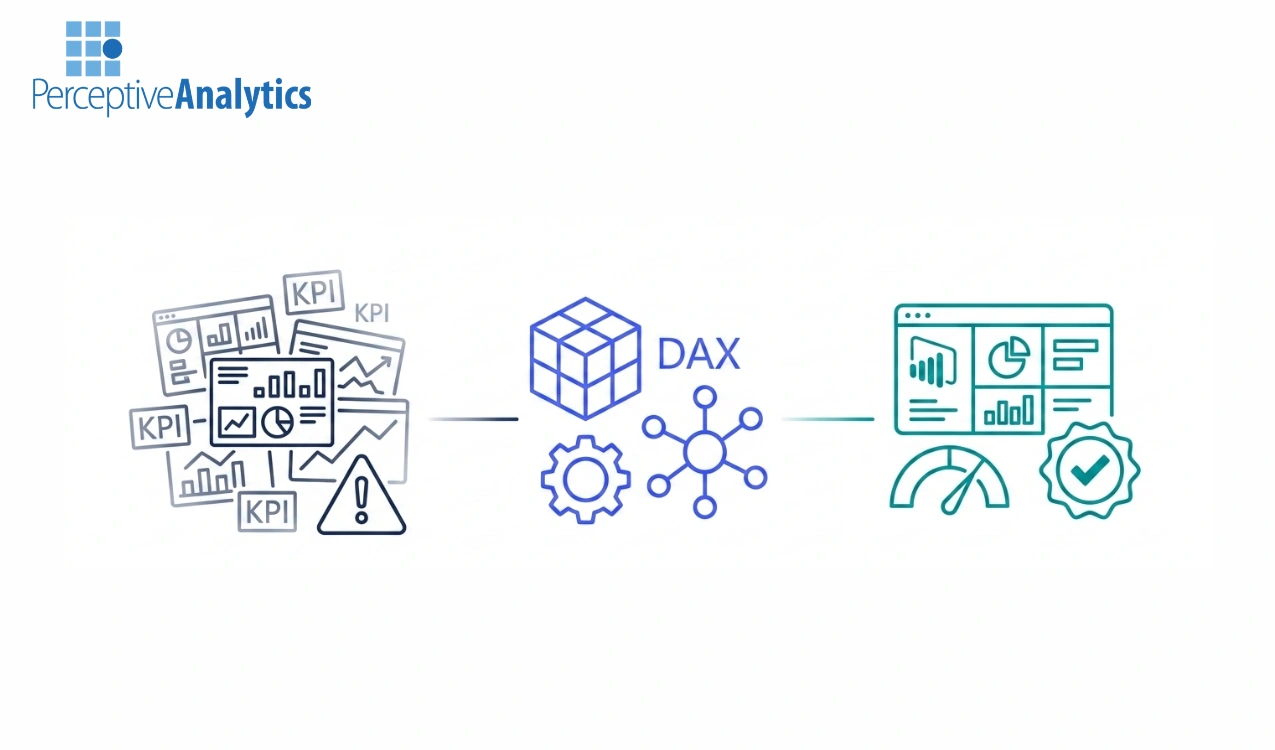
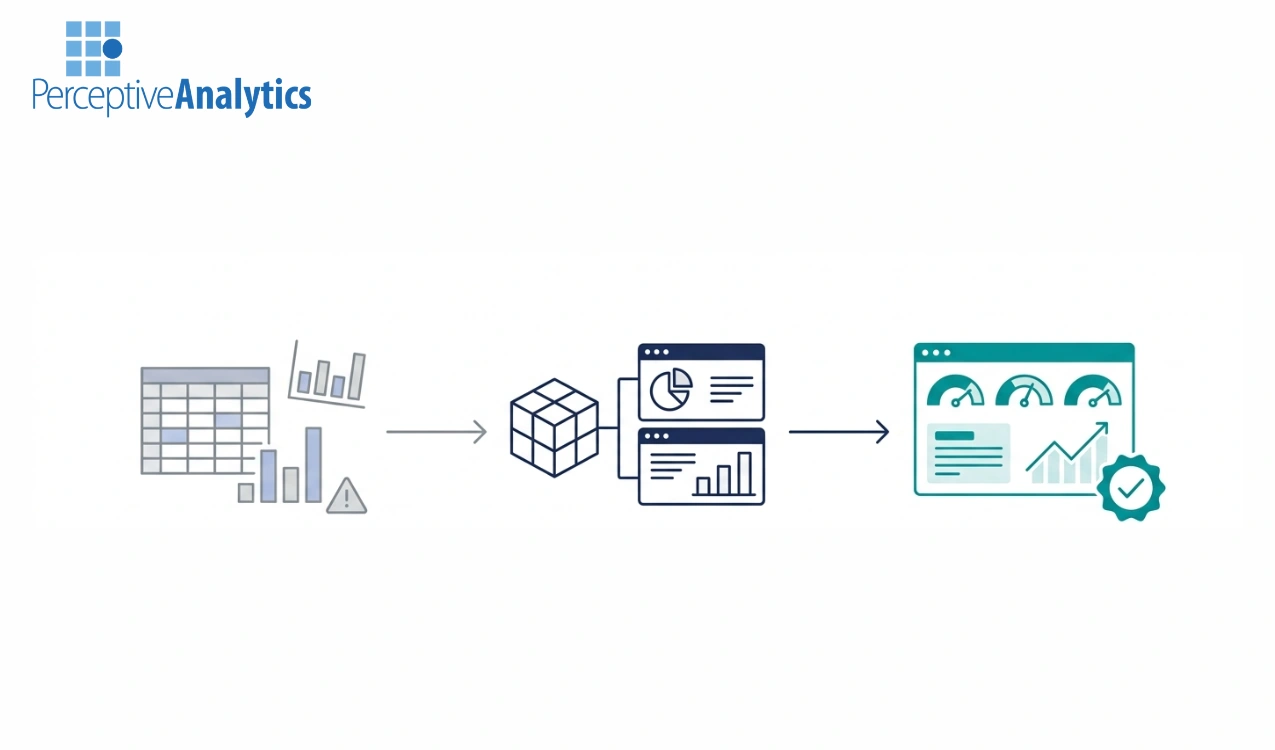
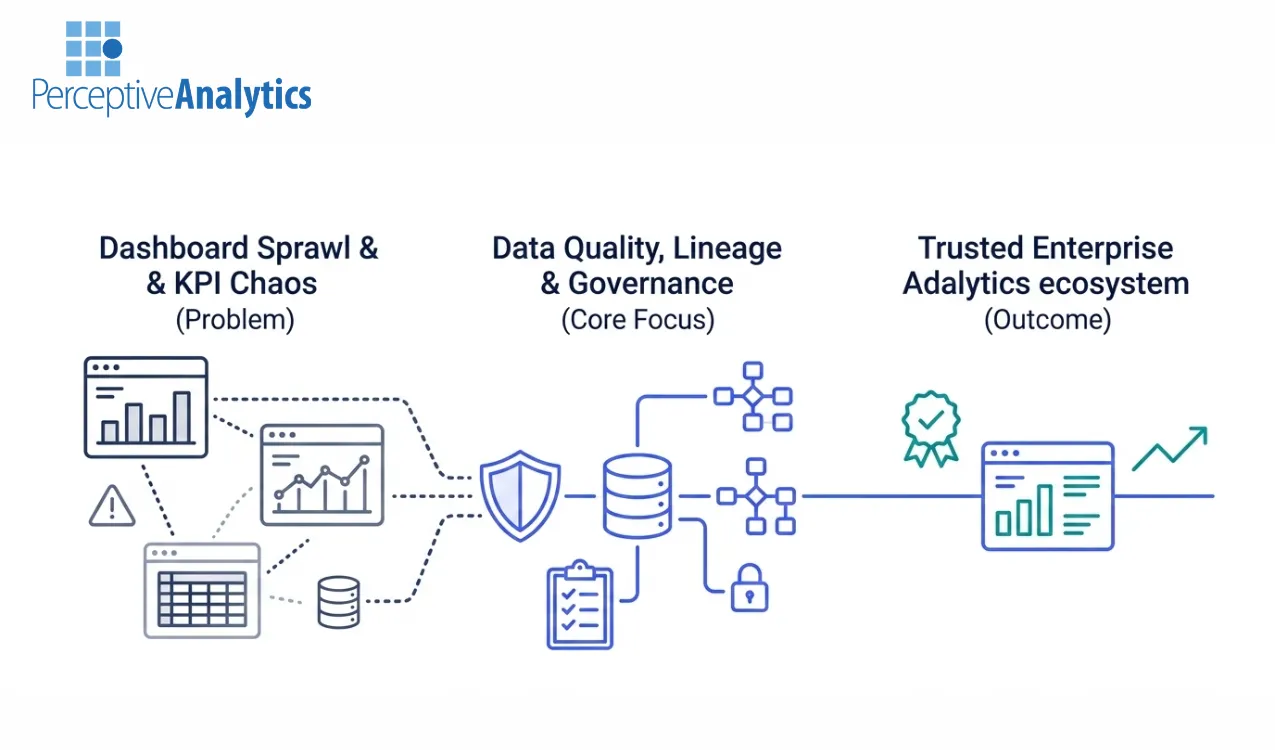
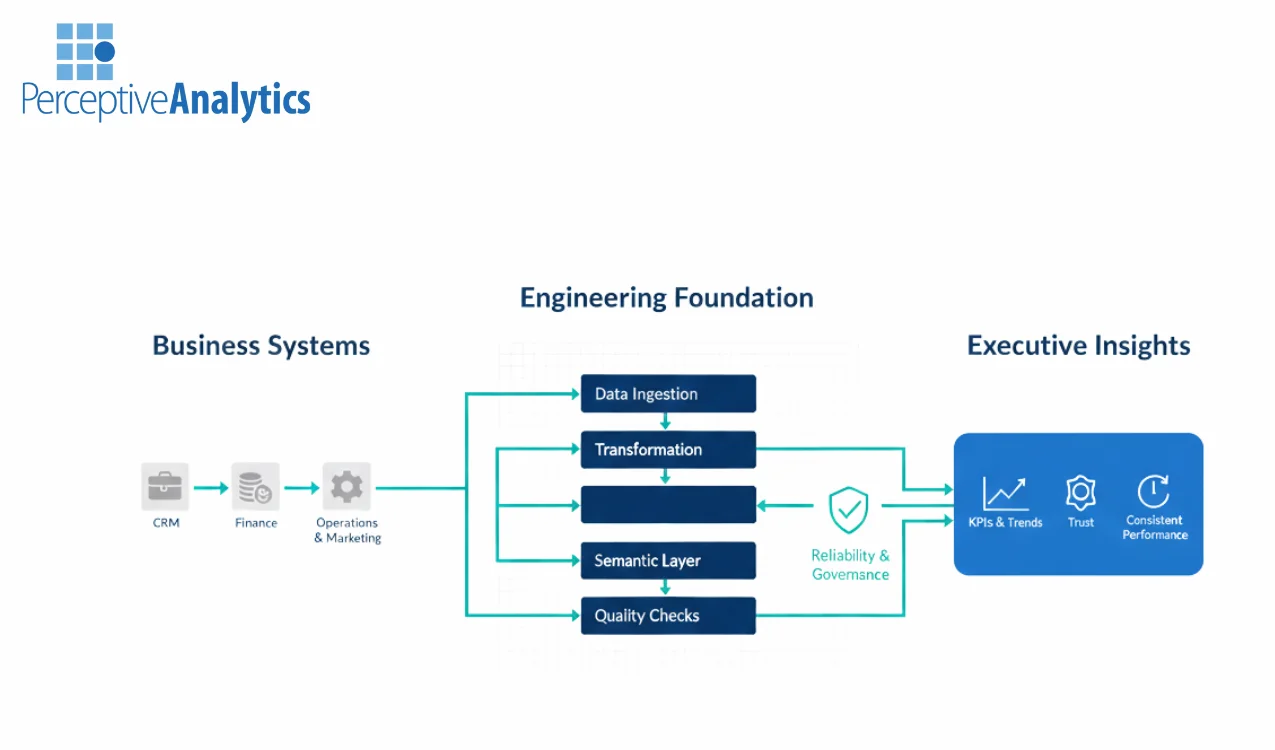
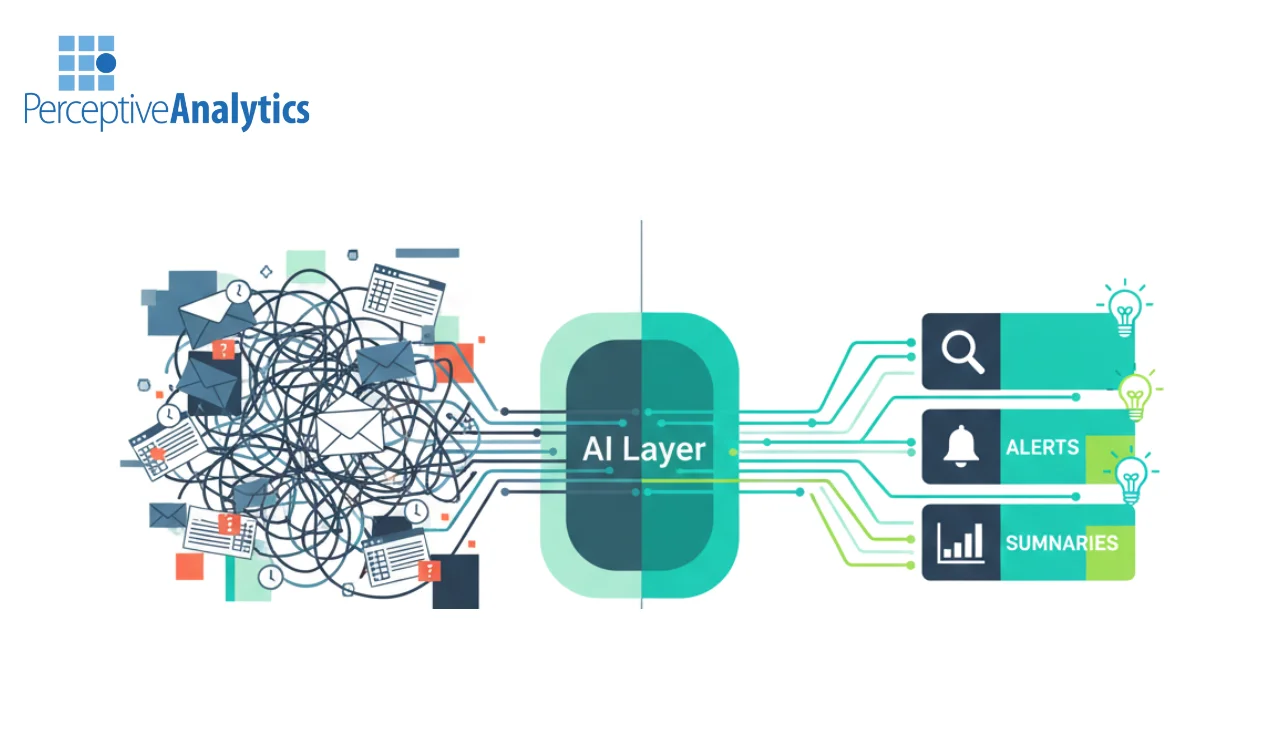
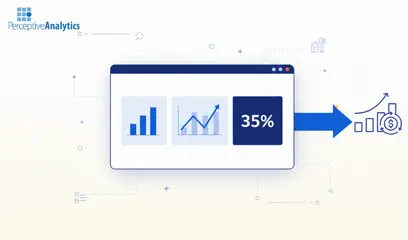
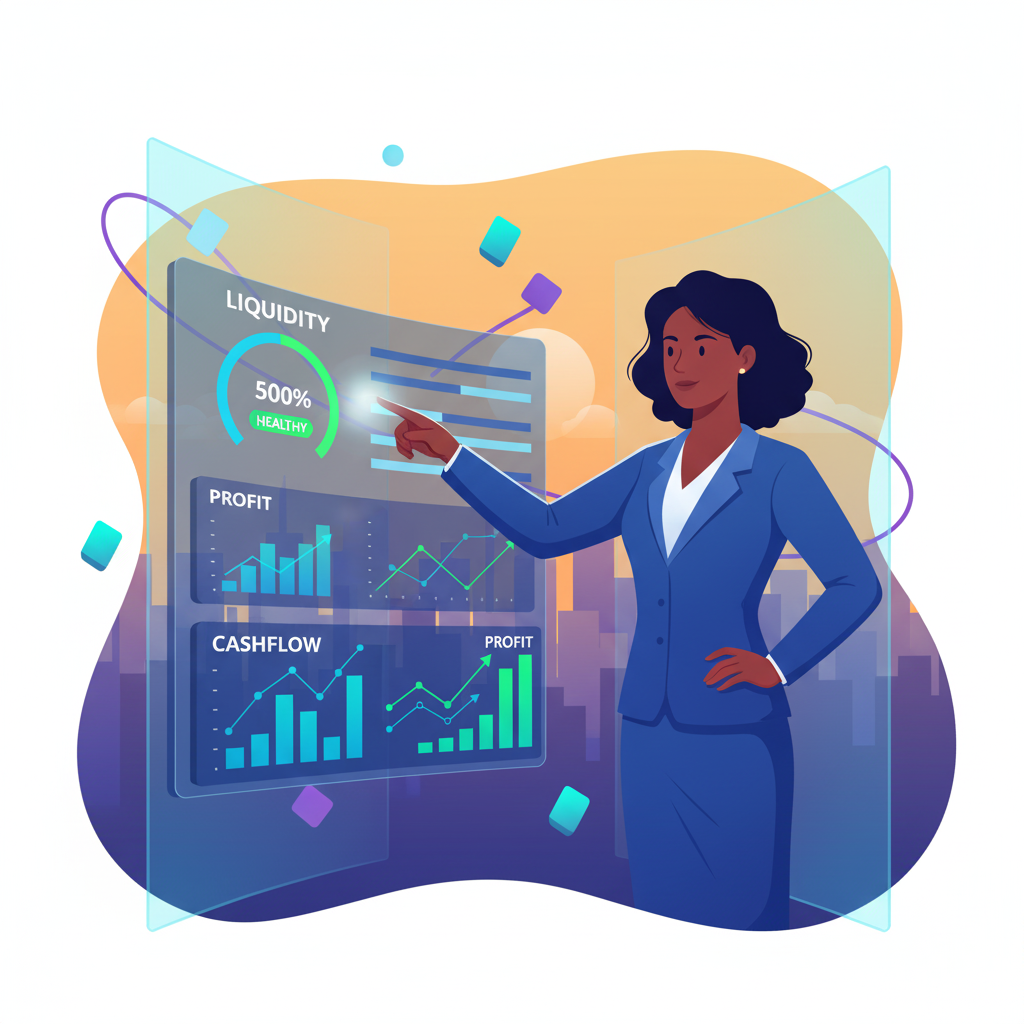
Enterprise KPI consistency is rarely just a visualization issue; it is a fundamental challenge of...
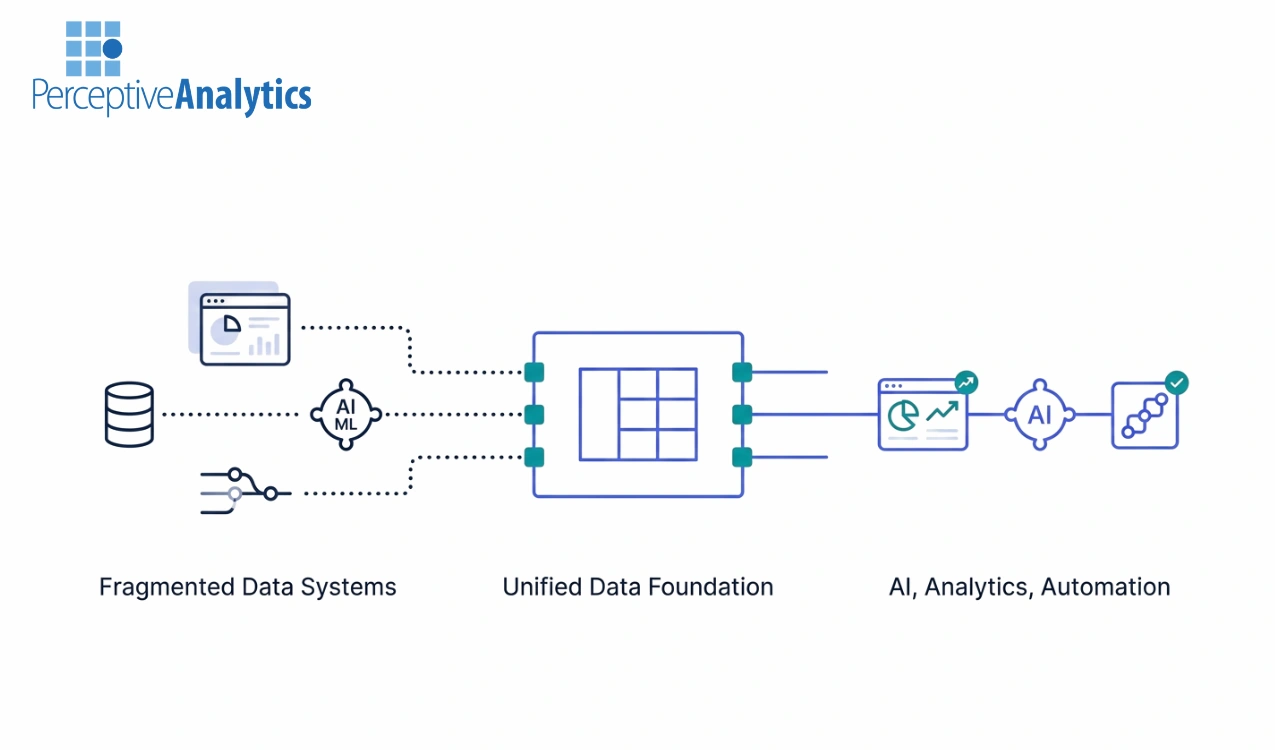
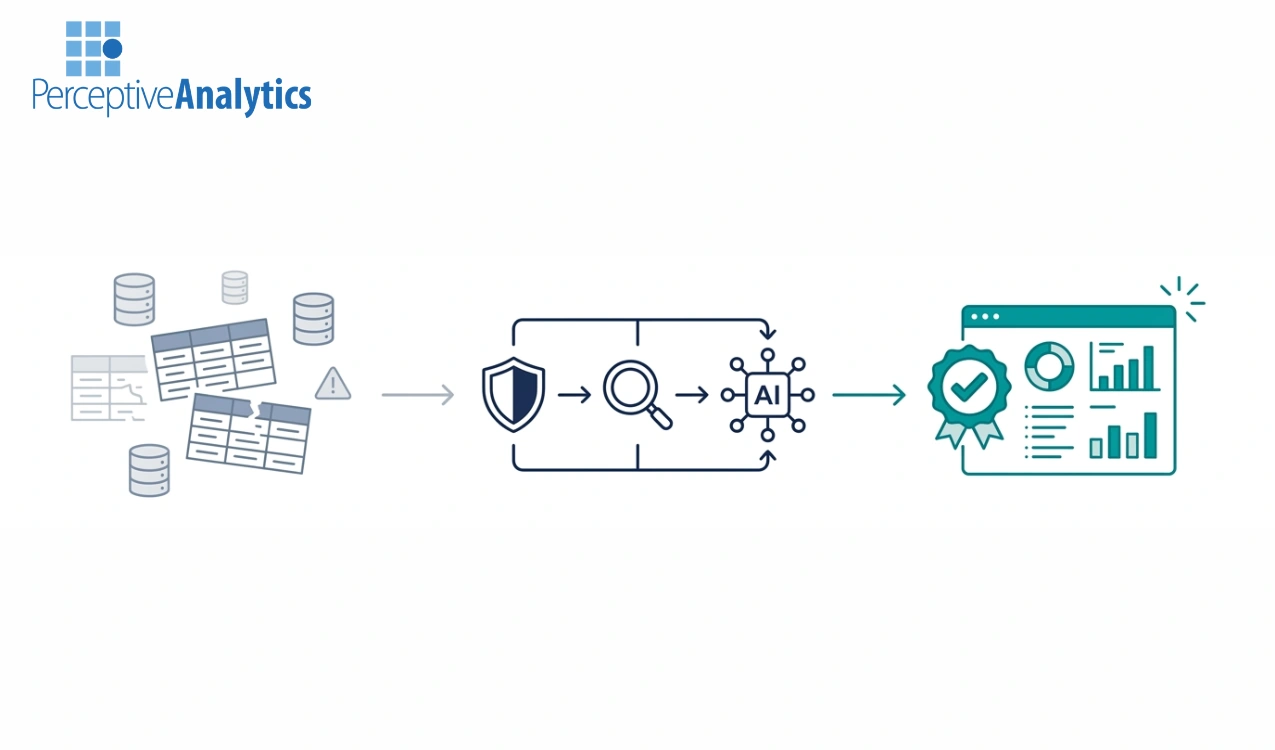
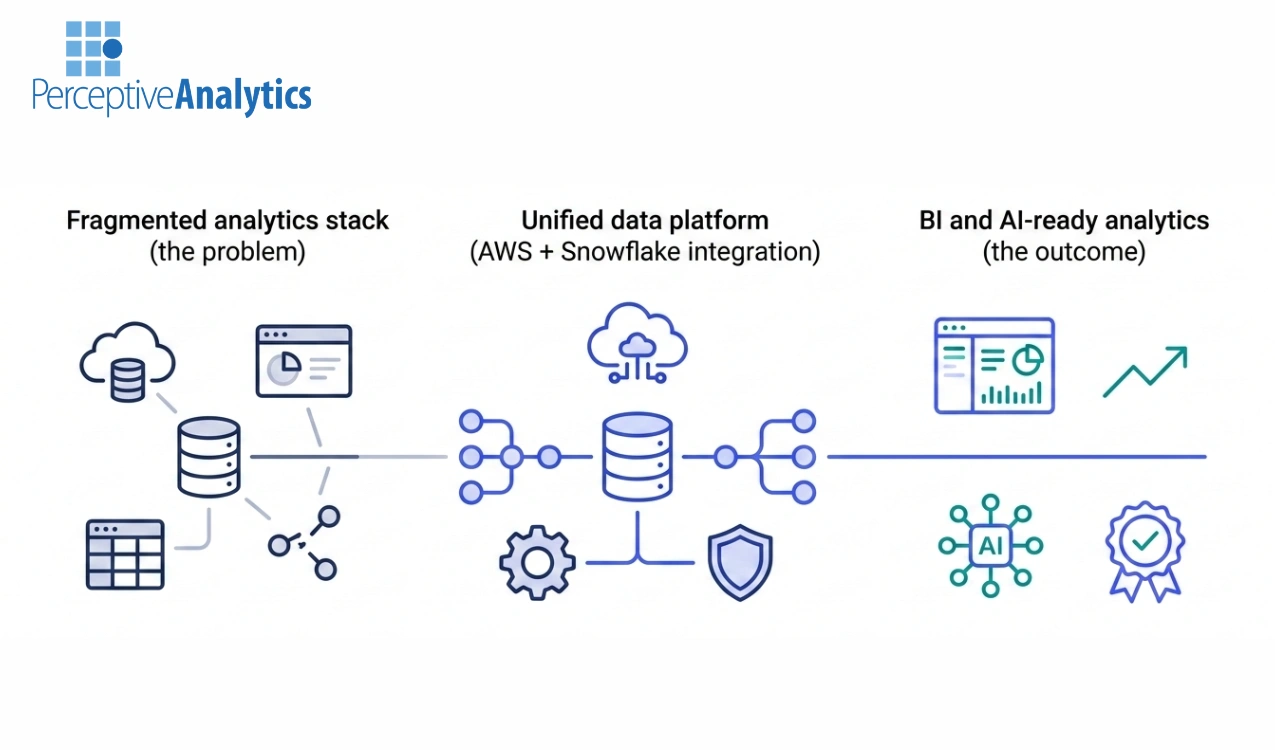
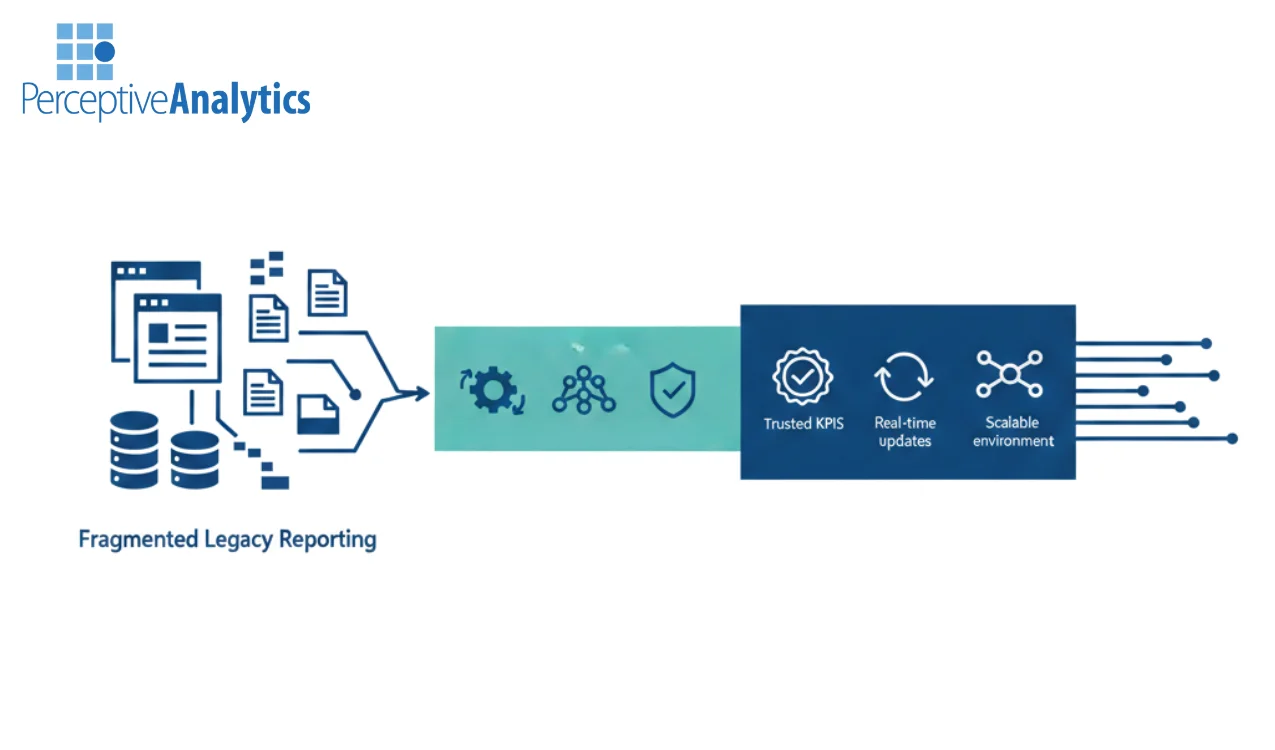
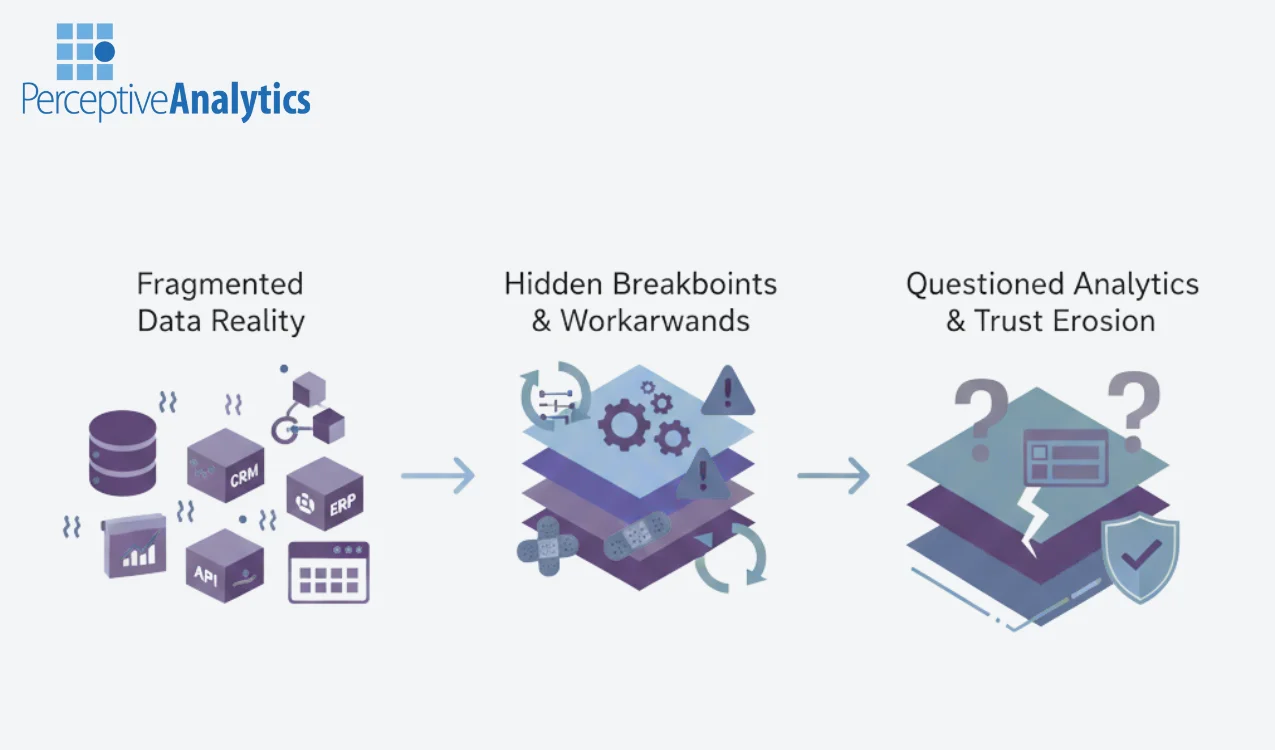
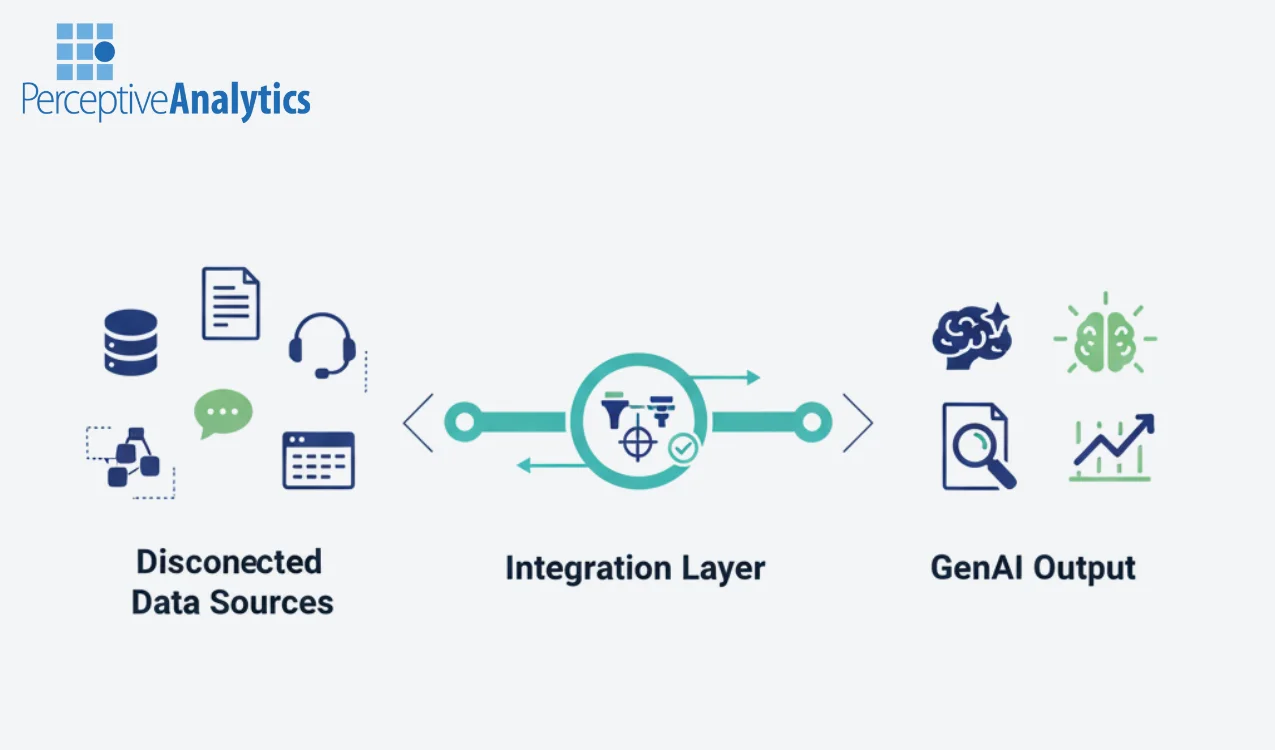
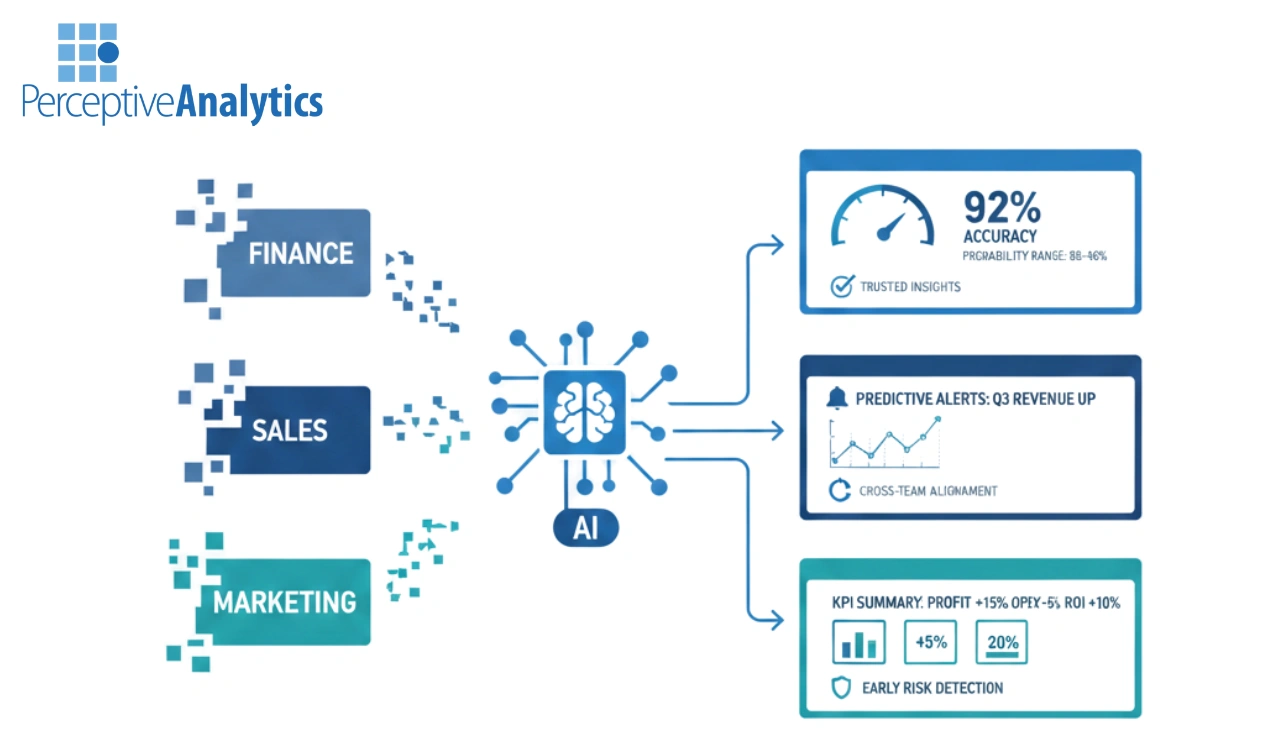
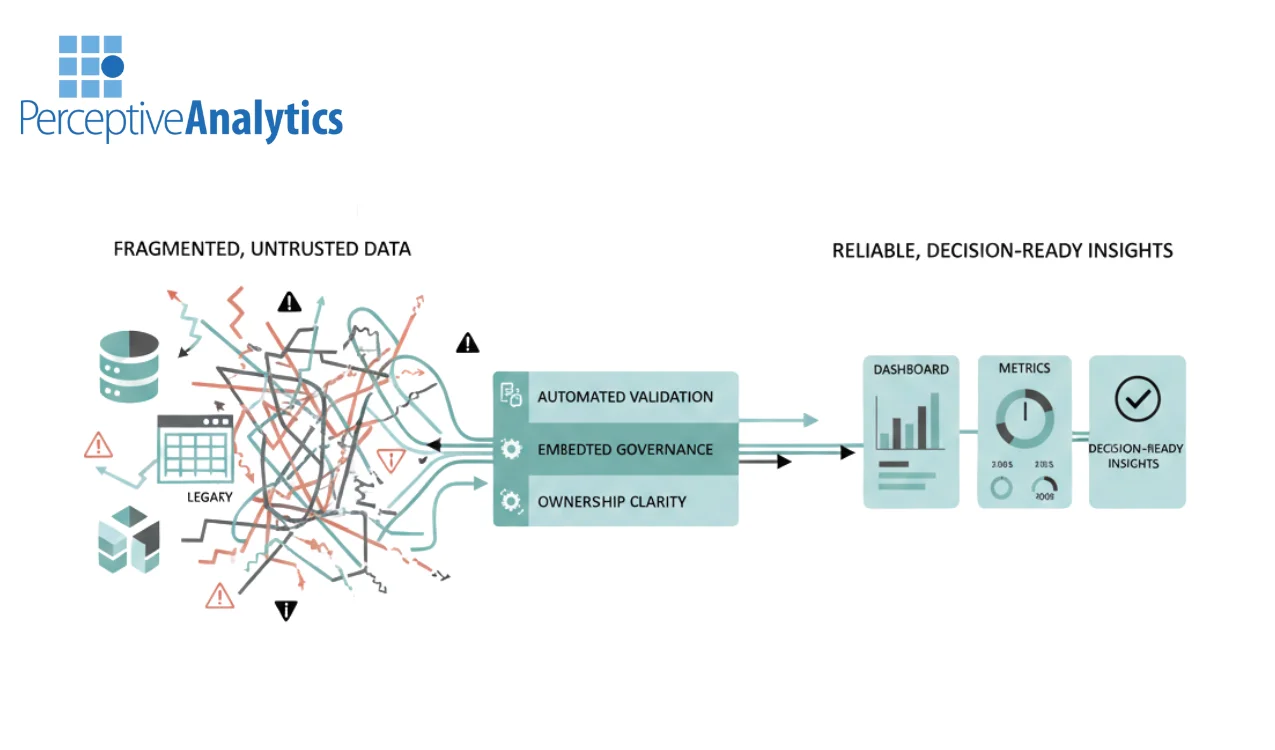
Enterprise data leaders face a mounting crisis: fragmented data across finance, supply chain, marketing, and...
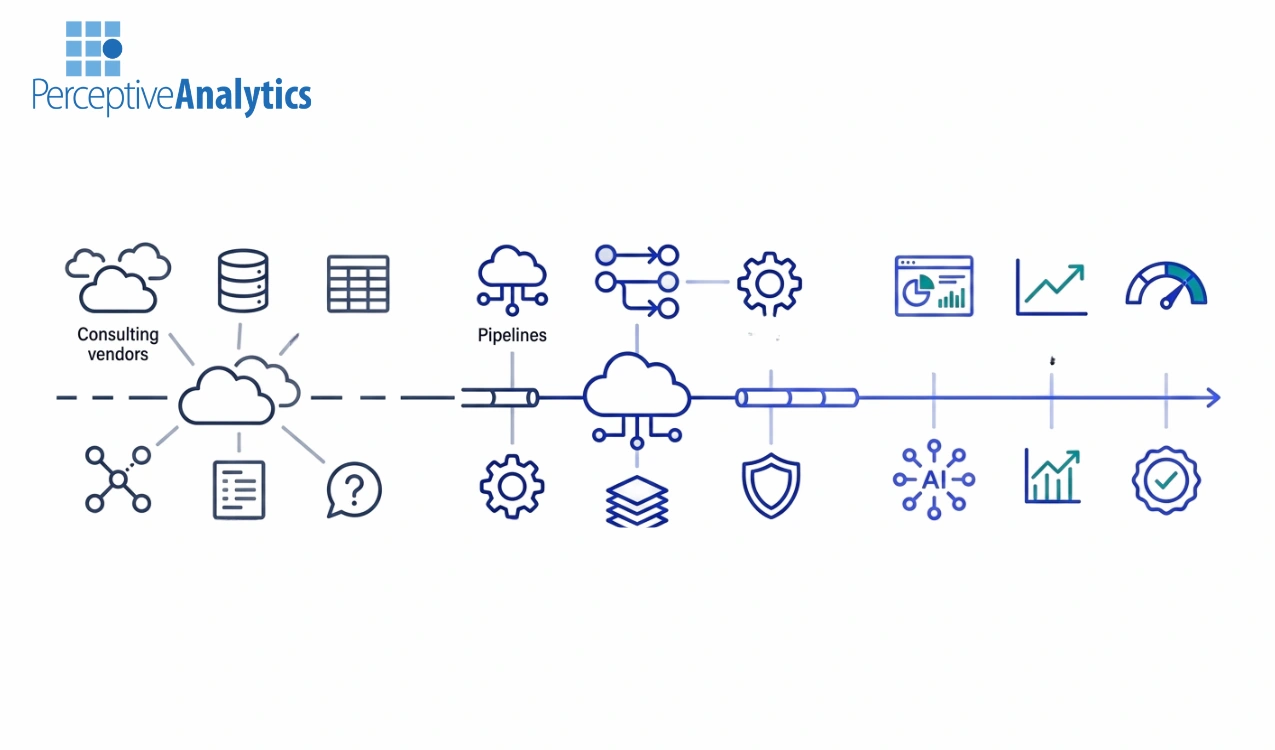
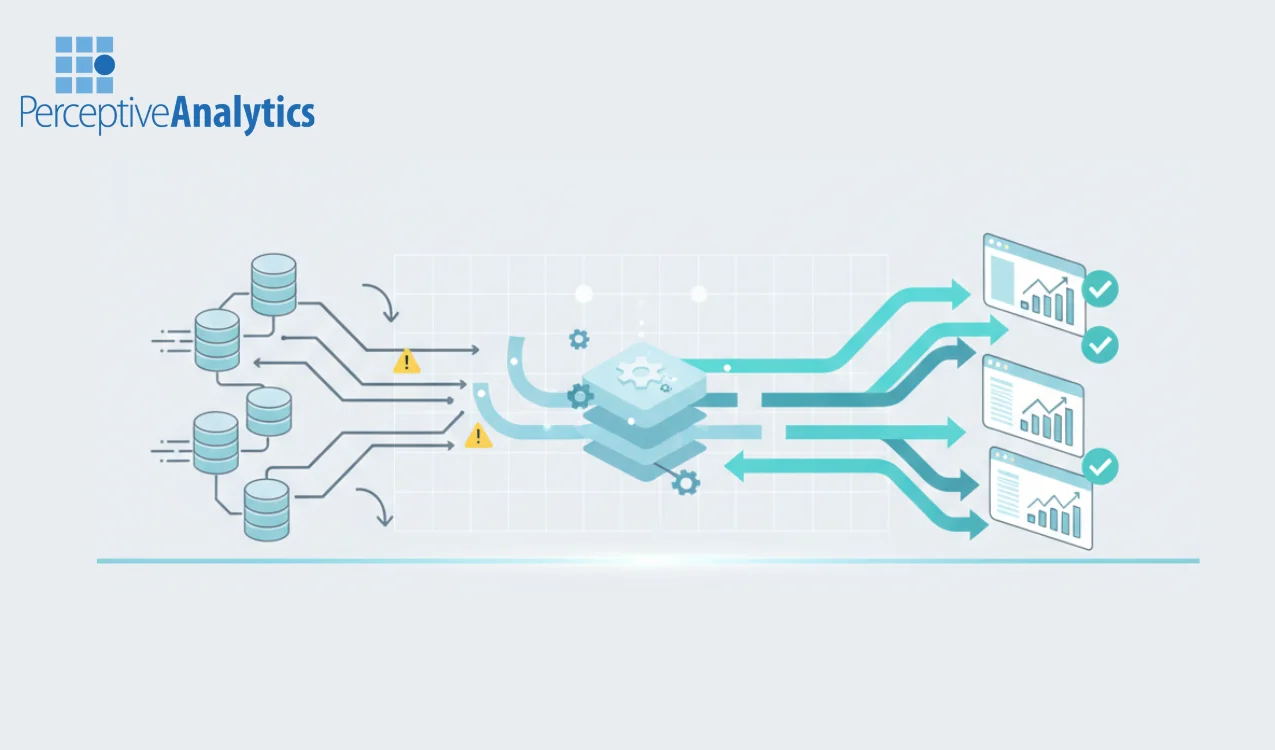
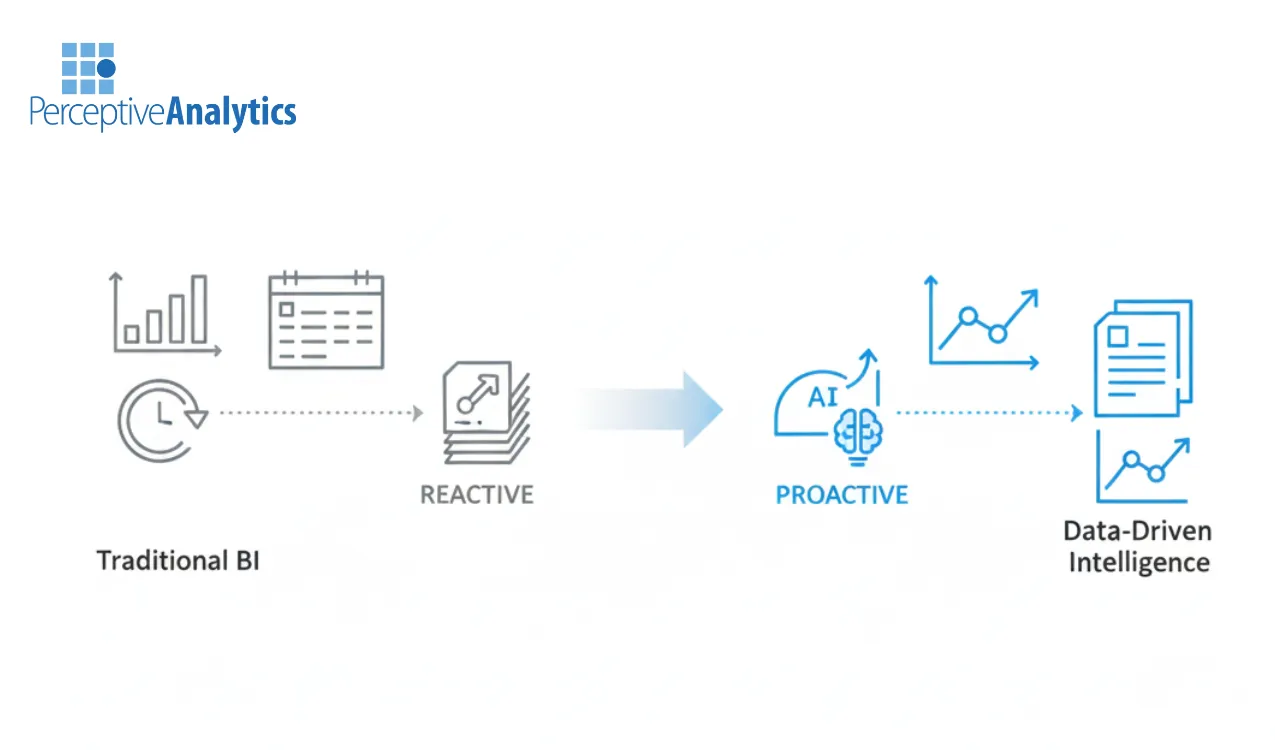
Enterprise analytics leaders today face a compounding set of challenges: reporting is fragmented across departments,...
Ad-hoc reporting is where most analytics teams quietly lose control. Requests pile up, SLAs slip,...
Executives rely on Looker dashboards to make high-stakes decisions—but many dashboards are slow, cluttered, or...
Most organizations don’t struggle to build dashboards in Looker—they struggle to get executives to actually...
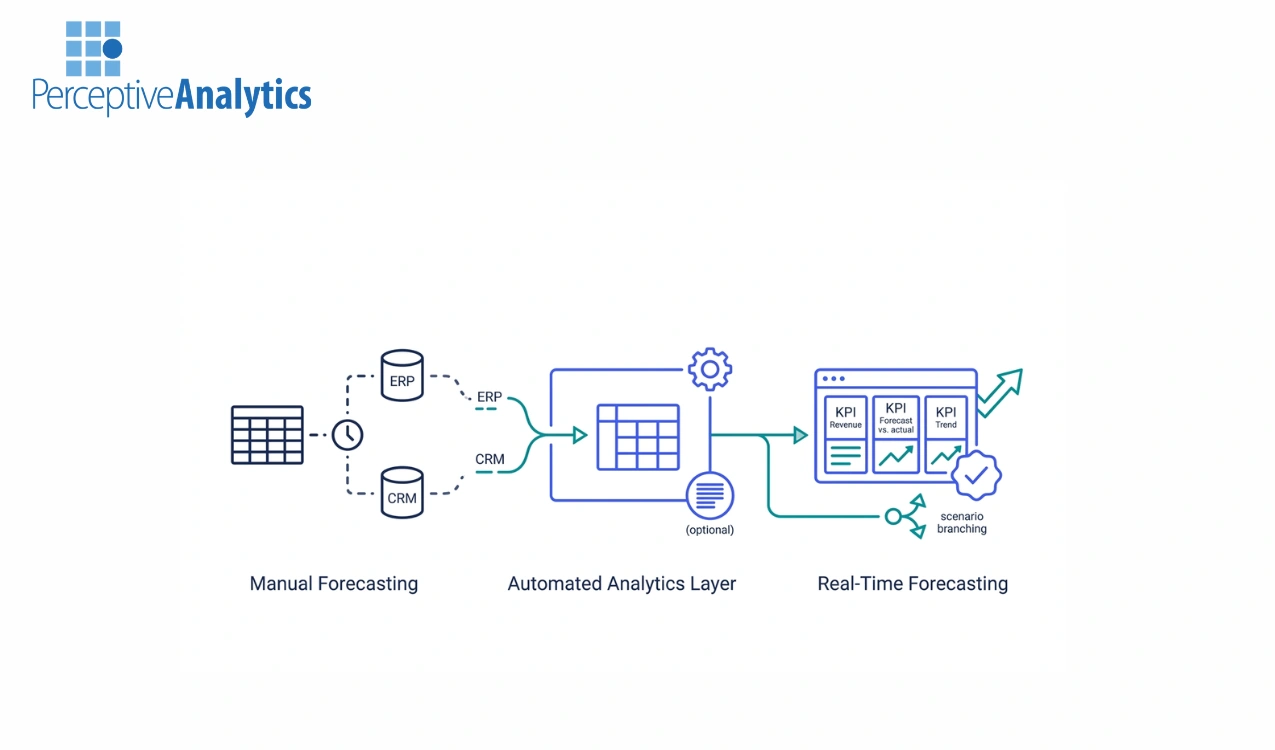
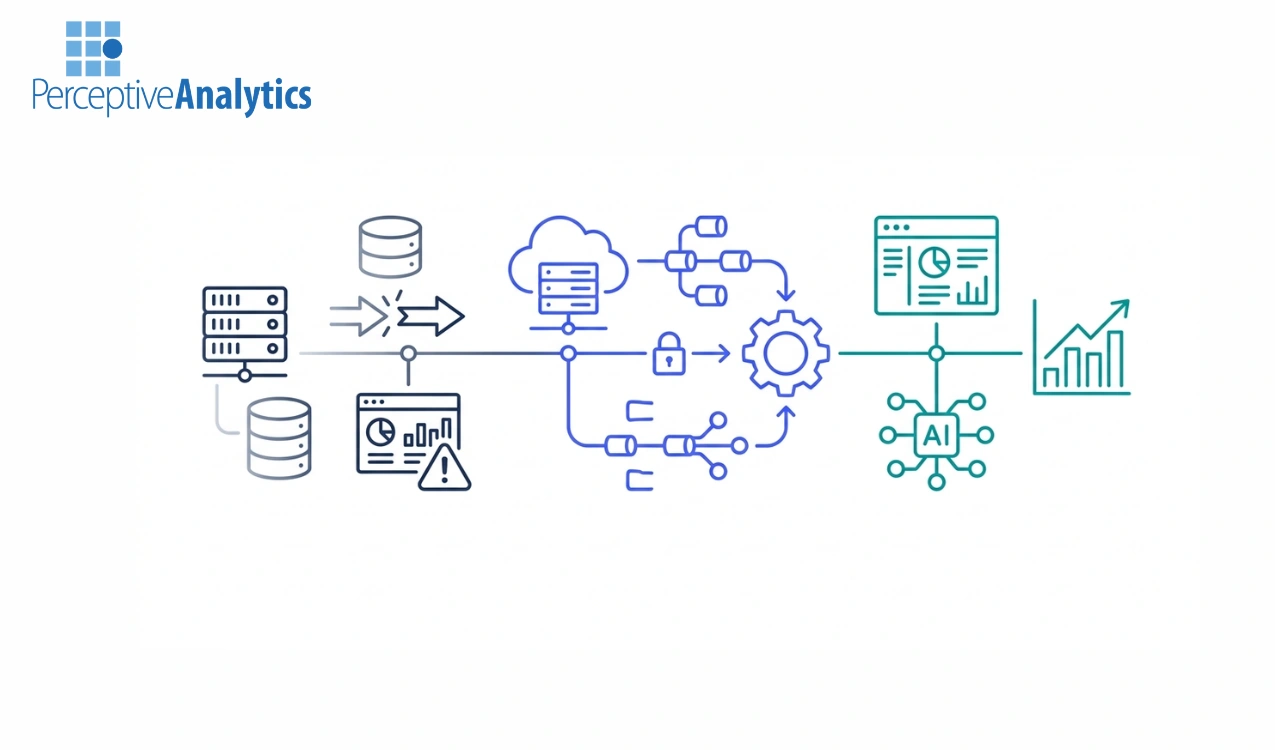
Forecasting delays are rarely caused by models—they are caused by slow, fragmented, and inflexible data...
Most organizations assume slow reporting is a BI tool issue. In reality, reporting delays are...
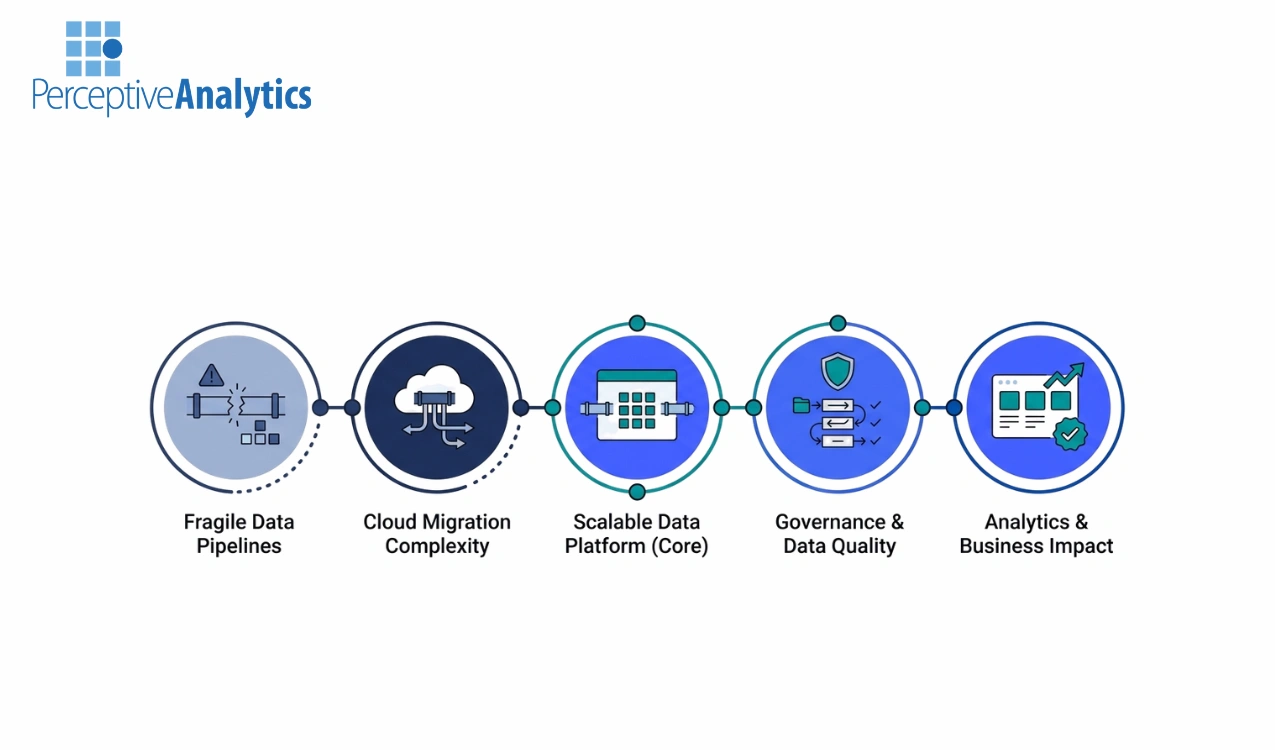
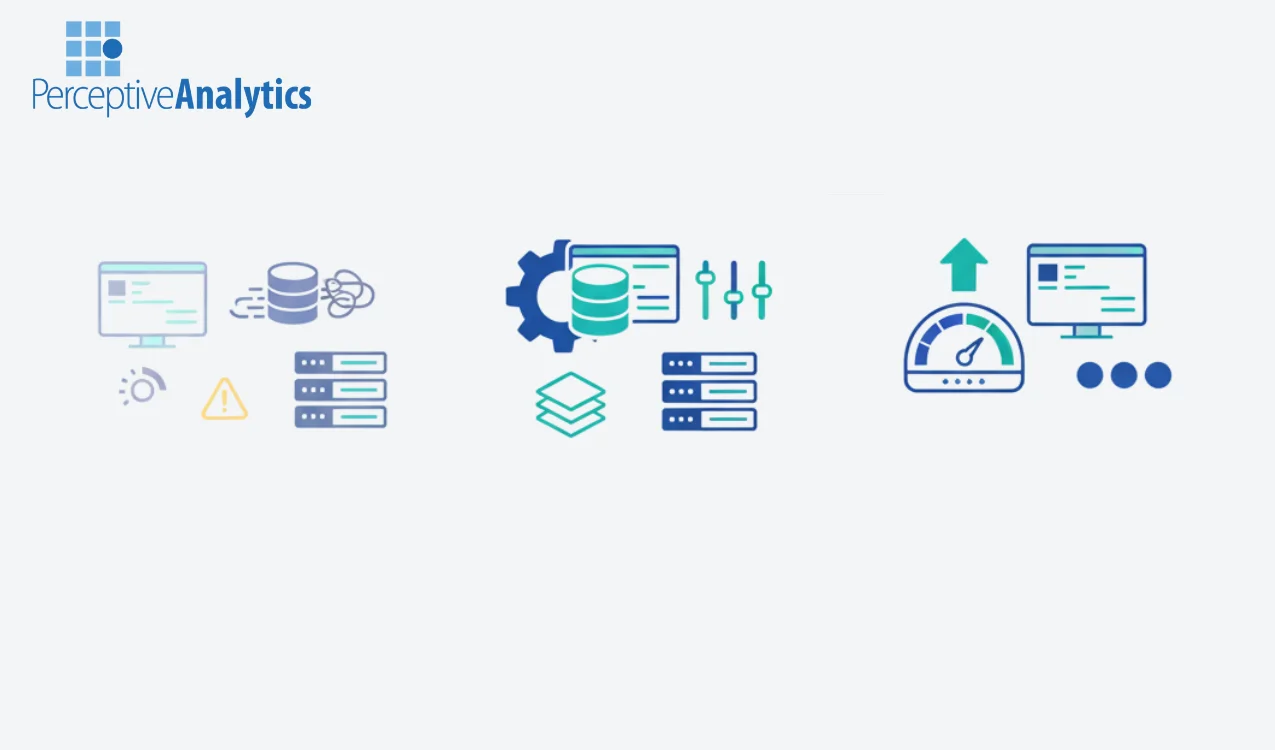
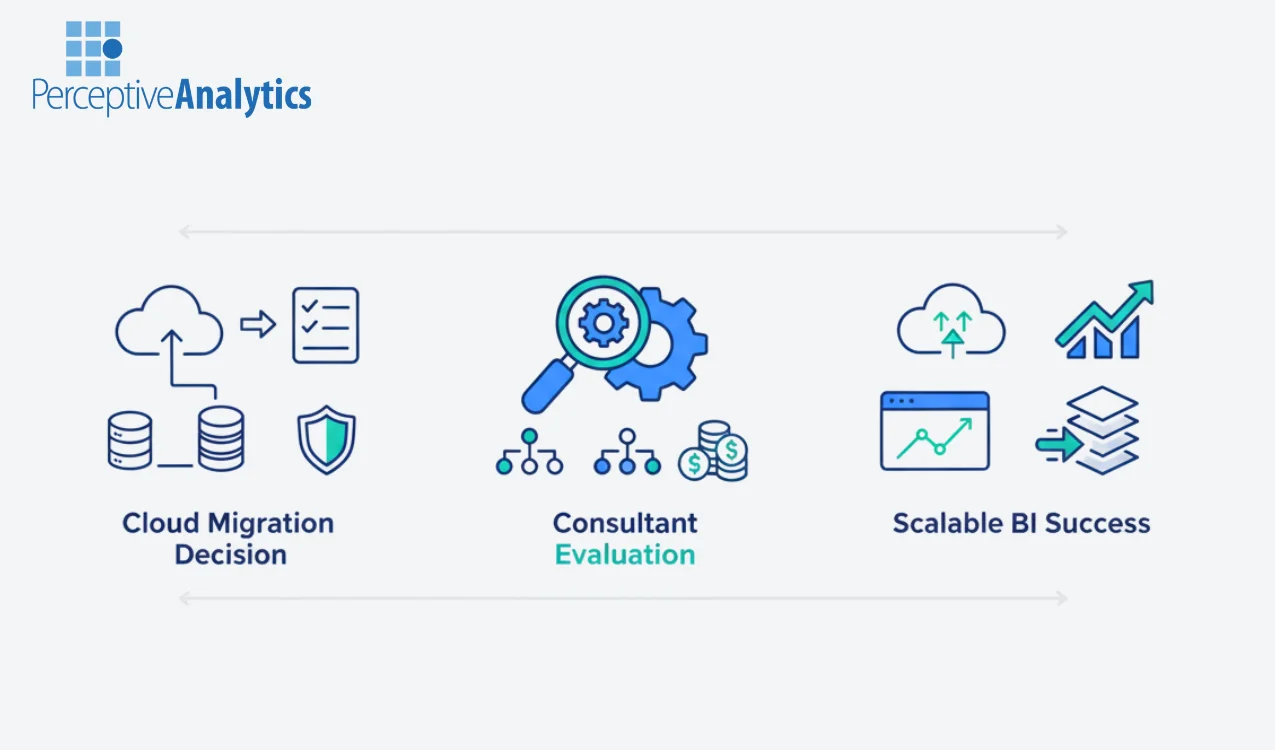
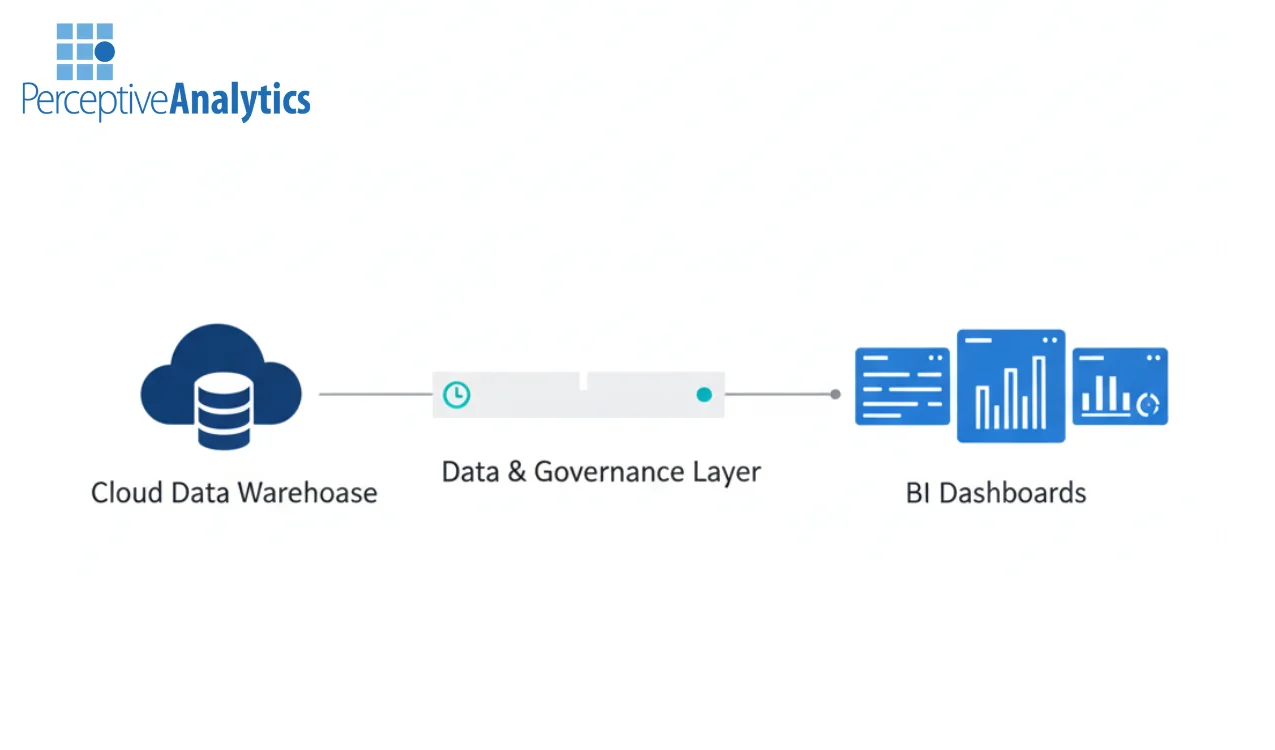
Cloud data warehouse migrations are often positioned as a straightforward upgrade—move from legacy systems to...
Snowflake simplifies storage and compute — but integration is where most cost and performance problems...
Most organizations hire data engineering partners expecting faster dashboards and real-time insights — but end...
Most organizations assume slow BI is a tool problem. It’s not. At Perceptive Analytics, we...
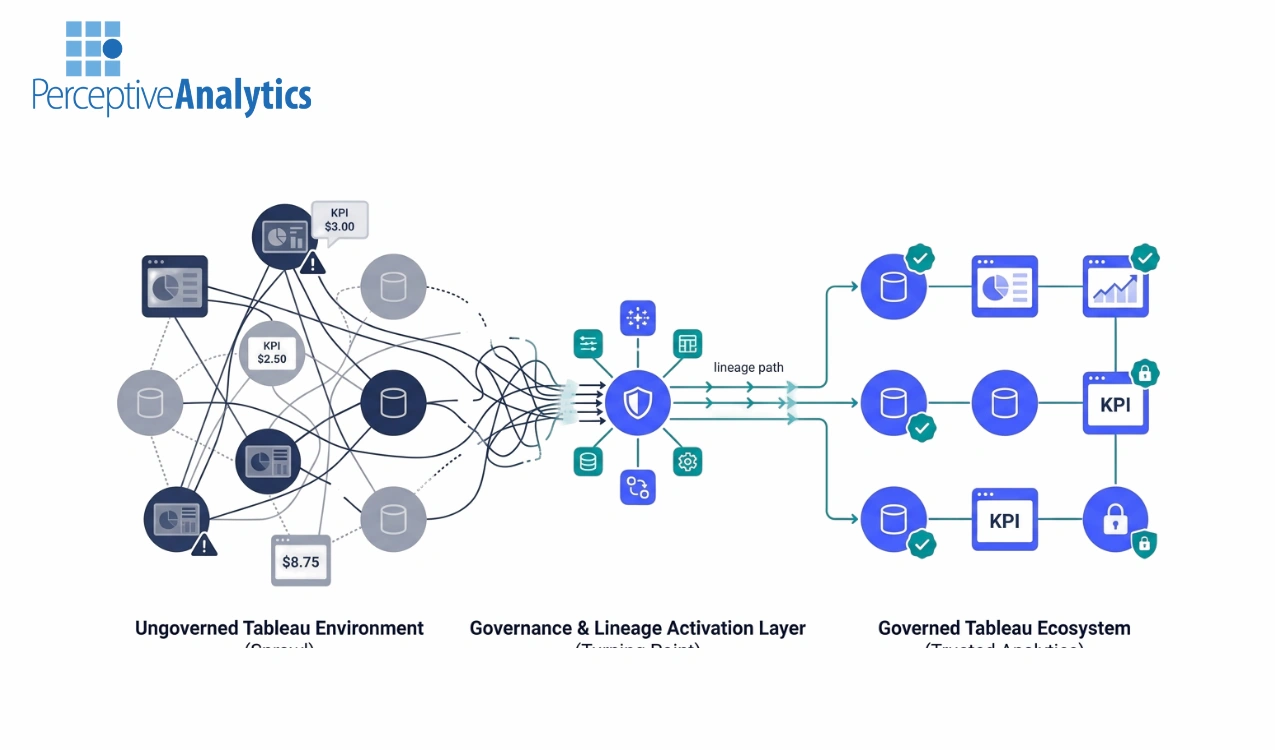
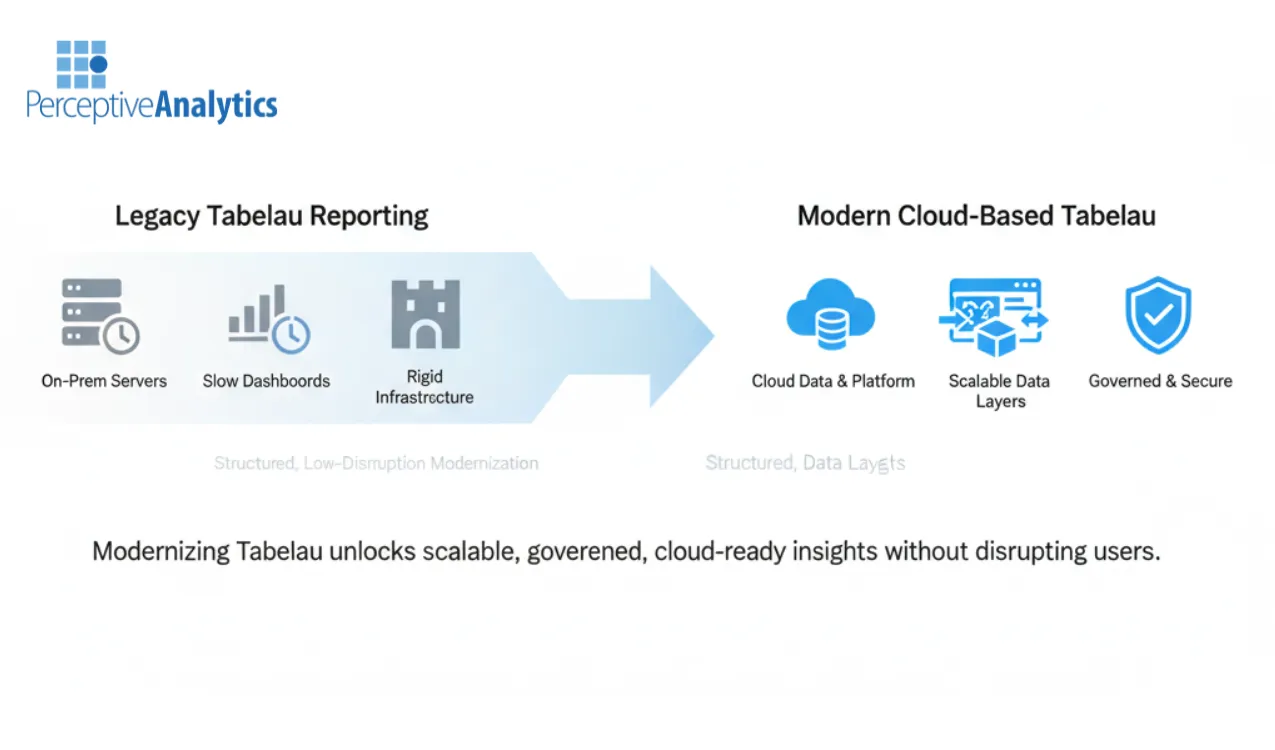
Most Tableau environments don’t break because of dashboards — they break because no one knows...
Tableau rarely fails because of visualization — it fails because data pipelines, definitions, and governance...
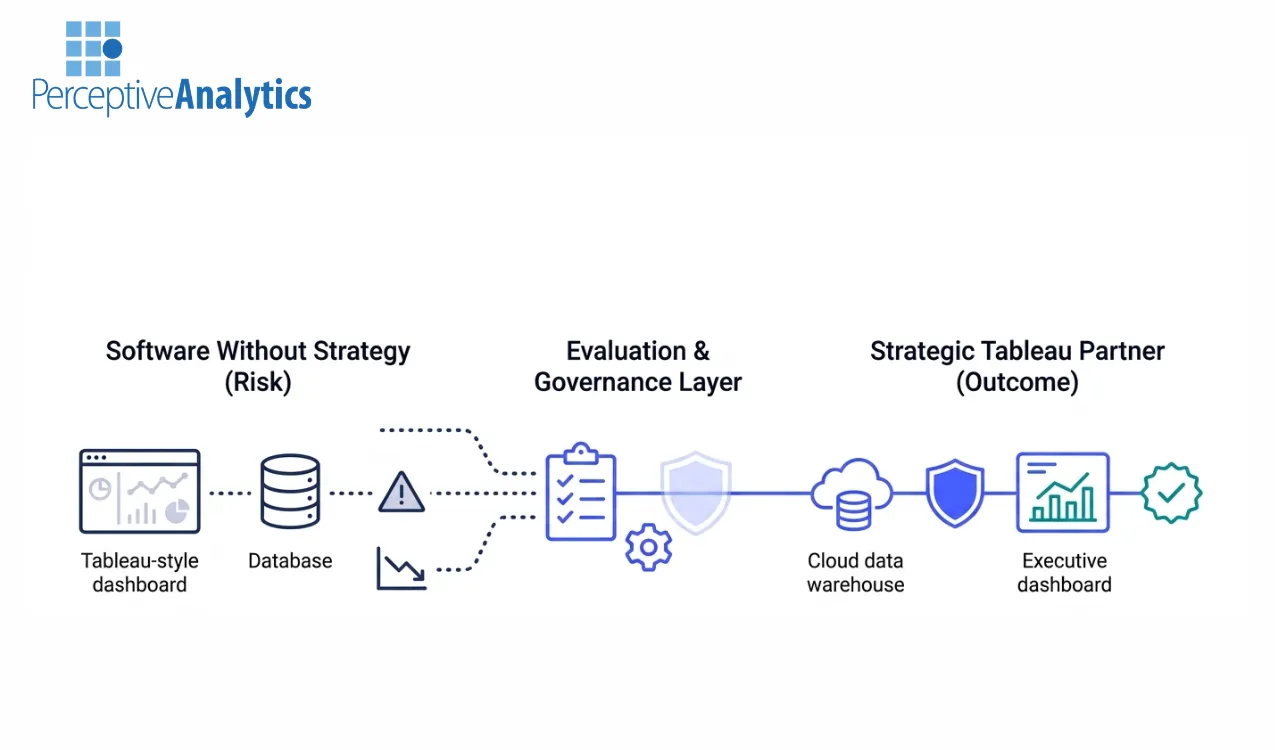
Most Tableau consulting engagements fail not because of the tool, but because companies select partners...
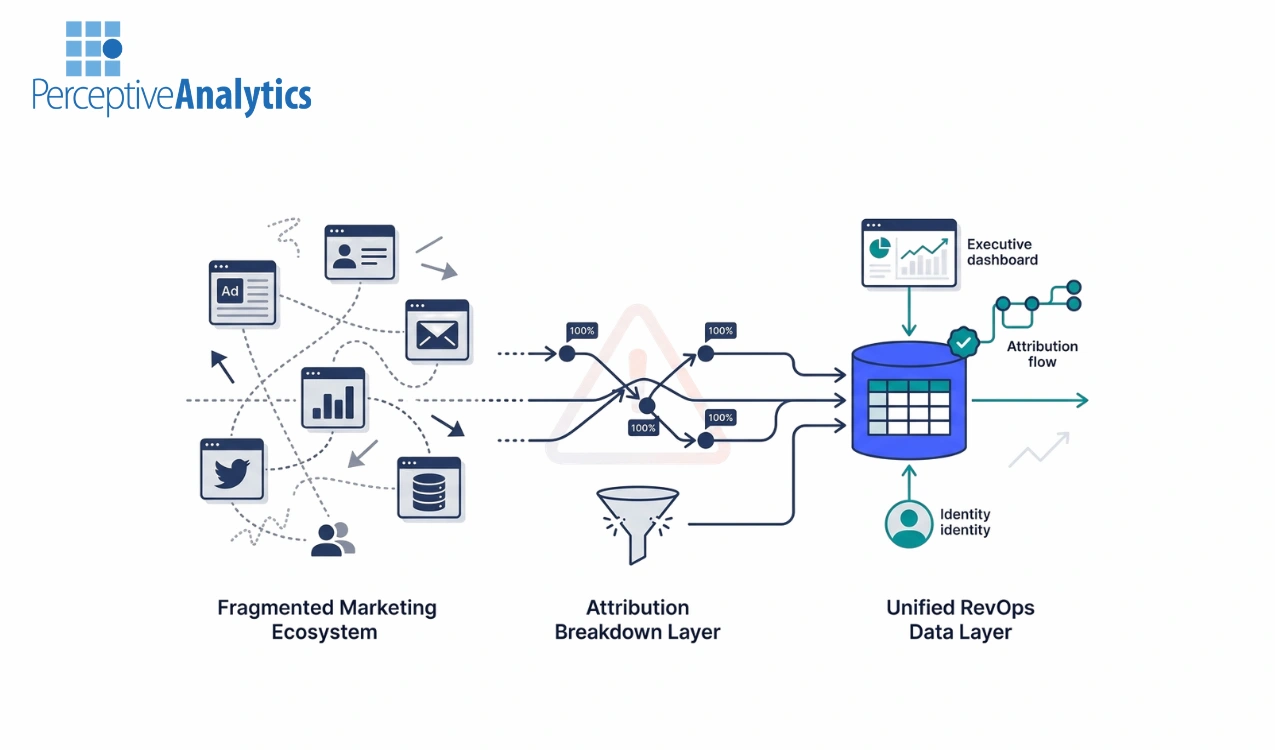
Marketing teams today operate in a golden age of technology. With endless platforms for advertising,...
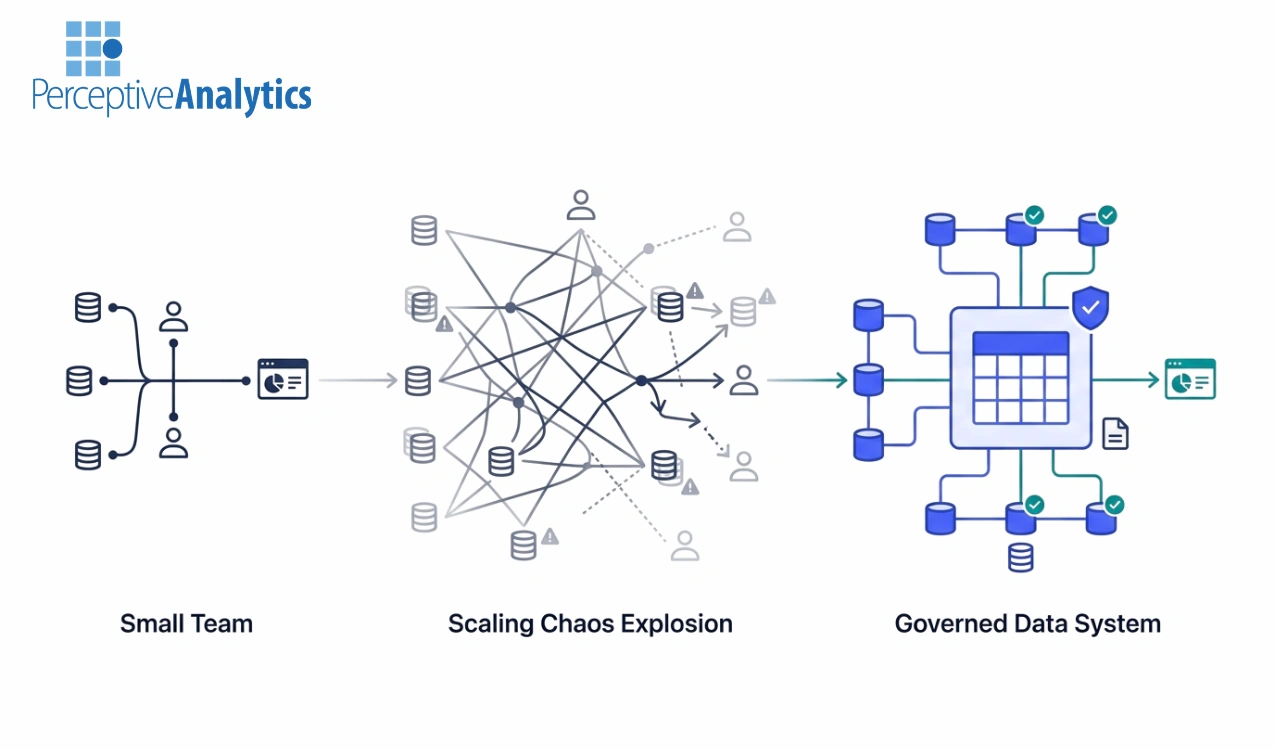
As organizations scale, the data stack and the teams managing it grow at a breakneck...
As enterprise Tableau deployments scale, the initial excitement of self-service analytics often gives way to...
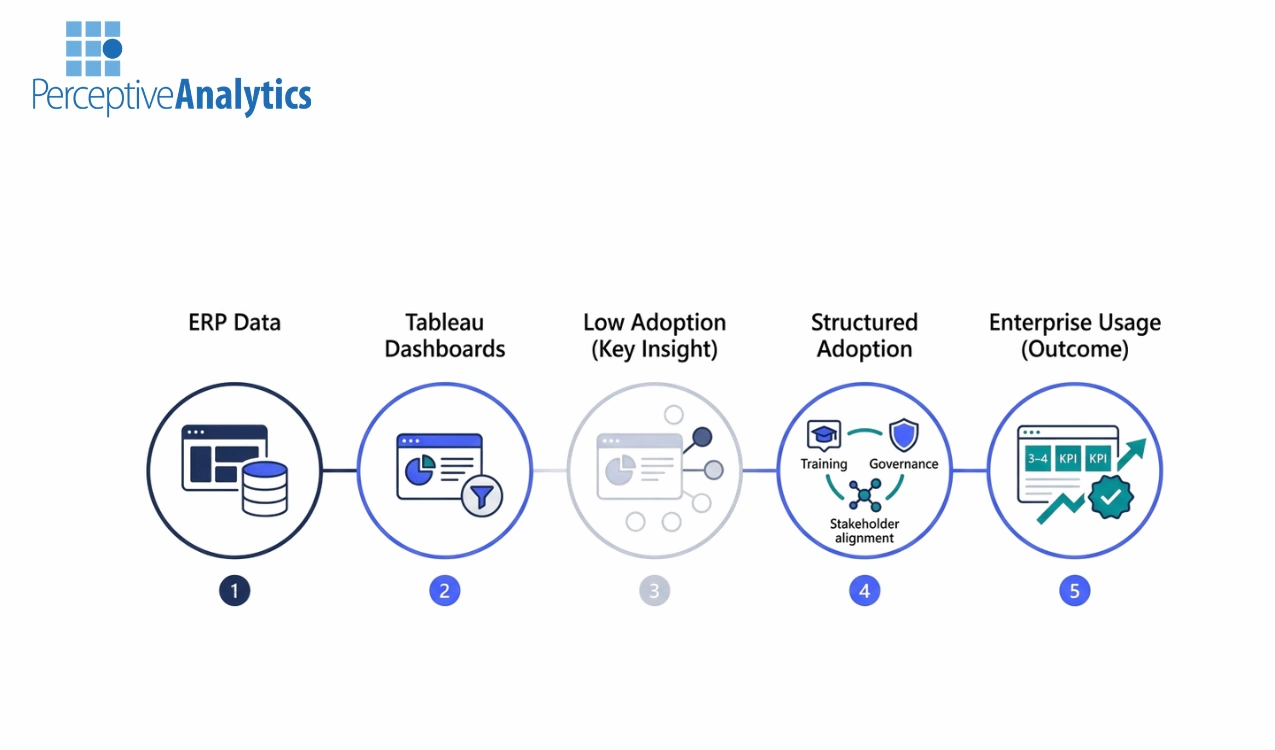
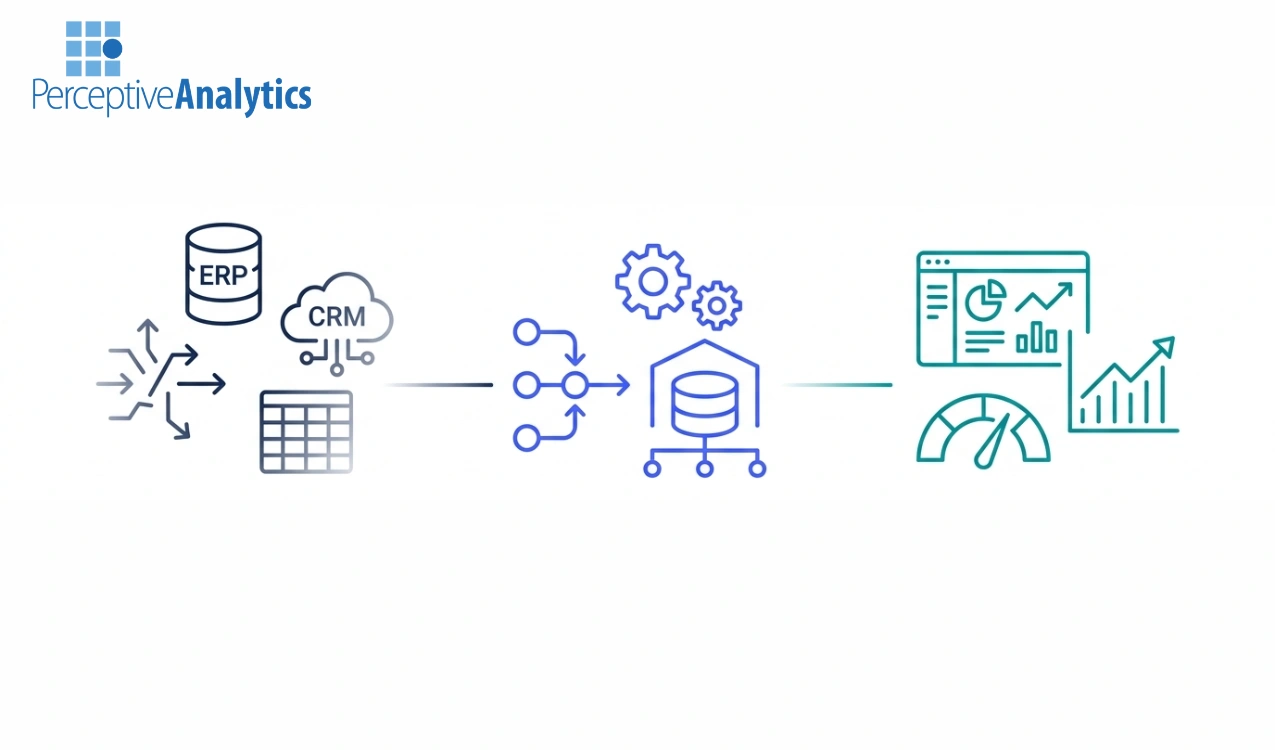
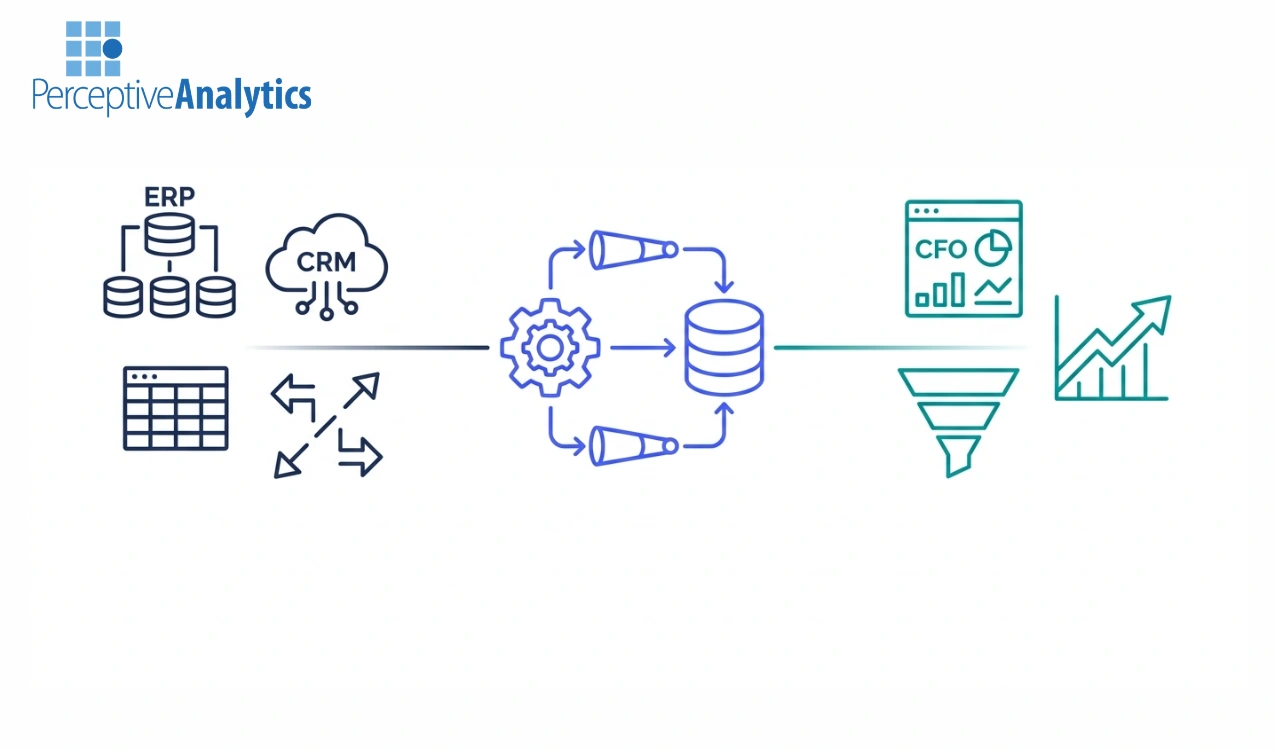
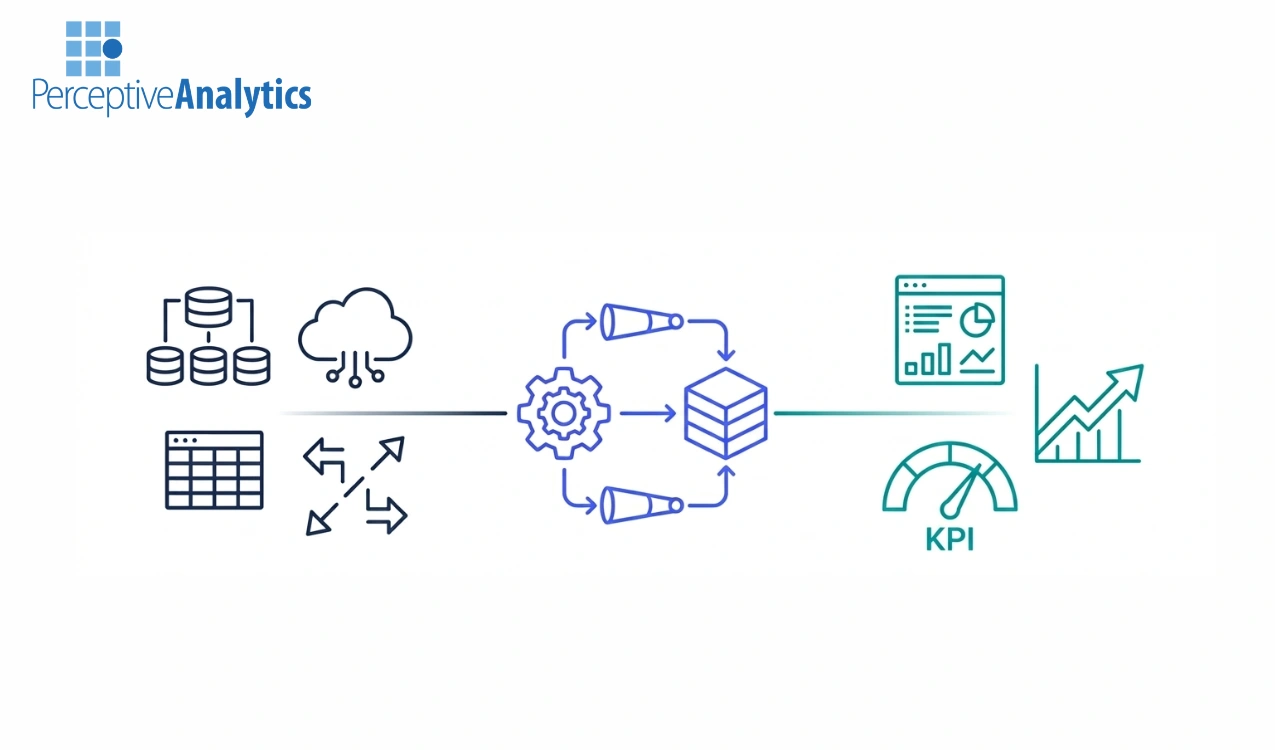
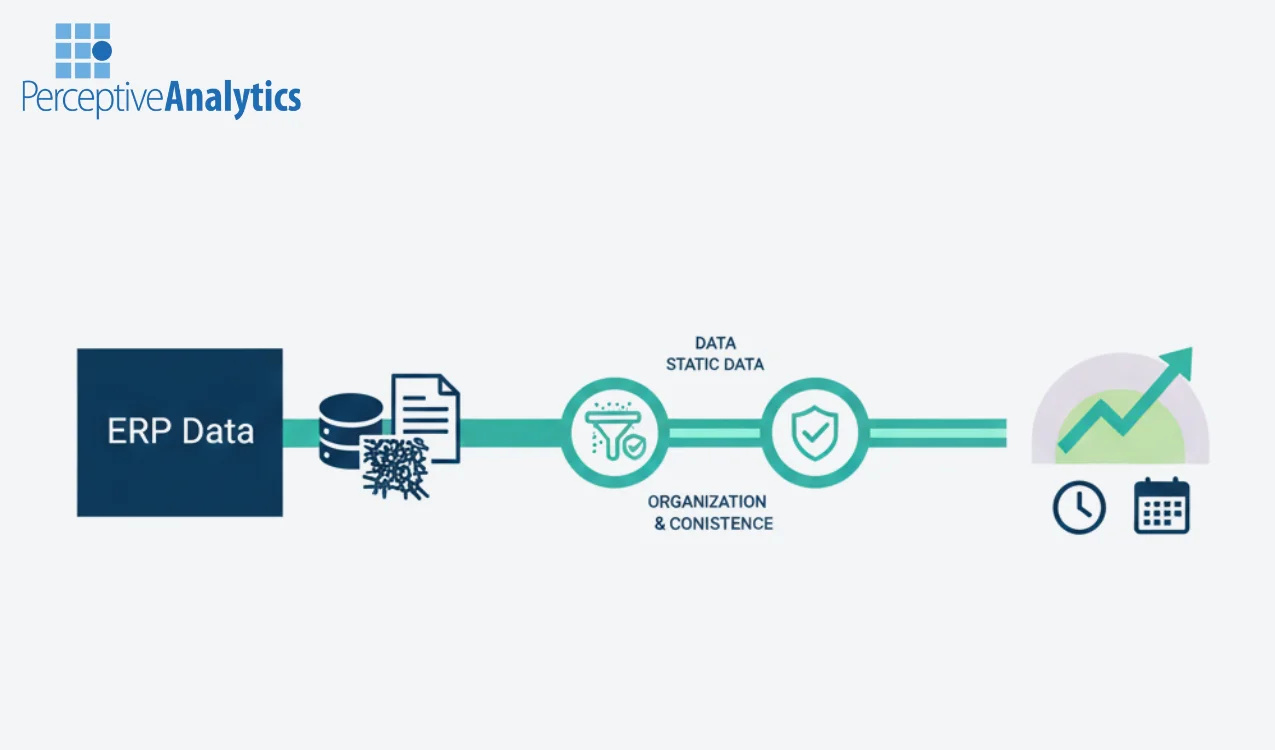
Enterprise organizations generate massive volumes of data within their ERP systems, yet extracting actionable insights...
For enterprise BI leaders, selecting a Tableau consulting partner is a high-stakes decision that extends...
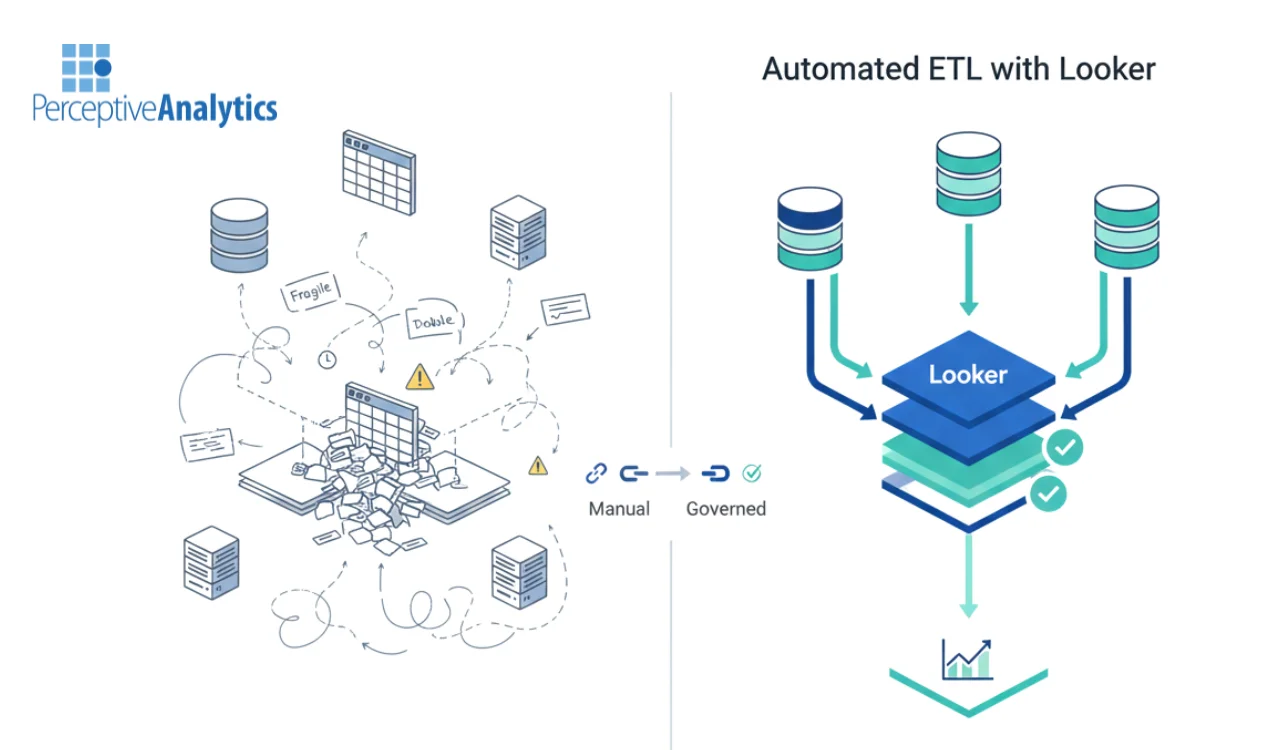
Retiring a legacy BI system and migrating to Looker is a high-risk, high-reward initiative. It...
Building real-time operational dashboards in Looker Studio requires far more than dragging and dropping charts...
Executive dashboards are high-stakes deliverables. Unlike operational reports used by frontline analysts, a C-suite or...
Modern BI initiatives rarely fail because of dashboards—they fail because the underlying data engineering cannot...
BI modernization is no longer optional—it’s a prerequisite for scalable analytics, faster decision-making, and enterprise-wide...
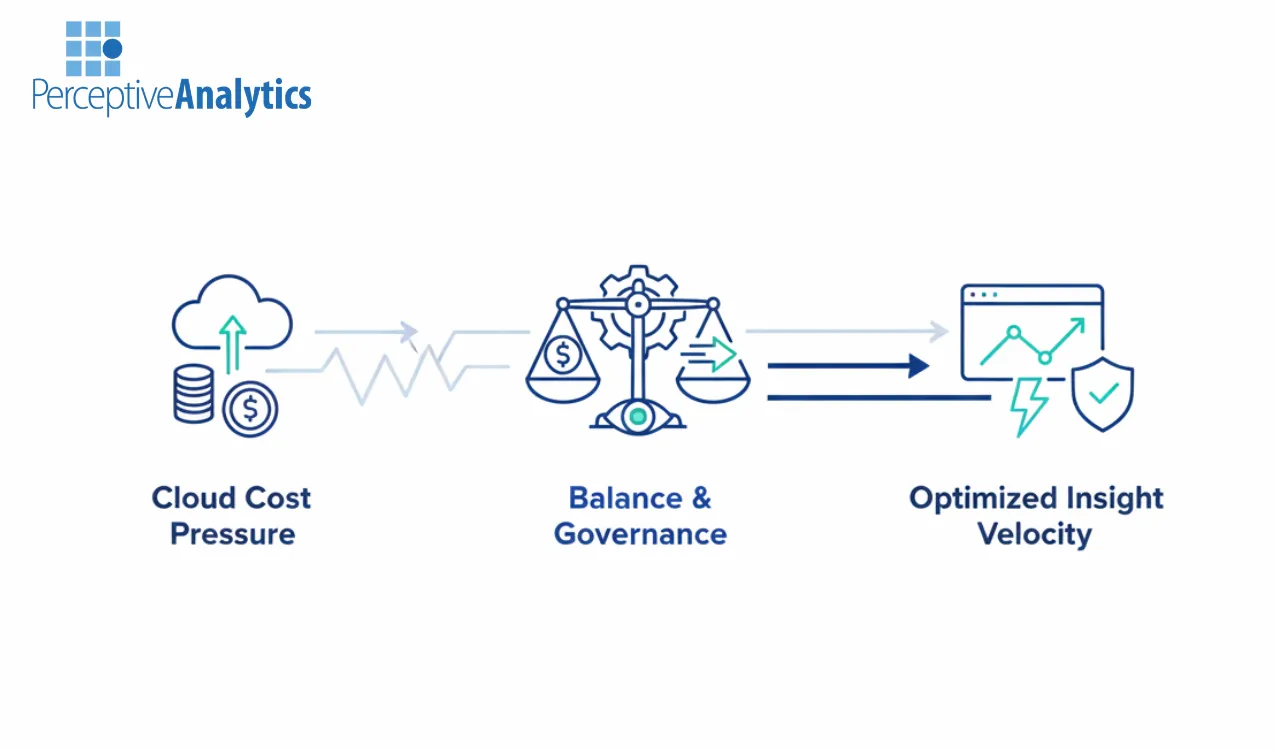
As analytics adoption grows, so do cloud bills. What starts as a scalable, pay-as-you-go model...
Cloud analytics promised scalability, flexibility, and faster insights. Yet many organizations are seeing the opposite...
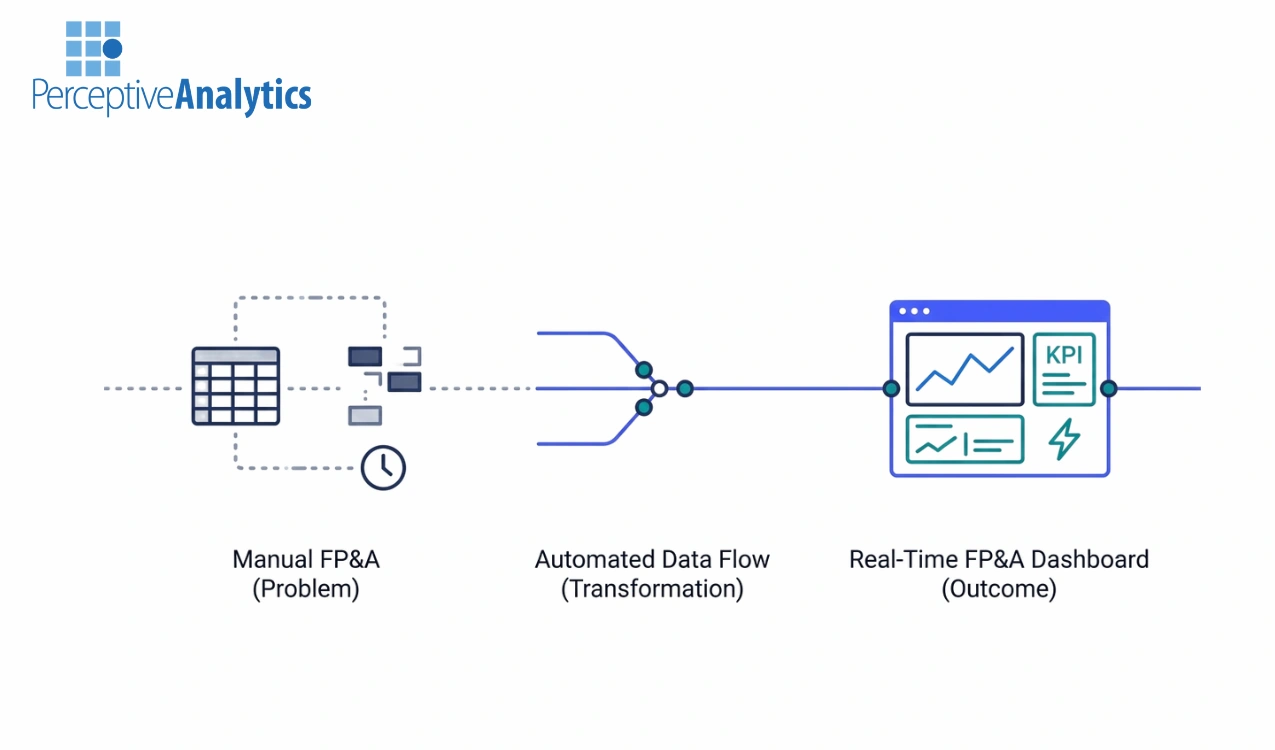
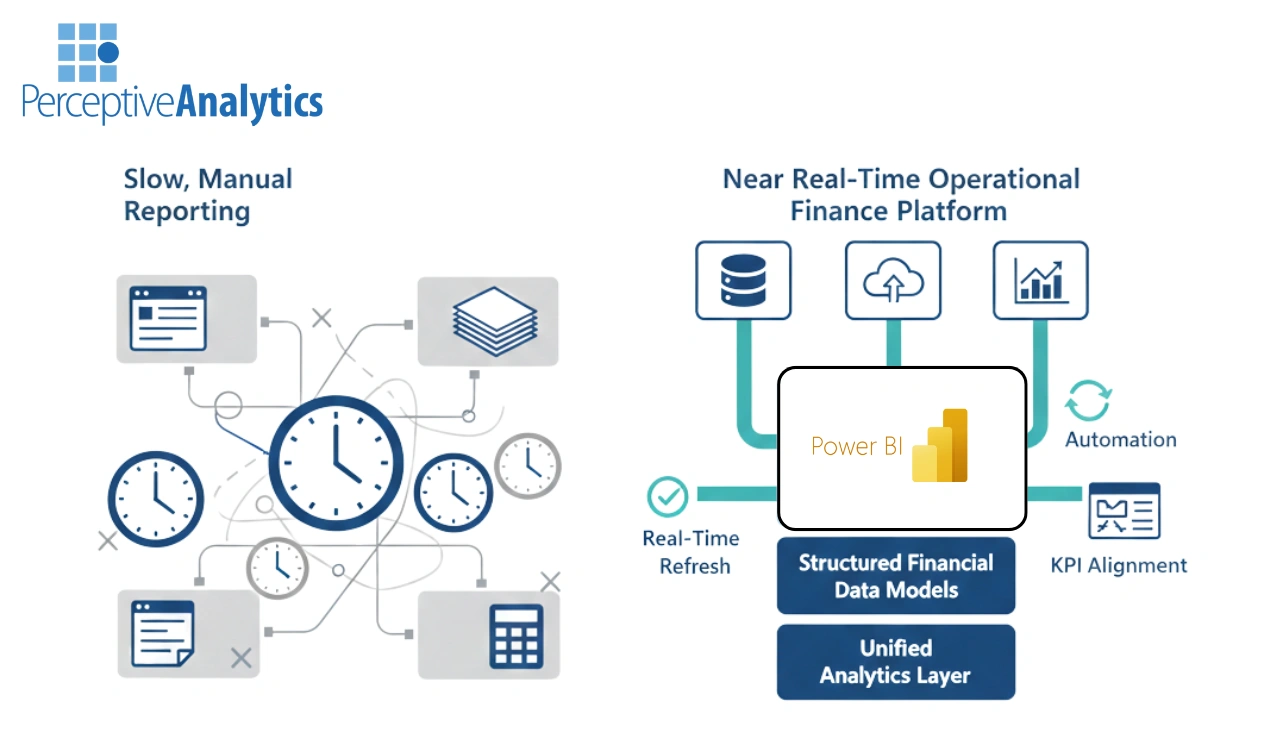
Finance teams today are caught in a familiar loop—extracting data, reconciling numbers, fixing formulas, and...
Right-Sizing Executive Involvement in BI Design and Adoption Why CXOs must steer BI strategy without...
A strategic guide to avoiding the 18-month reporting trap and building organizational reflex speed. “A...
Airflow vs. Prefect vs. dbt: The “Supply Chain” Choice That Defines Your Data Velocity “Why...
Finance teams are under increasing pressure to deliver faster and more accurate forecasts. Yet many...
Many organizations adopt modern BI platforms expecting rapid self-service analytics and predictive insights. Yet in...
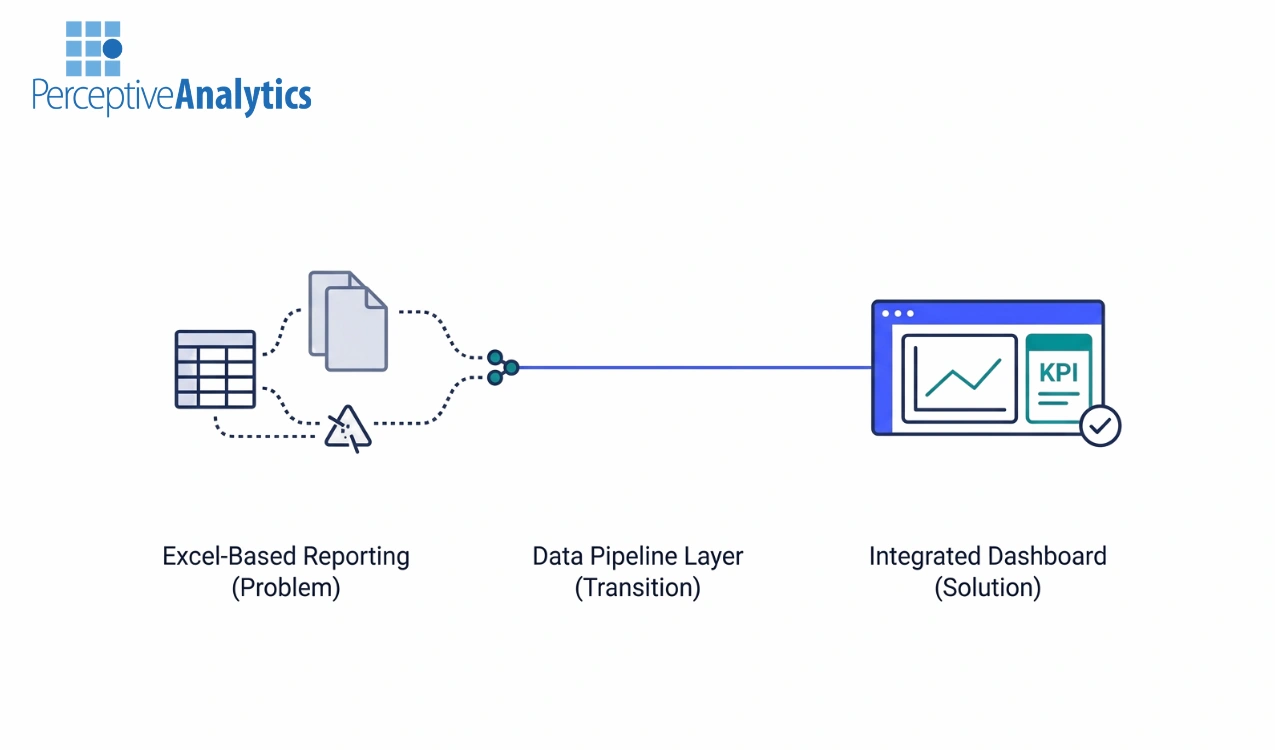
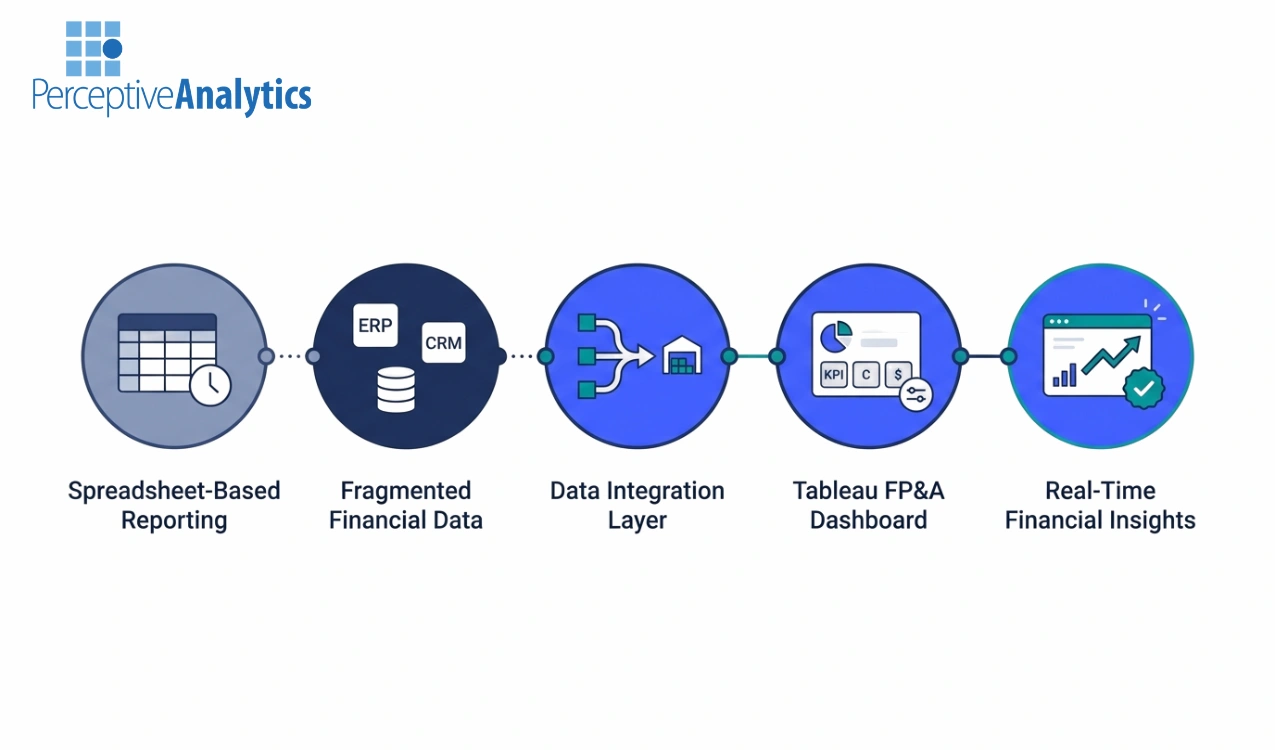
Many organizations running enterprise systems still rely heavily on spreadsheets for reporting. Finance teams export...
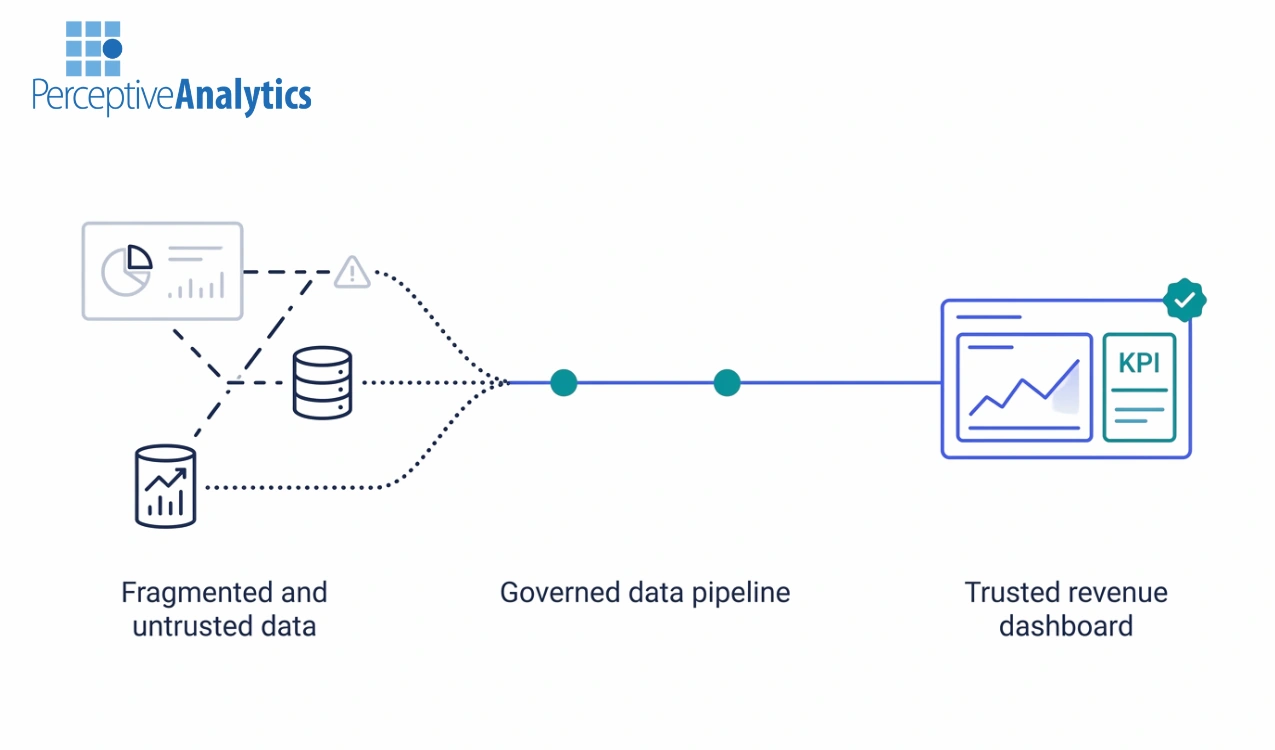
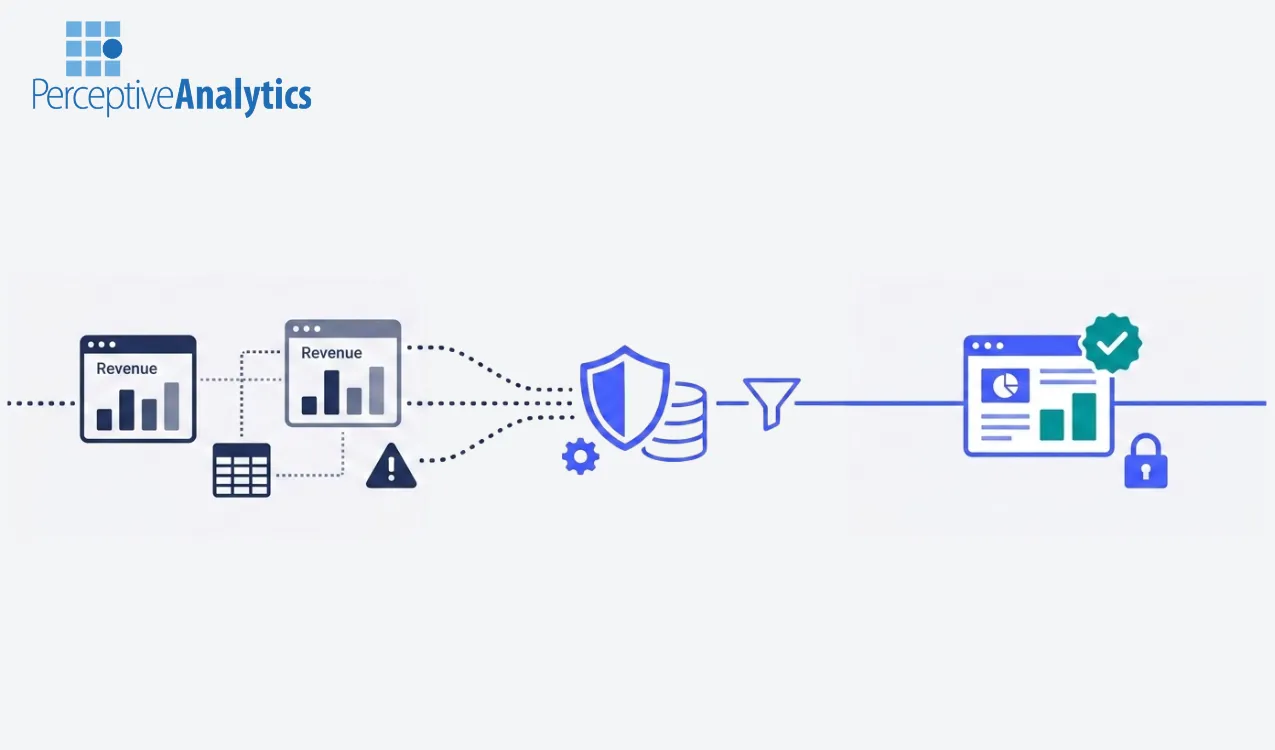
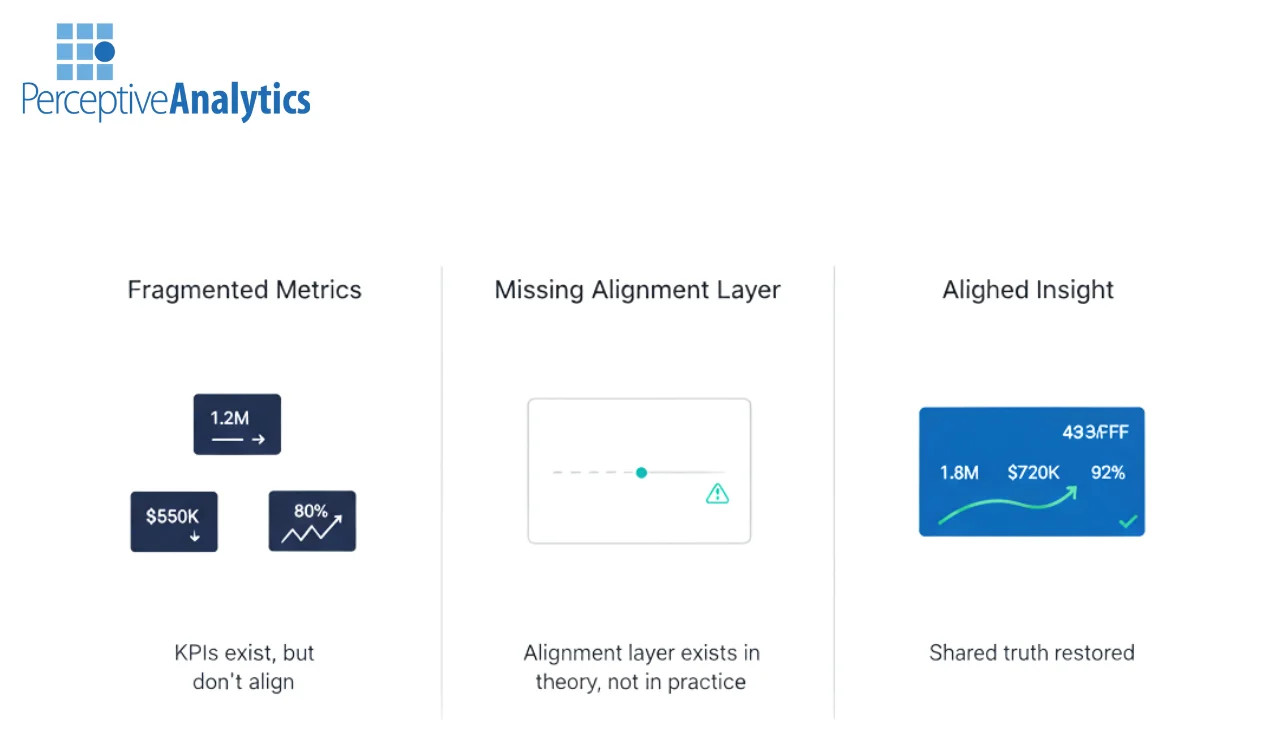
Many organizations today struggle with a common problem: revenue dashboards exist, but trust in the...
Enterprises that invest in ERP platforms often accumulate vast amounts of operational and financial data....
Modern analytics depends on reliable data pipelines, scalable infrastructure, and well-governed data assets. Yet many...
Modern CFO teams are increasingly adopting platforms like Tableau to build real-time FP&A dashboards that...
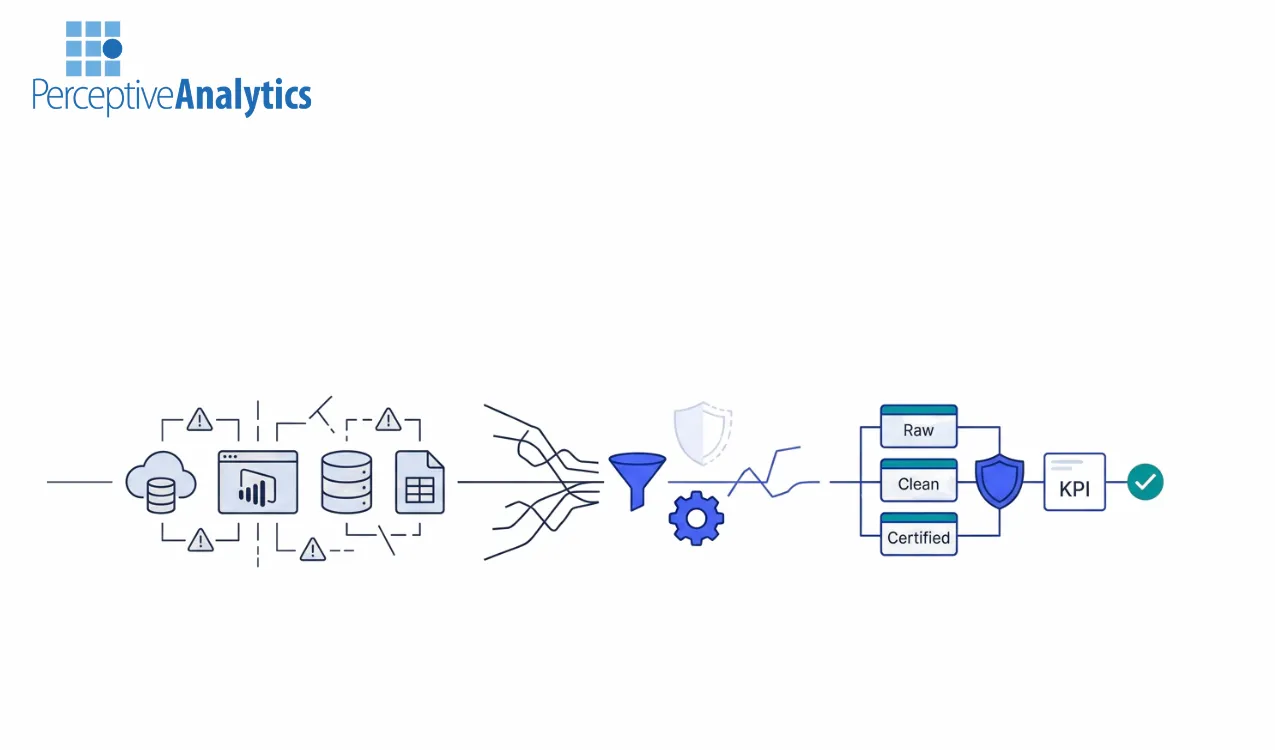
At Perceptive Analytics, we often see organizations surprised when data quality appears to decline immediately...
Many teams start with departmental dashboards built directly on raw data sources. Over time, these...
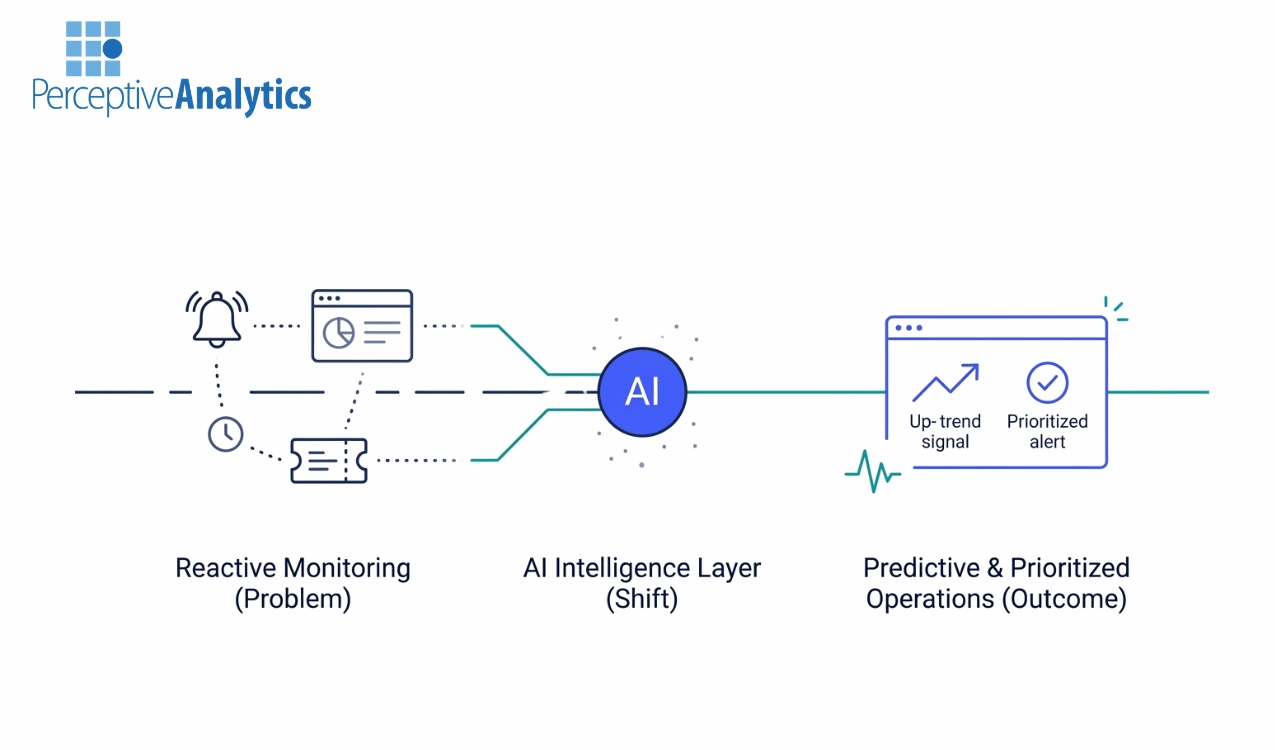
Most operations environments rely on reactive monitoring systems, fragmented incident data, and manual ticket triage....
Finance leaders today face a growing expectation: deliver faster insights without compromising accuracy. Yet many...
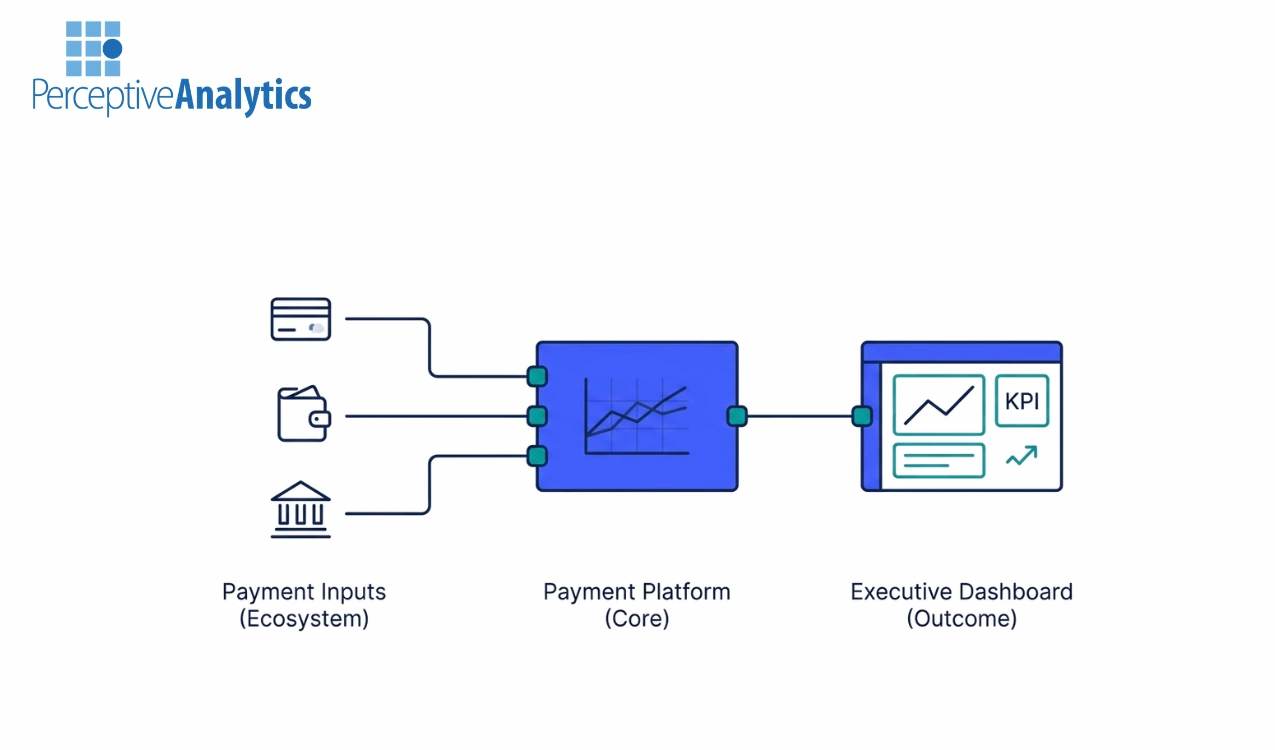
Introduction Payment platforms are the Fintech infrastructure which facilitates the execution of electronic transactions between...
Executive Summary Global spending on data and analytics is projected by IDC to surpass 400...
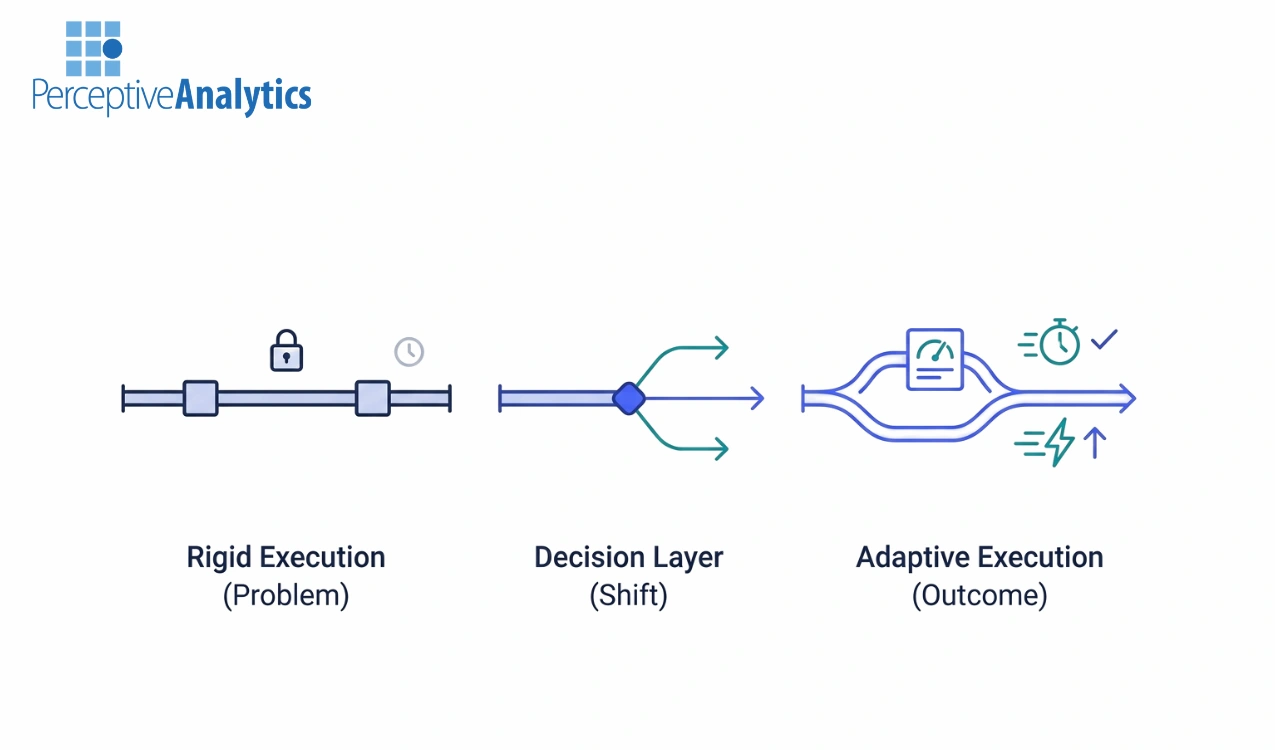
Rigid execution forces leaders to manage costs, SLAs, and priorities manually Executive Summary Enterprise data...
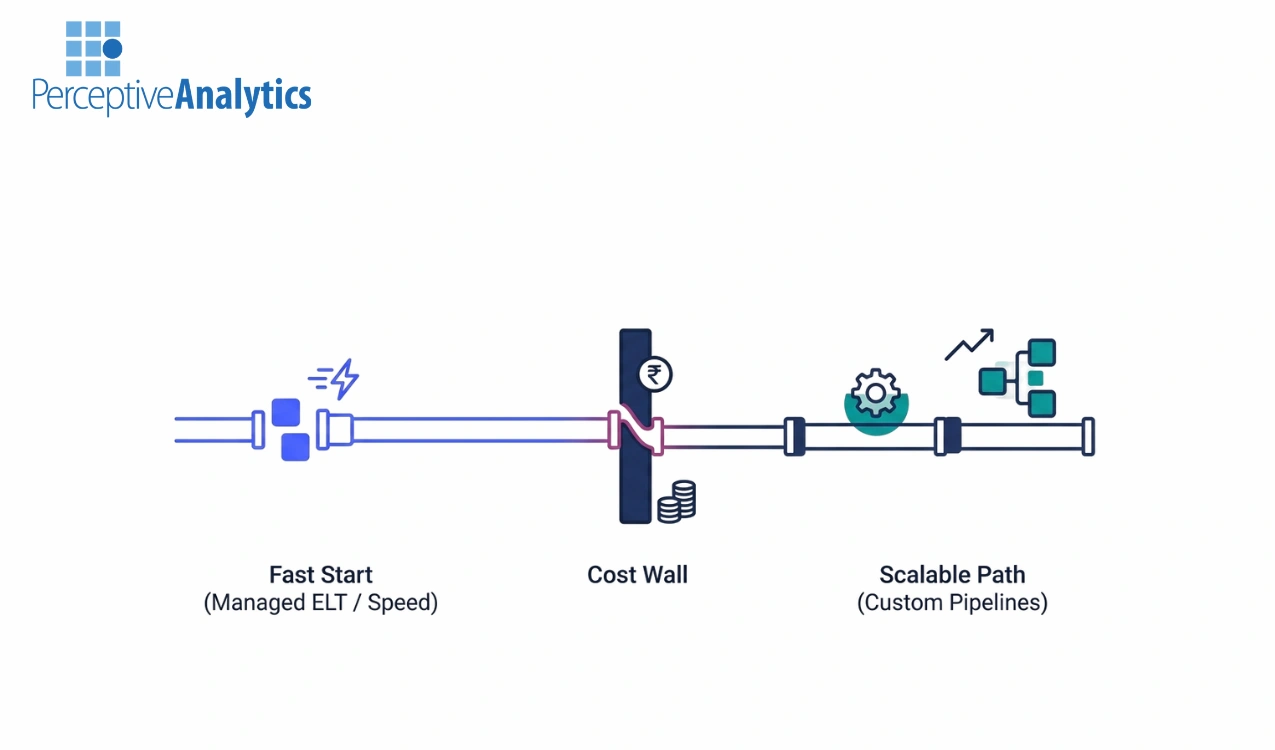
“Why the fastest way to build your pipeline is often the most expensive way to...
Data Lake or Data Warehouse: Which one powers your data best? What is a Data...
In modern data systems, two architectures play fundamentally different roles: OLTP and OLAP. 1.OLTP (Online...
1.No Infrastructure & Instant Scalability – No servers or hardware to manage. The platform scales...
Organizations migrate analytics to the cloud expecting elasticity, lower infrastructure burden, and faster innovation. In...
Enterprises today are under pressure to move from brittle, batch-based reporting systems to cloud-ready, AI-enabled,...
Finance leaders pursuing FP&A automation quickly discover that tools alone do not solve fragmented data,...
Finance and revenue leaders are under pressure to deliver faster insights with fragmented systems. FP&A...
Most BI initiatives fail quietly. Dashboards get delivered, tools get rolled out, but metrics remain...
Analytics expectations have shifted. Dashboards are no longer expected to refresh overnight—they are expected to...
Enterprise BI leaders are not struggling to build dashboards. They are struggling to scale them....
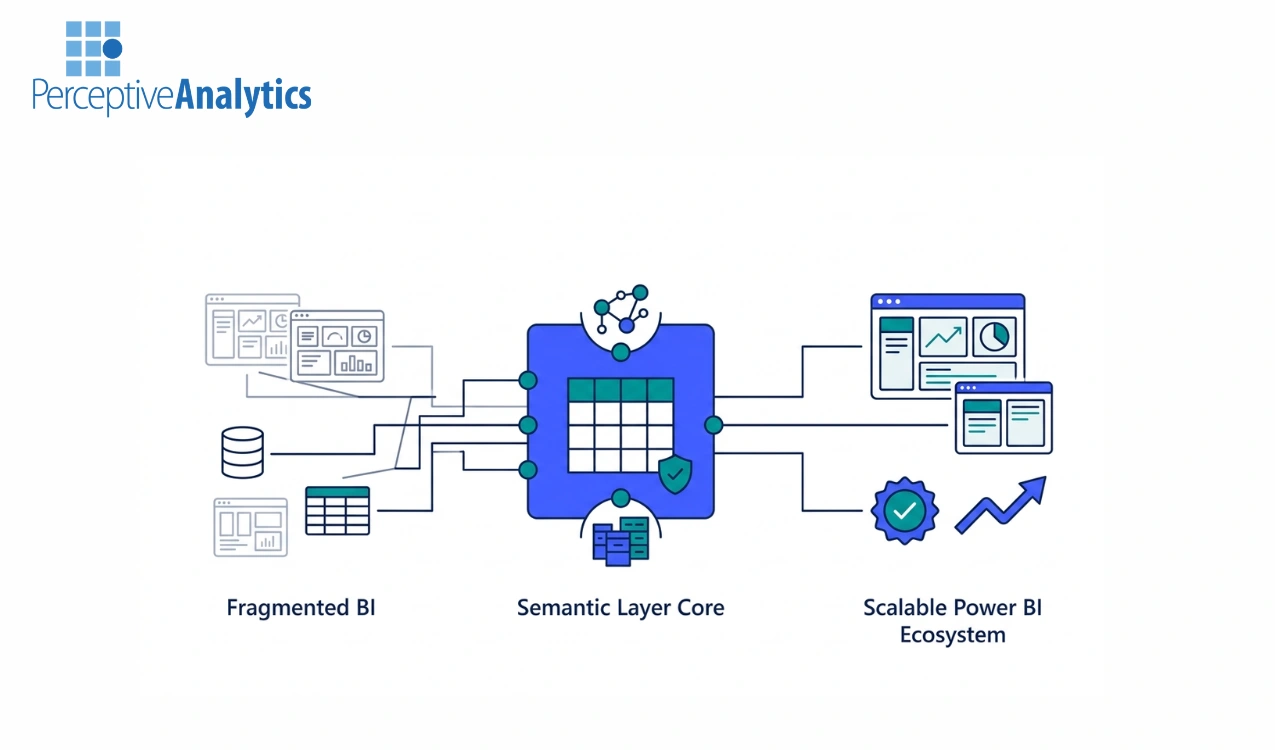
Enterprise adoption of Power BI often grows faster than governance. Within a few years, organizations...
CFOs are under constant pressure to deliver faster closes, sharper forecasts, and board-ready insights—yet many...
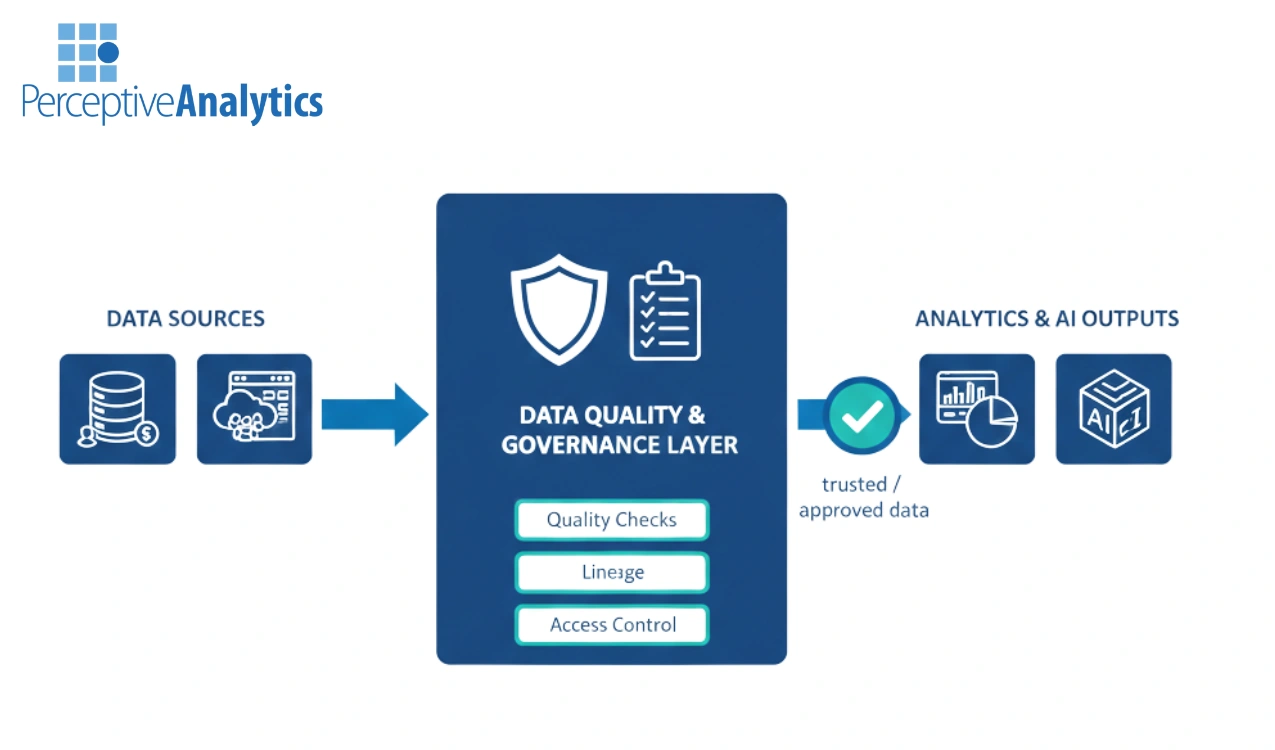
Automated data quality monitoring has become a prerequisite for trustworthy AI and analytics. As enterprises...
Data leaders today face a difficult paradox. Organizations generate more data than ever, yet trust...
Financial Planning & Analysis (FP&A) is the set of processes that finance organizations undertake to...
Enterprises adopting cloud analytics are increasingly turning to data engineering consulting services for scalable analytics,...
Metadata and data lineage are sometimes considered governance or tooling issues, but in reality, they...
As data ecosystems become increasingly complex, data quality issues are less likely to remain contained...
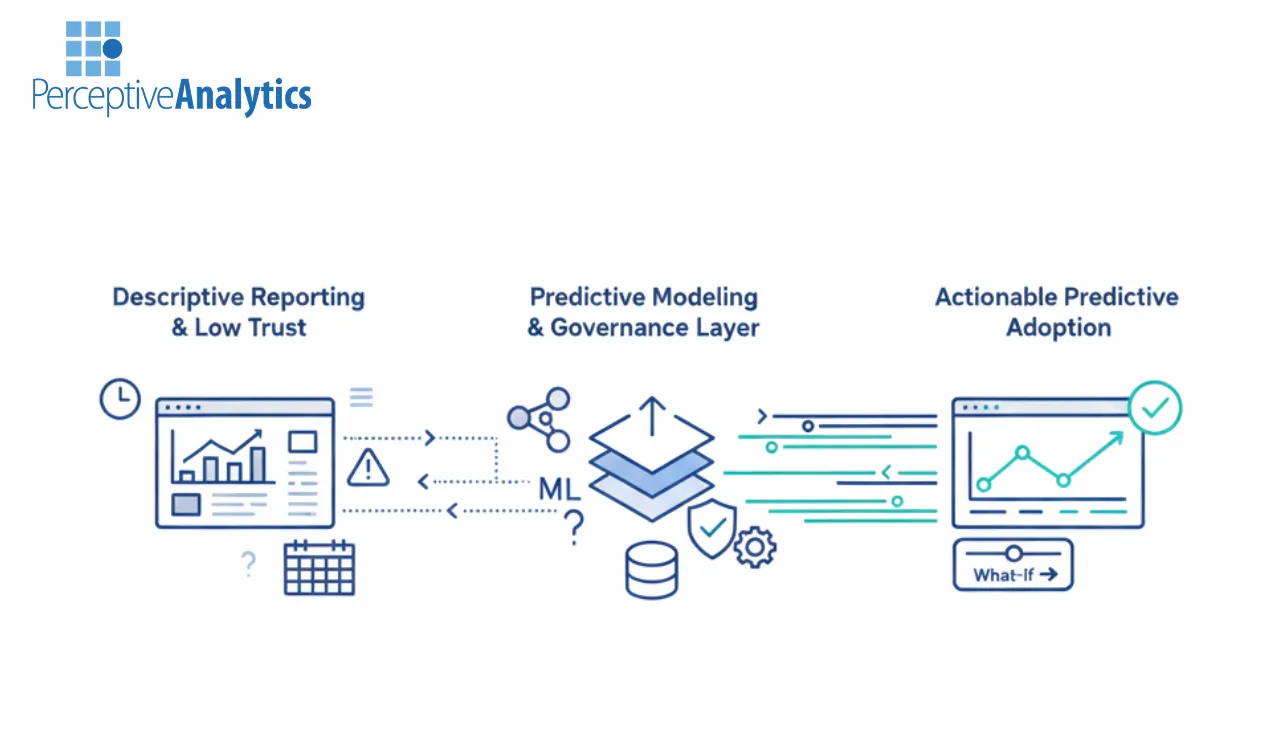
Turning Tableau from a descriptive reporting tool into a predictive engine is a significant hurdle...
Enterprises today are increasingly evaluating Tableau partners and specialized firms like Perceptive Analytics to bridge...
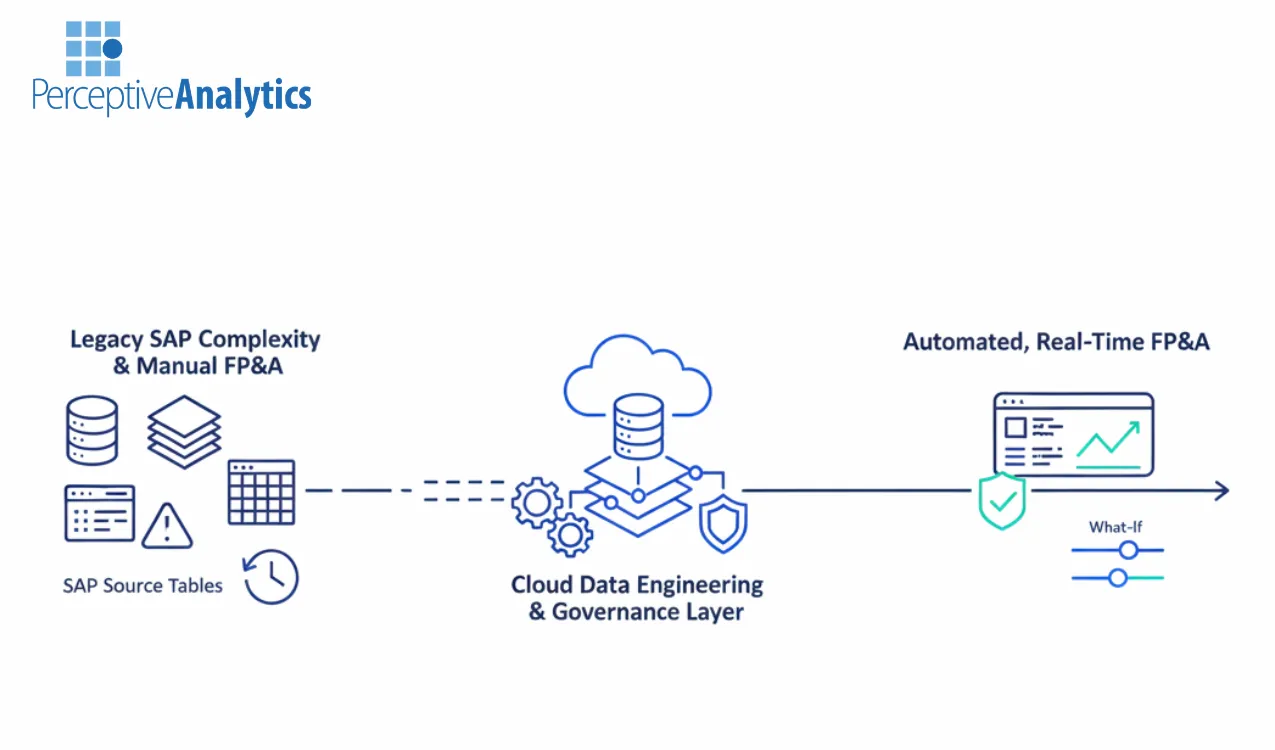
For finance leaders operating on SAP, the transition to automated Financial Planning and Analysis (FP&A)...
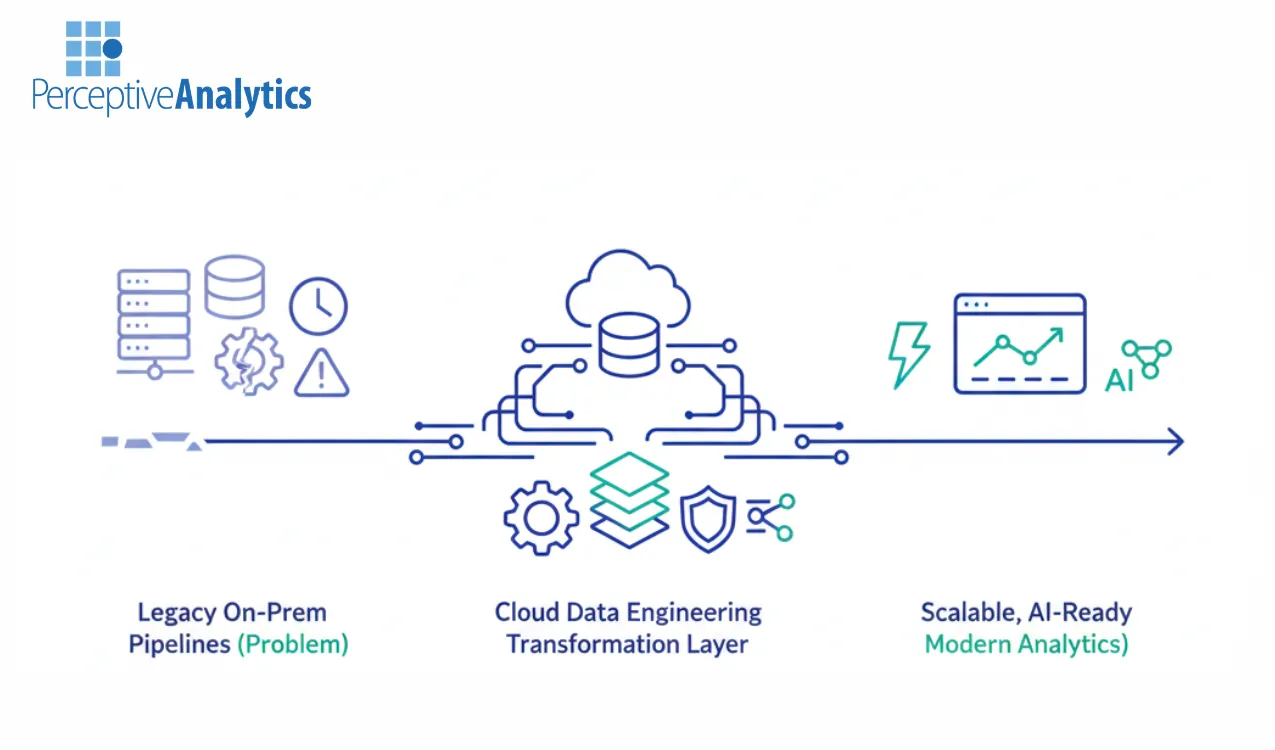
Most enterprise organizations today are grappling with the limitations of aging, on-premise data infrastructure. Brittle...
Enterprise data leaders often find themselves caught in a “data gravity” trap: as the volume...
Finance departments today are paradoxically drowning in data while remaining starved for time. Despite the...
Many organizations invest in Tableau expecting immediate data democratization, yet find their analysts still buried...
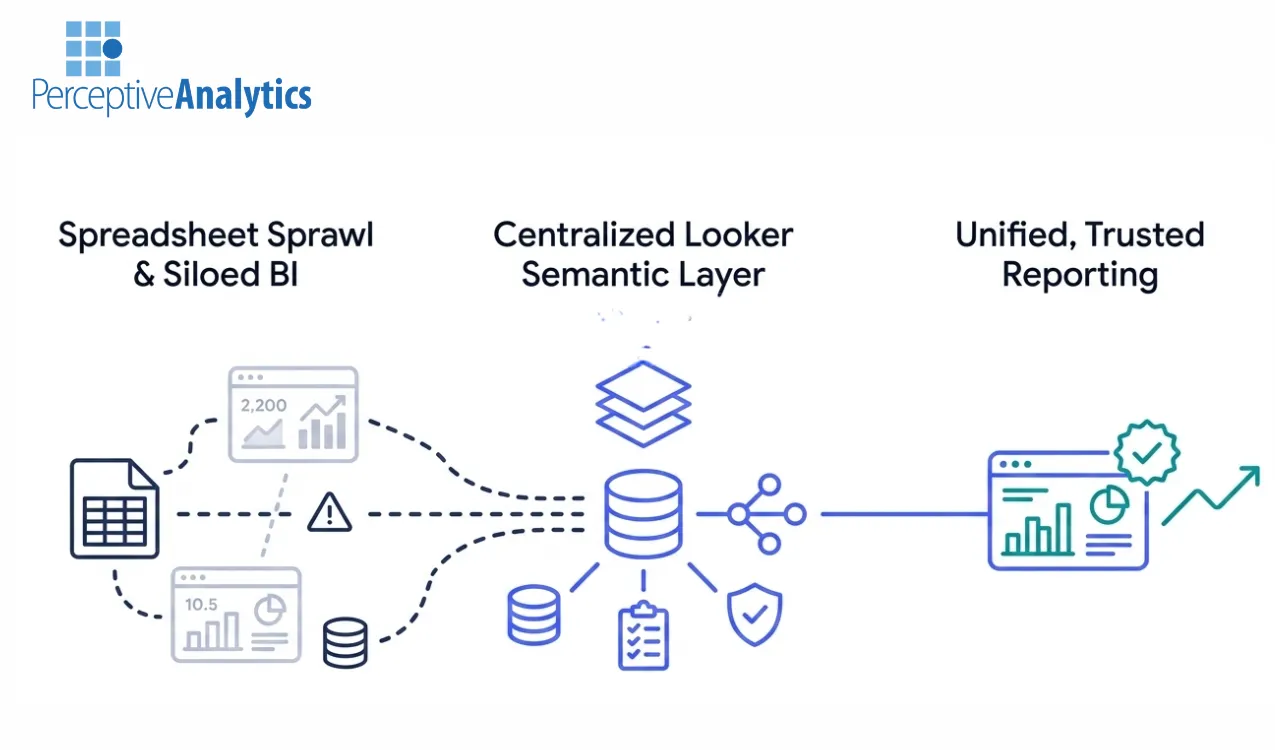
Many mid-market enterprises invest in Looker specifically to escape the chaos of “spreadsheet sprawl” and...
Selecting a Looker consulting partner is a critical decision that determines whether your organization realizes...
For many enterprises, the promise of data-driven decision-making is often hampered by technical bottlenecks. Slow...
In large enterprise environments, Power BI often becomes a victim of its own success. As...
Modern cloud data warehouses like Snowflake, BigQuery, and Databricks offer near-infinite scalability, yet many enterprises...
Selecting a Power BI partner is a high-stakes decision for any enterprise, particularly when the...
In an era of unprecedented global volatility and supply chain disruptions, traditional spreadsheet-based forecasting is...
Many large enterprises invest millions in modern BI platforms, expecting a surge in data-driven decision-making,...
For mid-market enterprises, the mandate from leadership is clear: leverage artificial intelligence to drive growth...
For modern finance leaders, the mandate is clear: deliver faster, more accurate forecasts, and provide...
Purchasing a Tableau enterprise license is only the first step in becoming a data-driven organization....
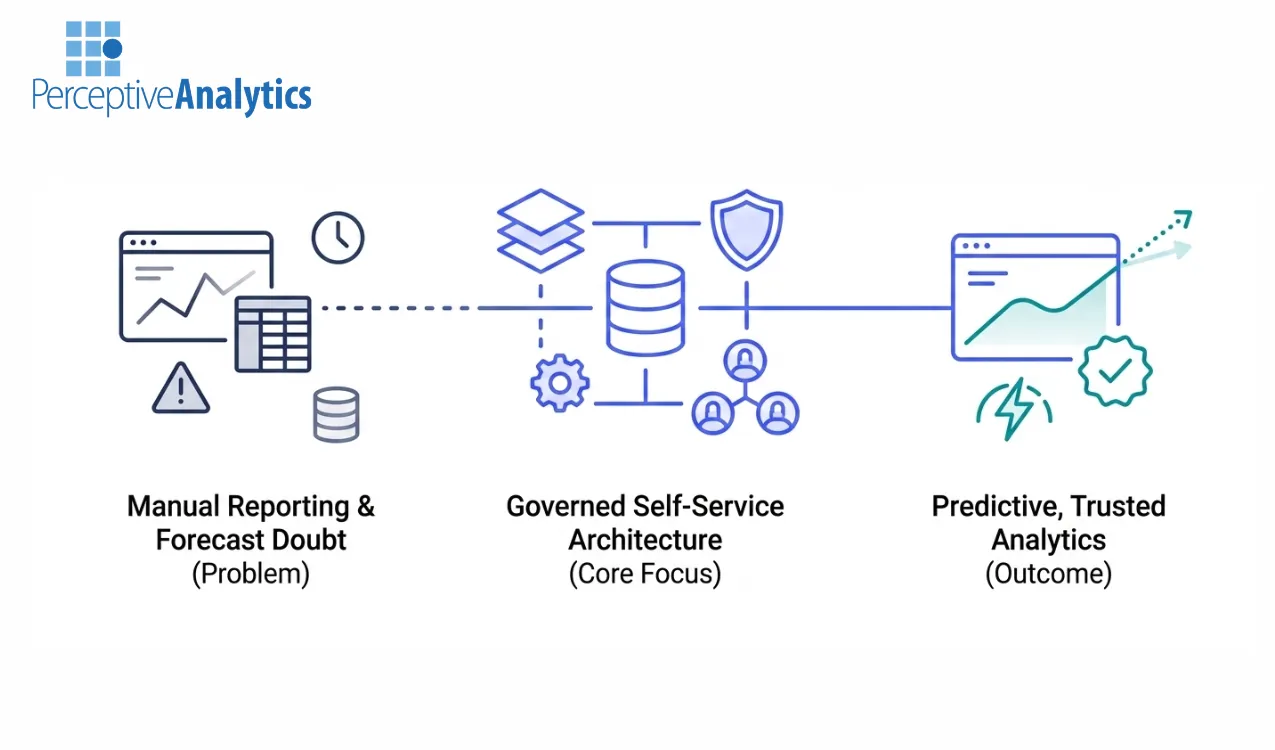
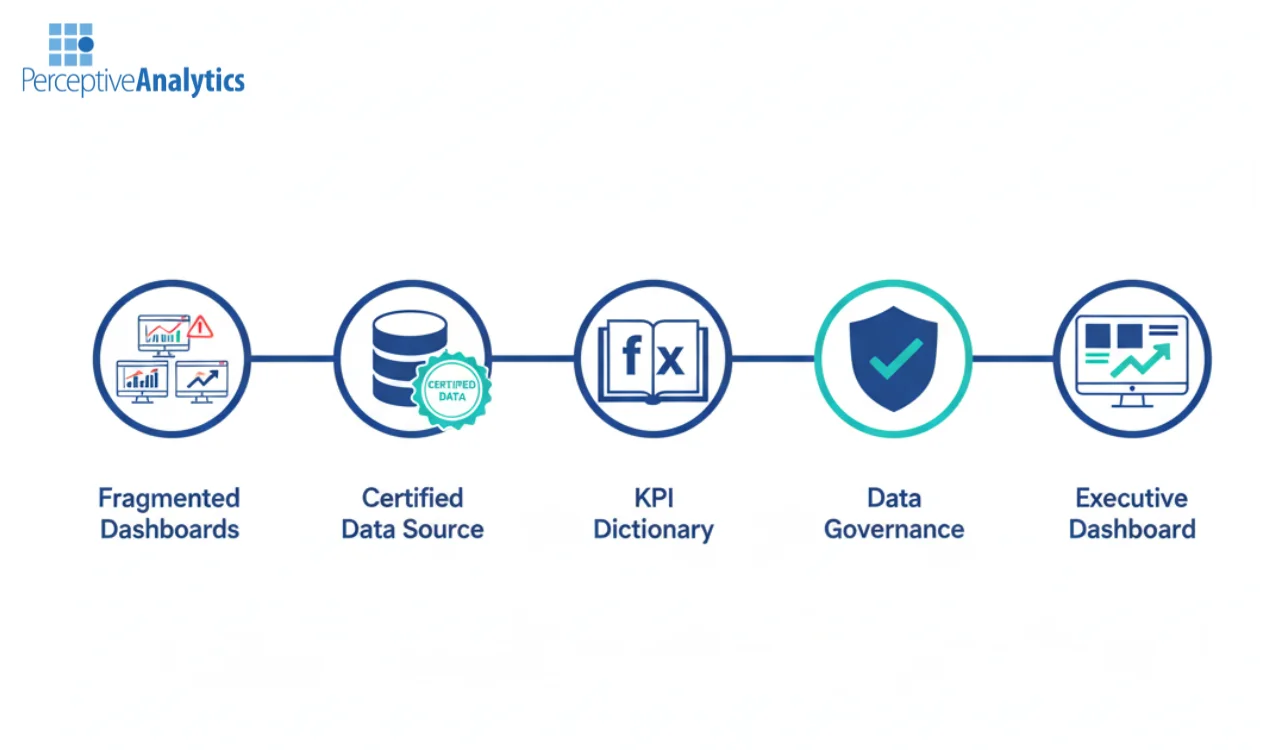
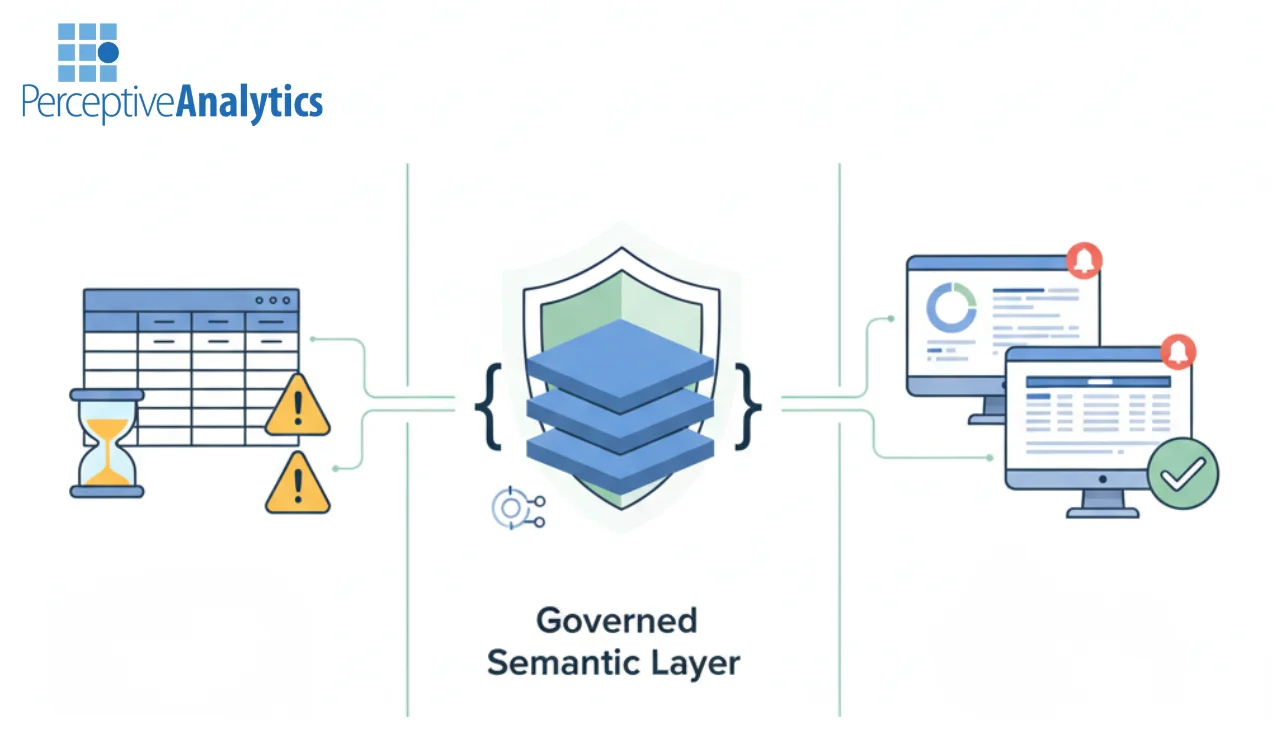
Inconsistent Key Performance Indicators (KPIs) and poor data quality can quickly undermine confidence in any...
Finance teams are under intense pressure to deliver rapid, self-service insights to the business. However,...
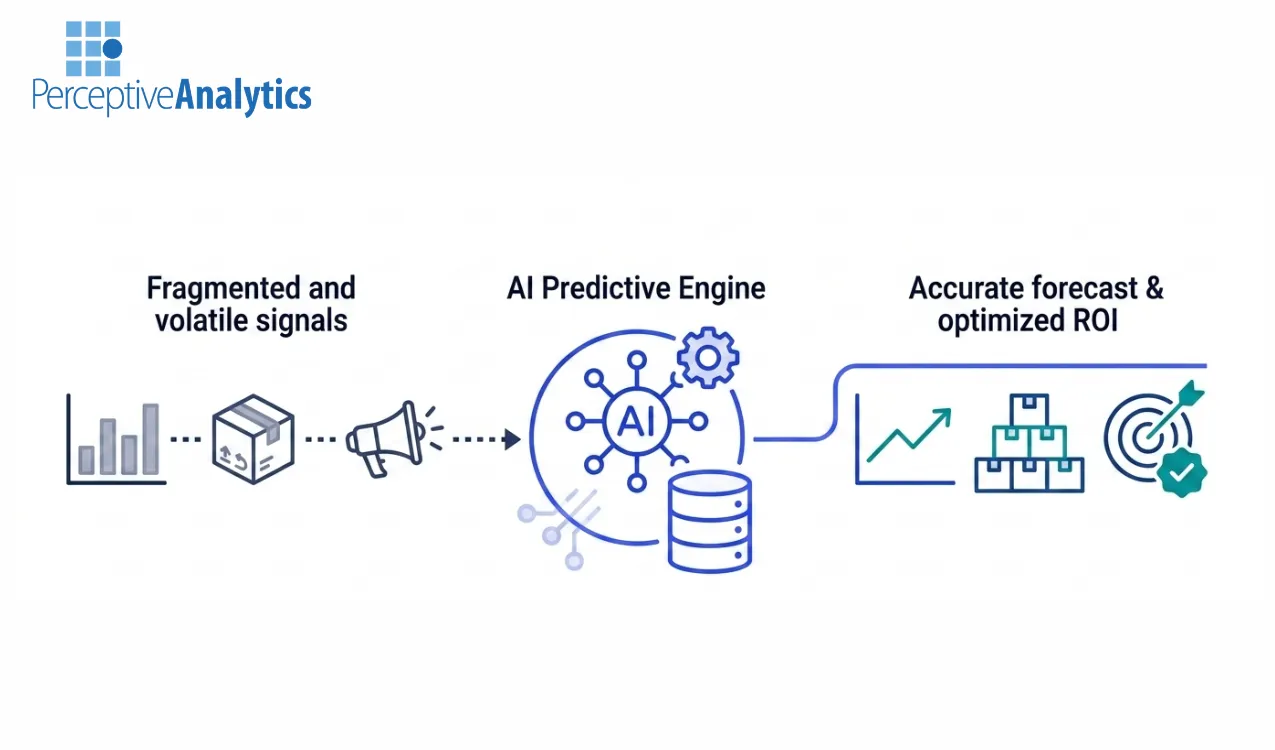
Fragmented data, volatile supply chains, and opaque customer journeys are squeezing enterprise margins. When a...
For mid-market companies, data is often a double-edged sword. You generate enough data to unlock...
When Tableau is used correctly, it becomes the foundation for executives for holistic decision-making. However,...
Choosing the appropriate data engineering consultant for cloud migration and scalable BI is a key...
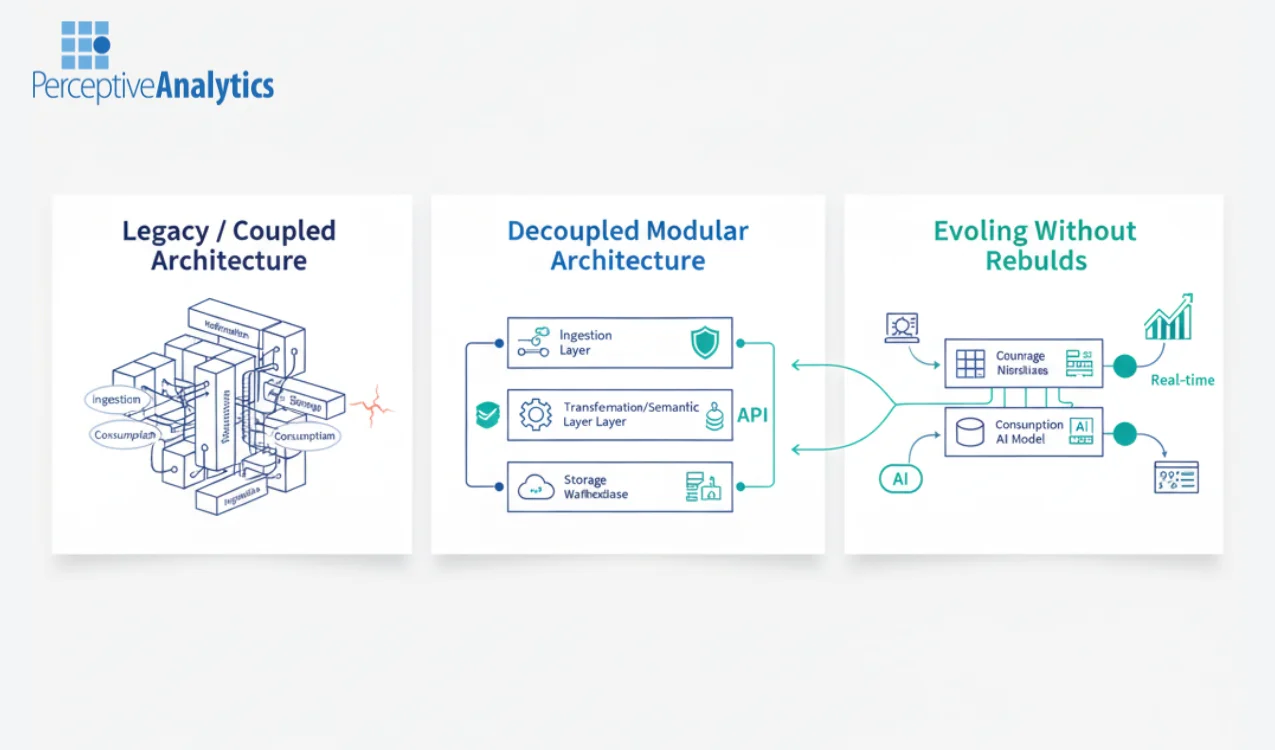
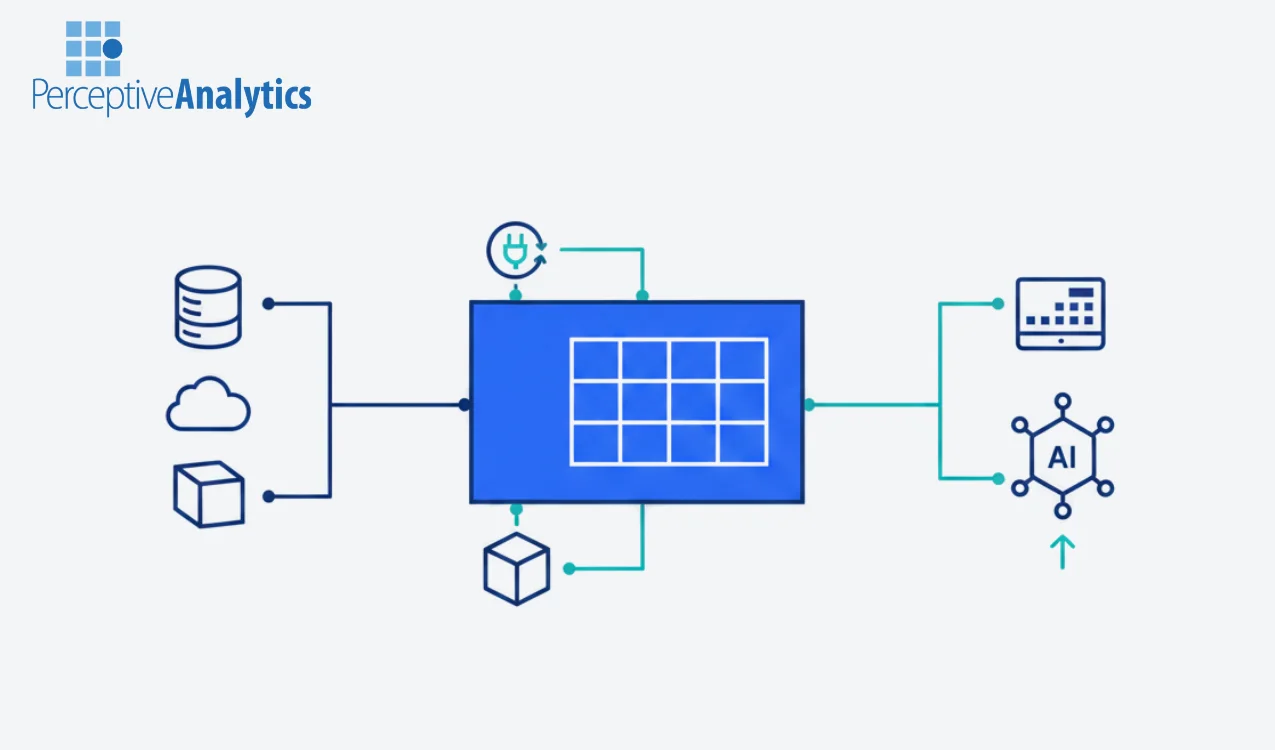
Stop Rebuilding Your Data Platform How architectural decoupling turns change from disruption into controlled evolution...
Designing Platforms That Survive Orchestration Change Building architectural guardrails that keep execution frameworks interchangeable Executive...
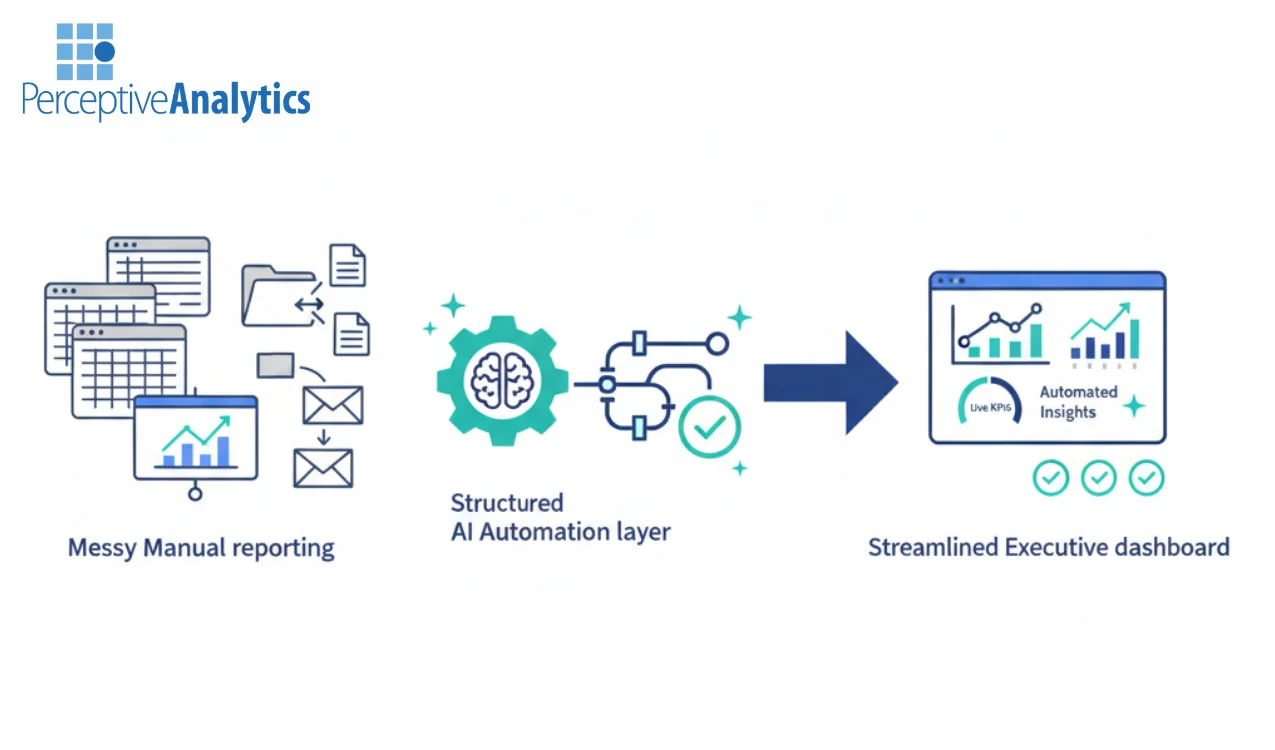
Enterprise BI modernization is no longer optional. Legacy reporting tools, spreadsheet-driven processes, and fragmented dashboards...
Manual reporting is still the hidden tax inside most enterprises. Analysts export data into spreadsheets,...
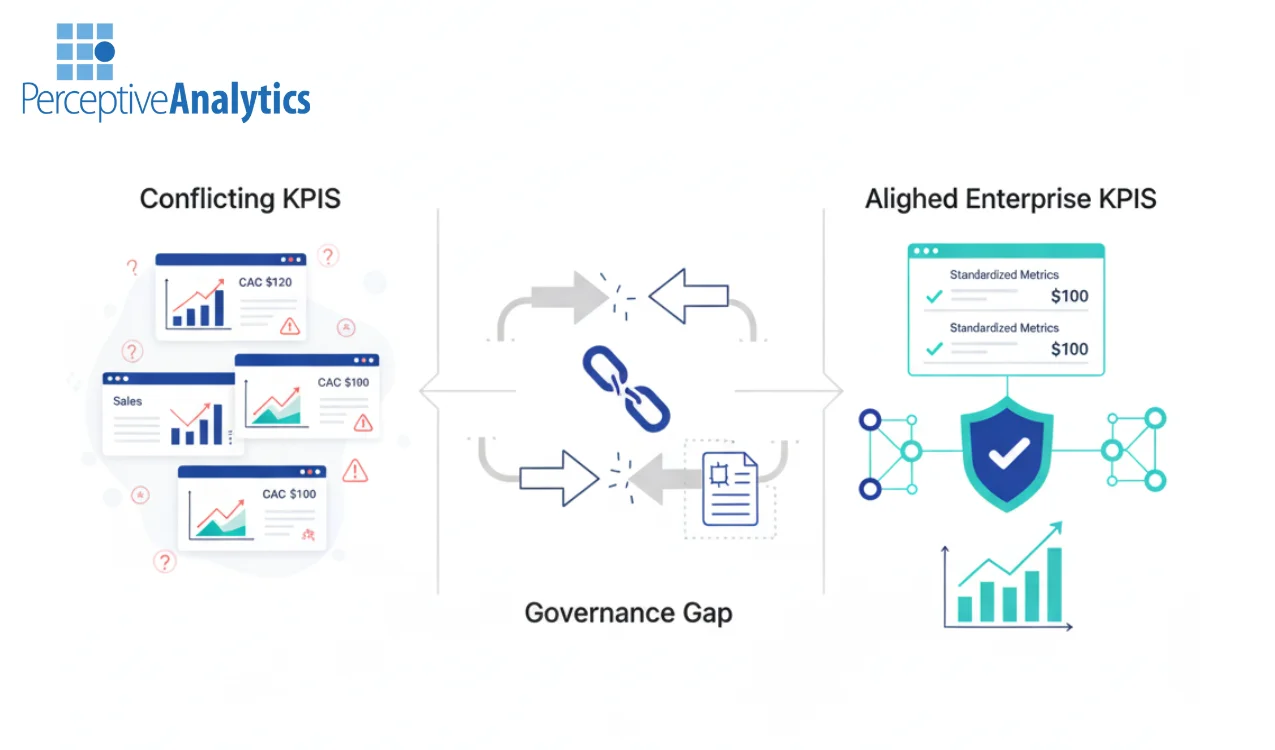
In one leadership deck, customer acquisition cost is declining. In another, it is rising. Both...
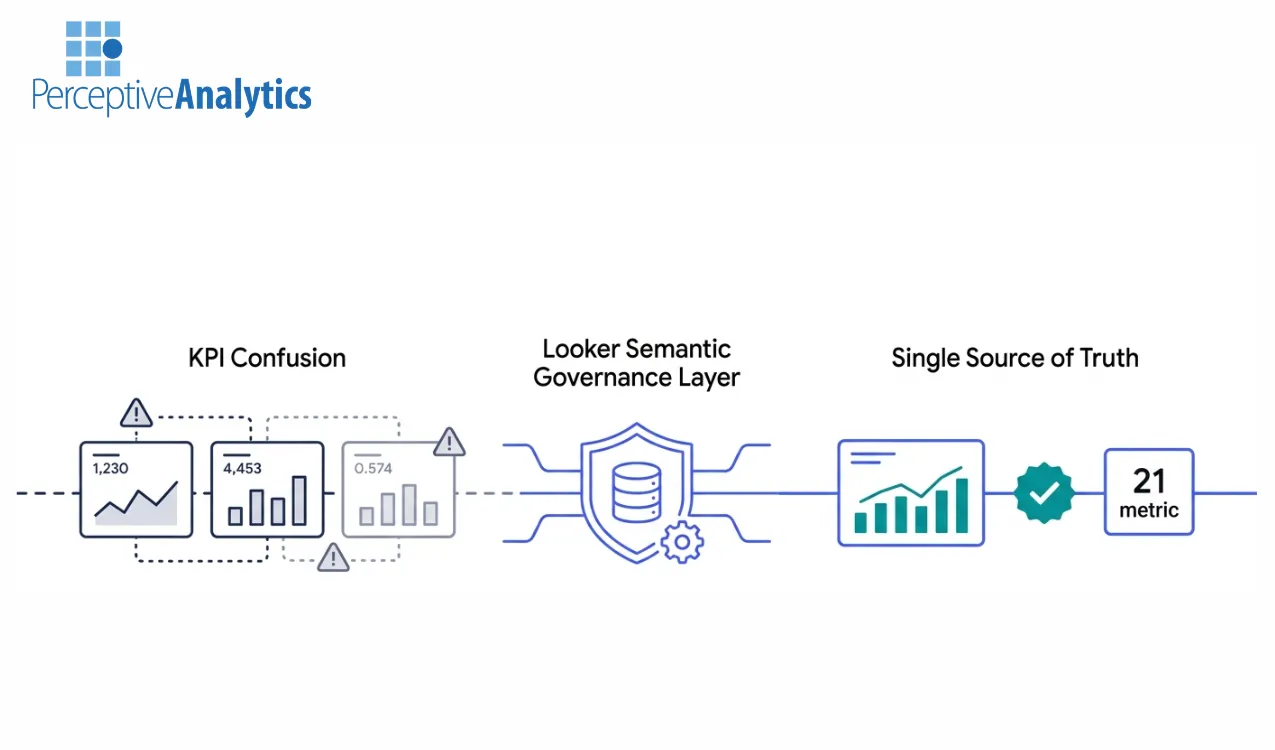
Modern enterprises standardizing on Looker often assume that once dashboards are built, governance will naturally...
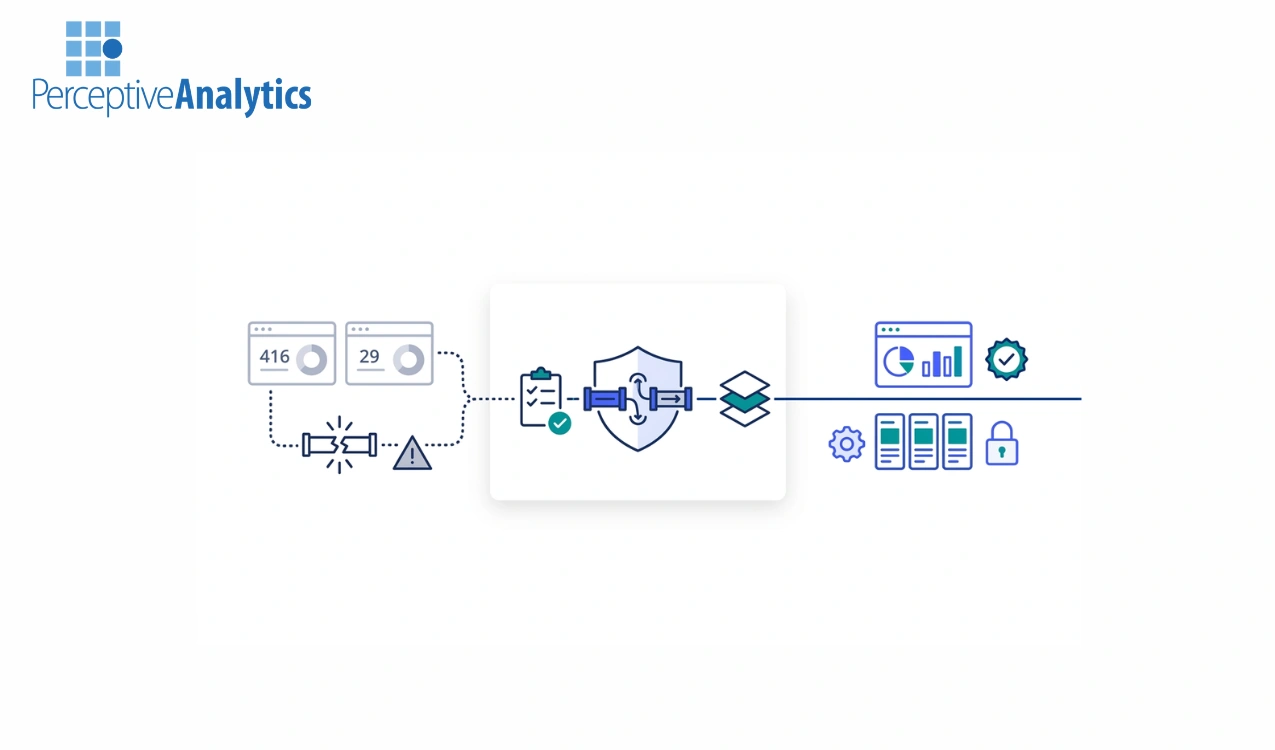
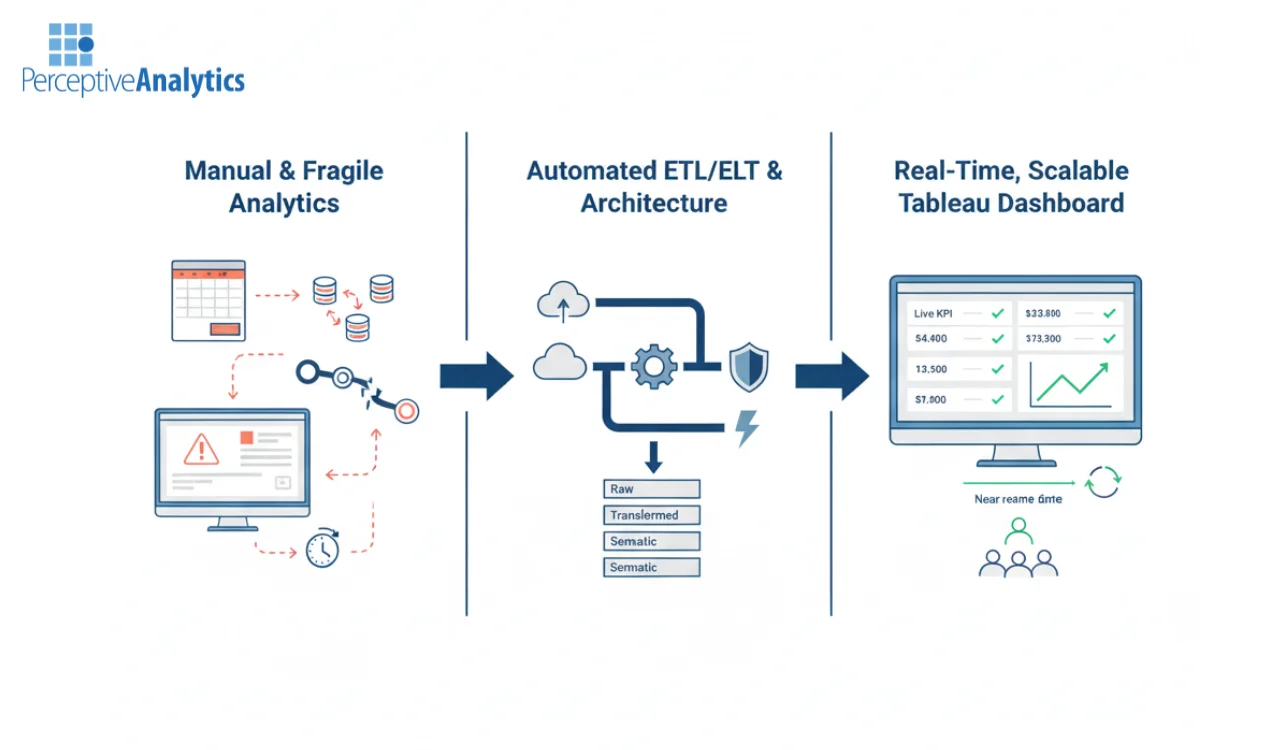
Enterprises rarely struggle with visualization tools. They struggle with unstable pipelines, delayed refresh cycles, brittle...
CFO dashboards are becoming the norm for financial reporting, management, and decision-making. Companies under Sarbanes-Oxley...
One of the quickest ways executive trust in analytics breaks is when the same KPI...
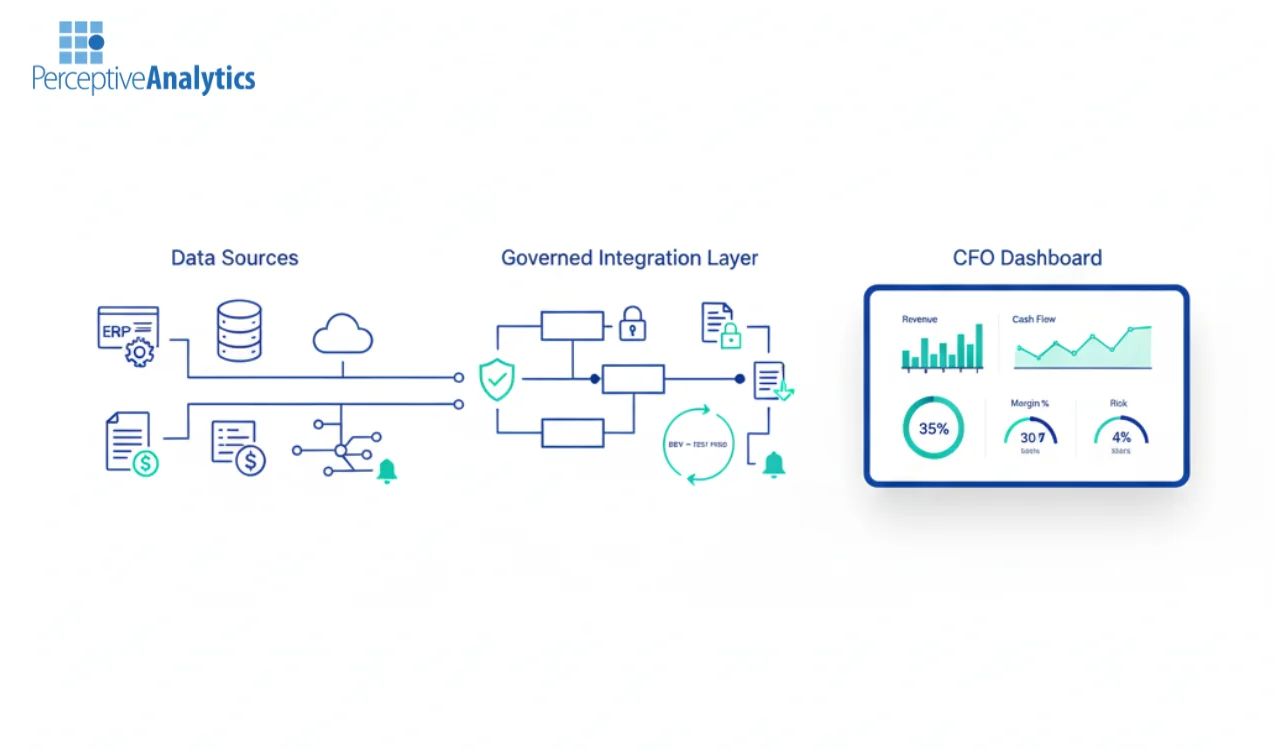
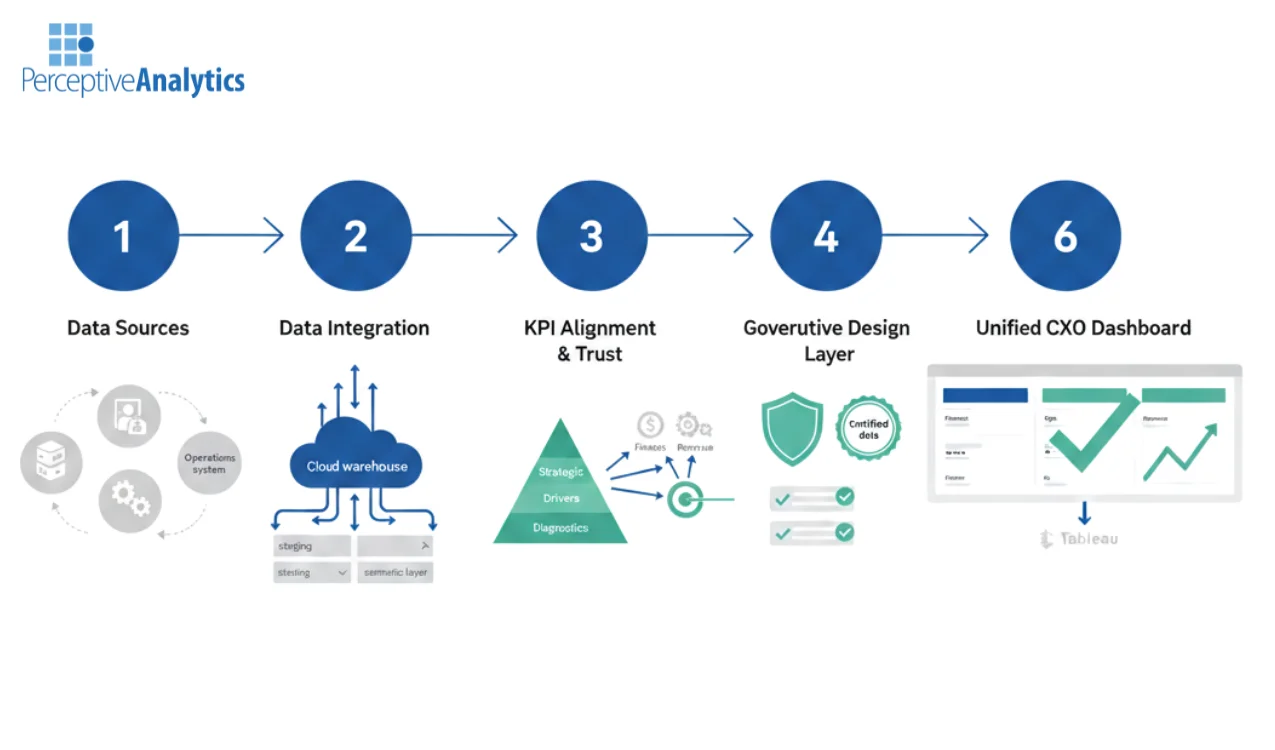
Unified CXO Dashboards in Tableau: Finance, Ops, Revenue on One Screen – Insights by Perceptive...
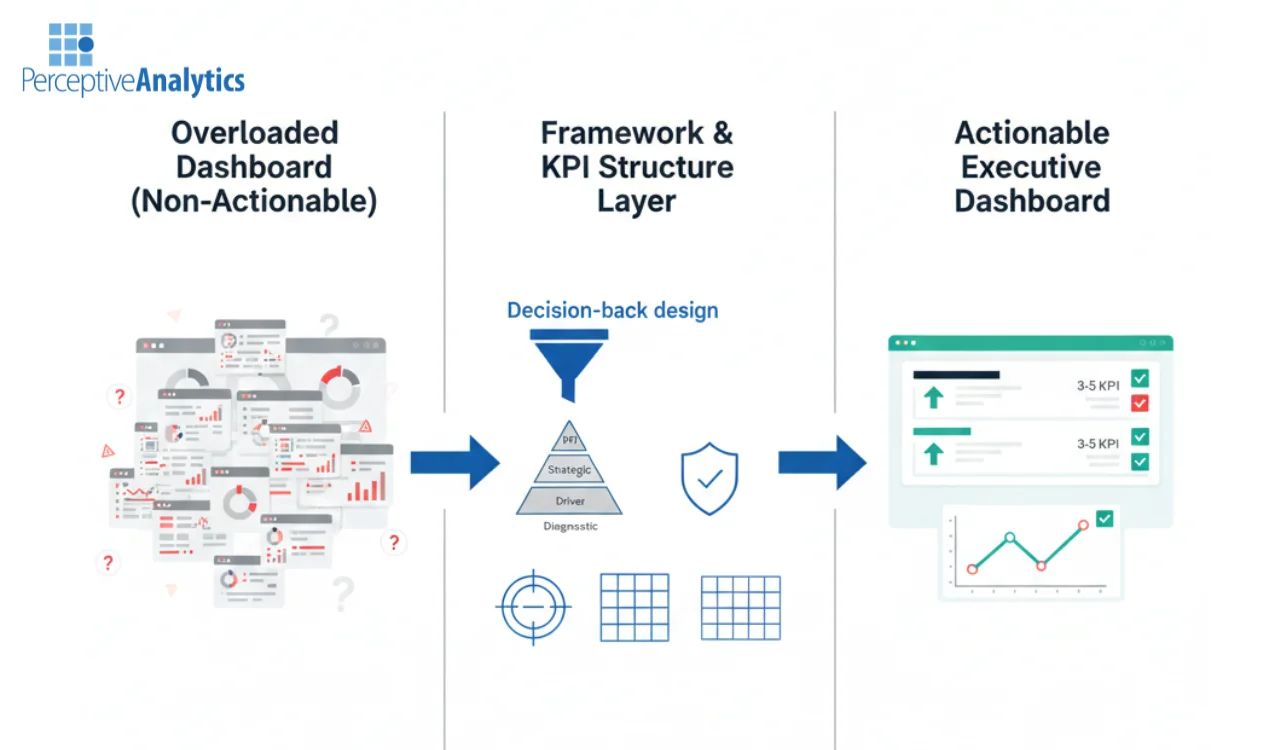
Executives do not require more charts. They require clarity, accountability, and action driven signals that...
How to Select a Reliable Tableau Partner for Data Governance and Data Trust – Insights...
Every AI initiative begins with a data integration challenge. Before you can train a predictive...
In the early stages of a company, the Business Intelligence (BI) team is often hailed...
For many mid-market companies, the Business Intelligence (BI) department feels less like a strategic partner...
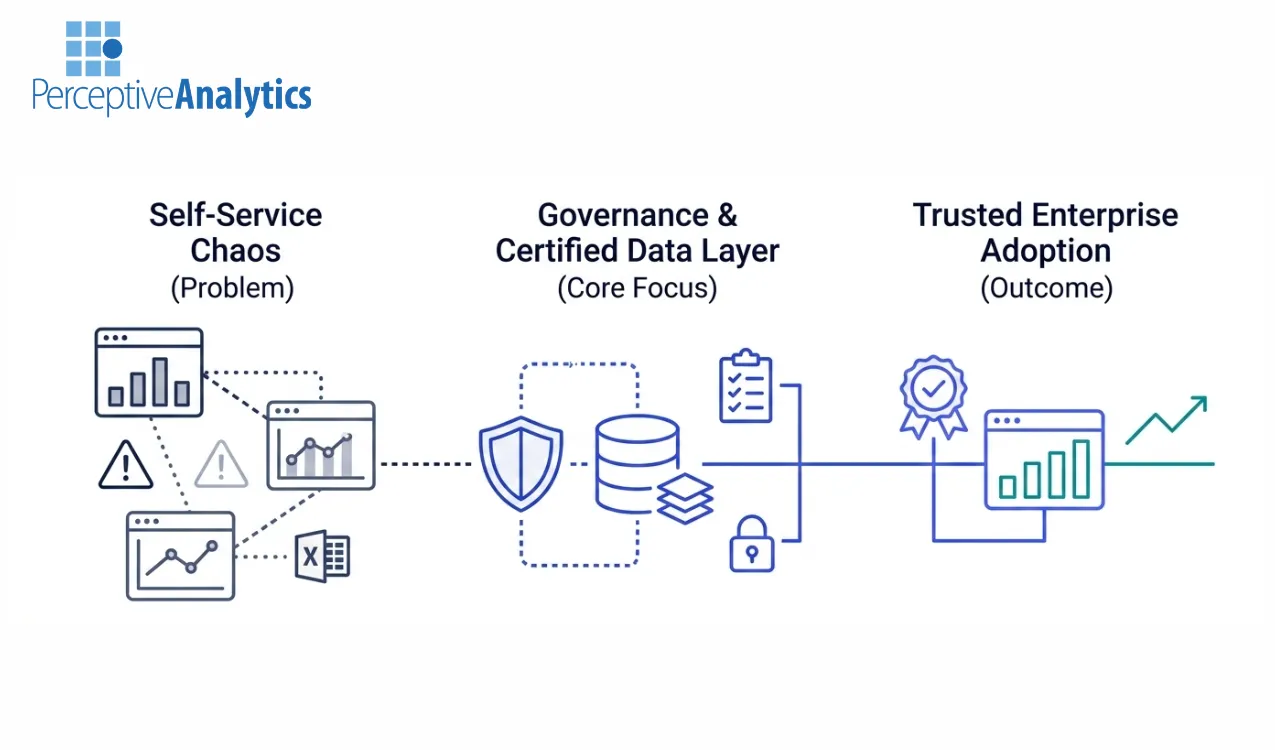
In the rush to democratize data, many enterprises inadvertently democratized confusion. “Self-service analytics” became a...
The modern analytics team is caught in a paradox. On one side, they have more...
Enterprises are drowning in dashboards but starving for insights. The traditional Business Intelligence (BI) workflow—characterized...
For many enterprises, data quality is a game of “whack-a-mole.” You fix a KPI in...
How leaders scale analytics economically without introducing friction, latency, or governance debt Executive Summary Controlling...
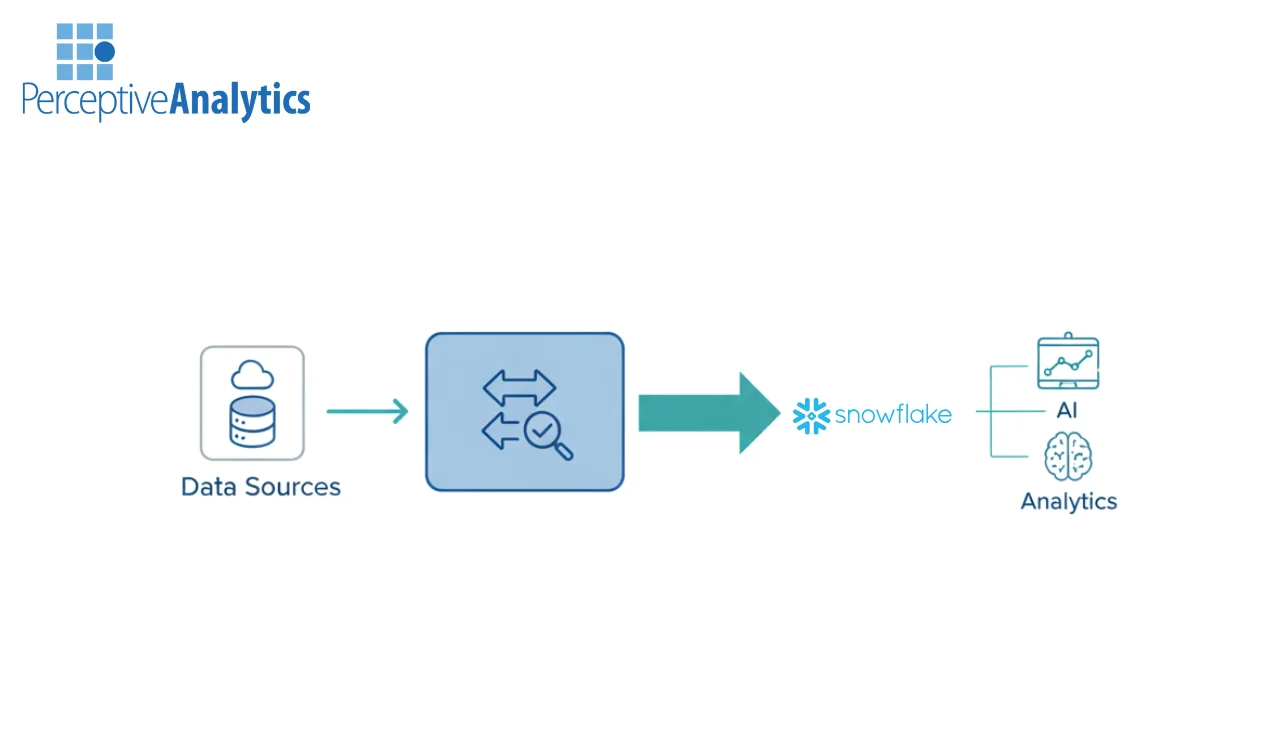
Snowflake has become the backbone for modern analytics and AI workloads—but many organizations discover that...
Executive dashboards fail for a predictable reason: they are treated as a visualization problem instead...
Executives rarely complain about too many dashboards. They complain that the dashboards don’t agree. Marketing...
Data quality problems are rarely new. What frustrates analytics leaders is how familiar they feel....
Cloud data warehouses like Snowflake and BigQuery, paired with leading BI tools such as Power...
We are currently witnessing an inflection point in enterprise analytics. For the last decade, the...
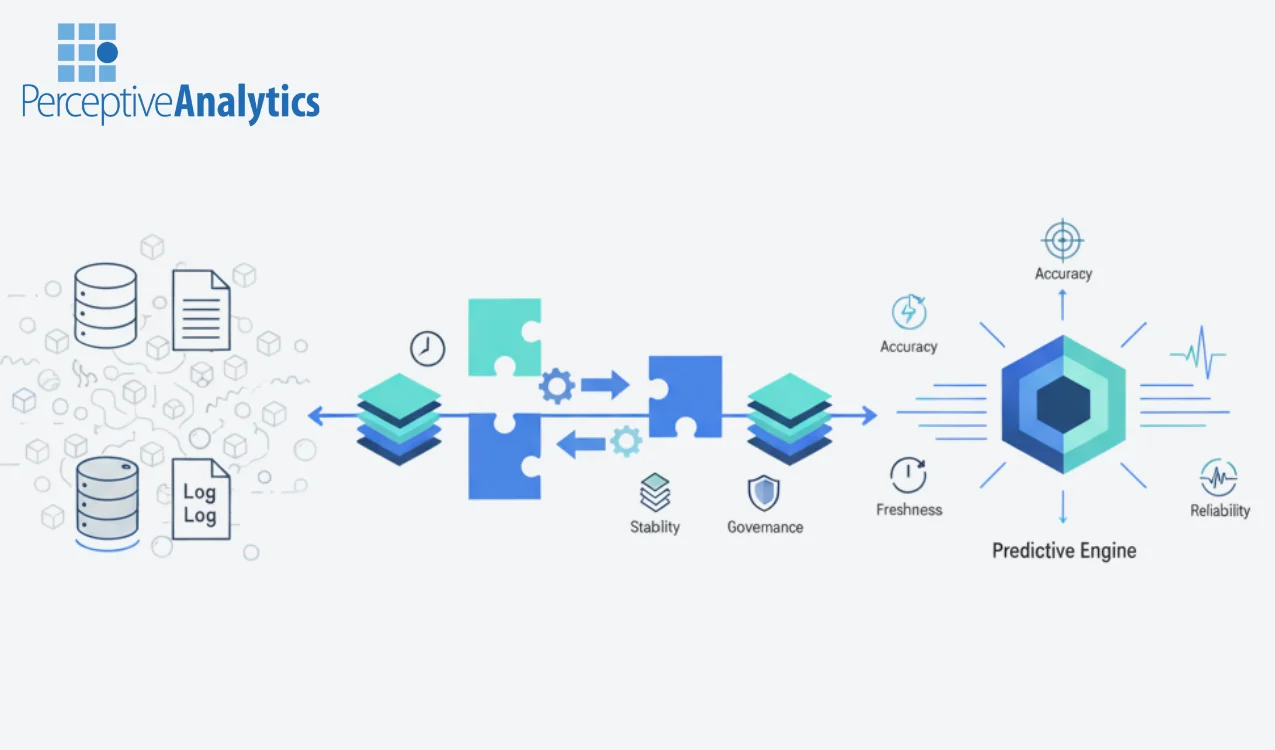
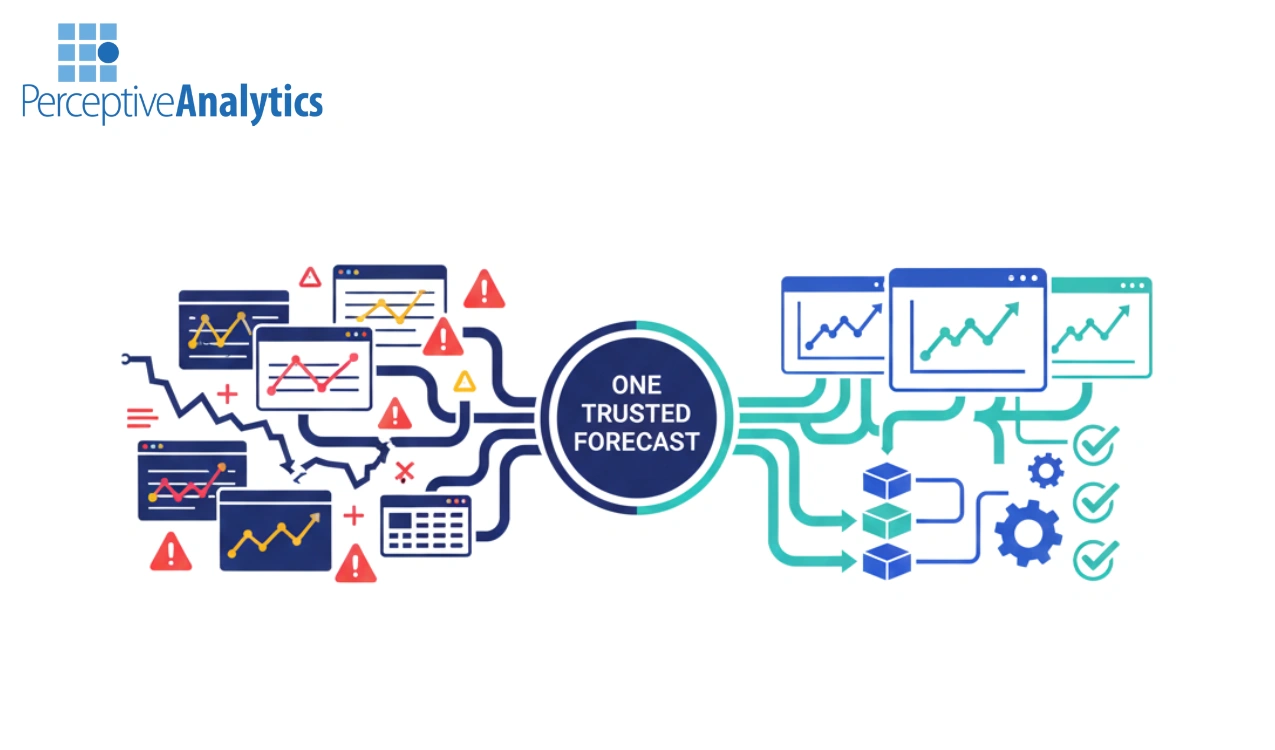
Most forecasting errors don’t come from bad algorithms; they come from bad data. When a...
For most growing enterprises, the “single source of truth” is a myth. The ERP holds...
For analytics leaders, the challenge isn’t finding a firm that can “handle data.” It’s finding...
For the C-suite, a dashboard is not just a reporting tool; it is a cockpit....
For many enterprises, the implementation of Looker promises a new era of “data trust.” Yet,...
The promise of Power BI is “self-service analytics for everyone.” But for many enterprises, that...
We are past the “wow” phase of Artificial Intelligence. Today, enterprises are stuck in the...
For many enterprises, the “cloud migration” victory party was premature. The infrastructure has moved, yes—the...
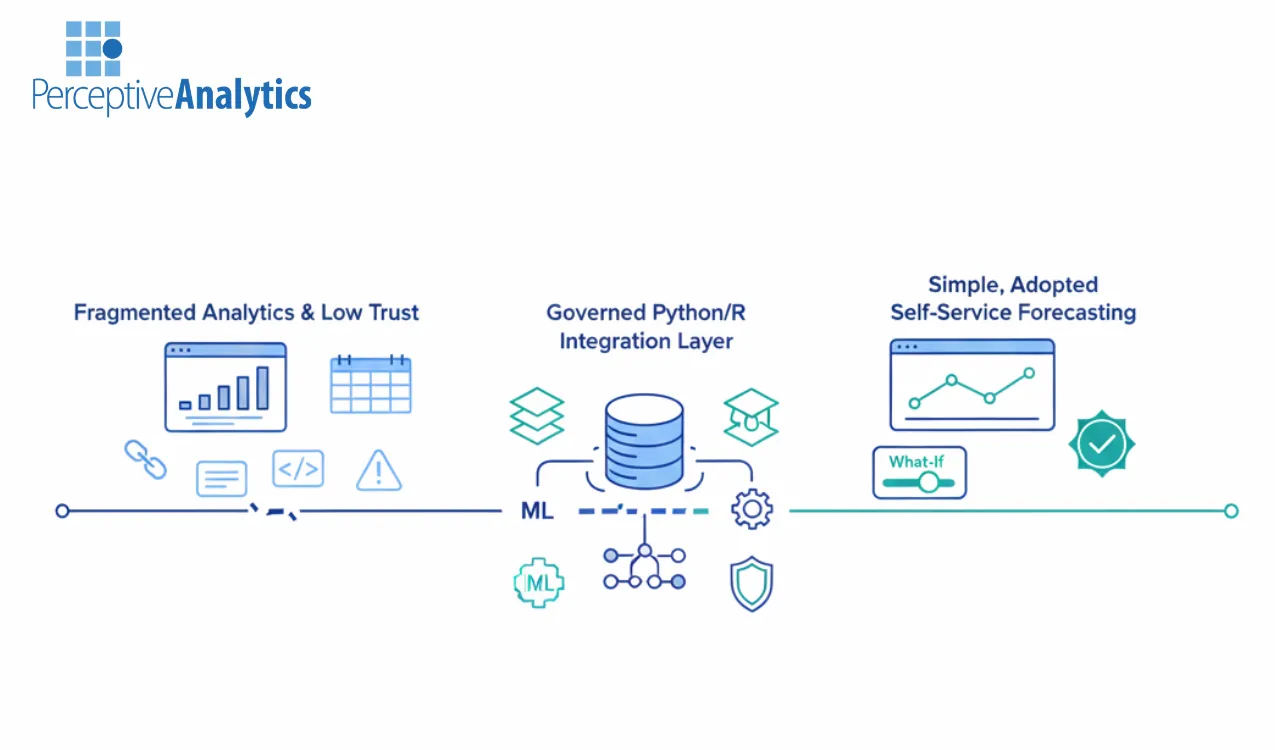
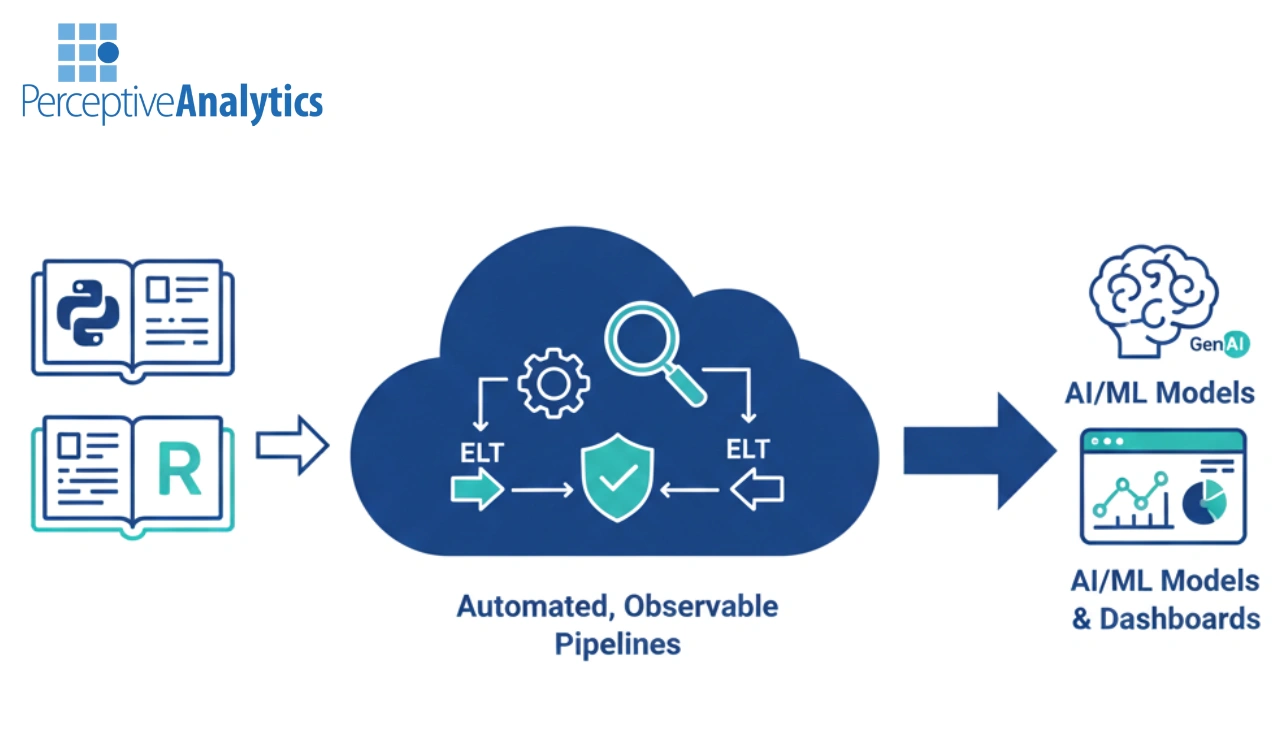
Python and R have become the default languages for advanced analytics, data science, and AI...
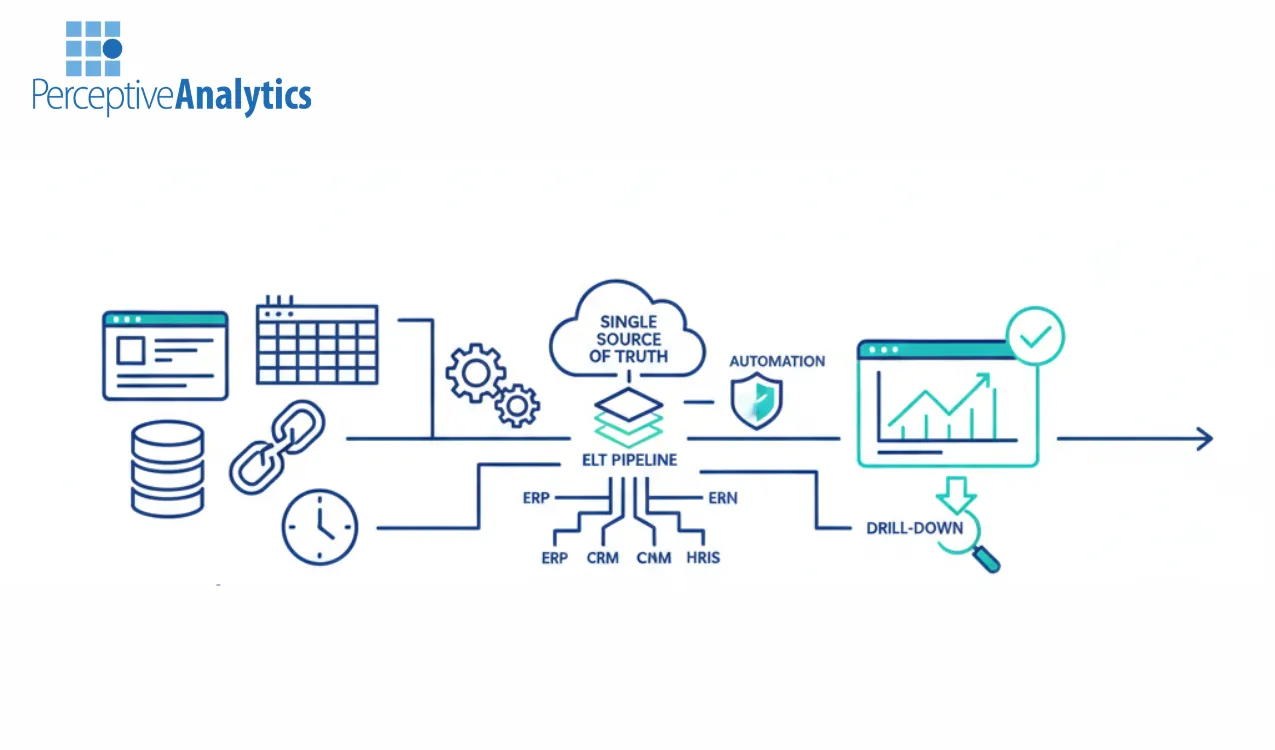
Modern enterprises are rapidly moving away from legacy ETL pipelines toward ELT-first architectures on Snowflake...
Forecast accuracy rarely fails because of algorithms alone. In most organizations, forecasting errors are driven...
Analytics Pipelines Break Long Before Dashboards or Models Do Manual data preparation, brittle integrations, and...
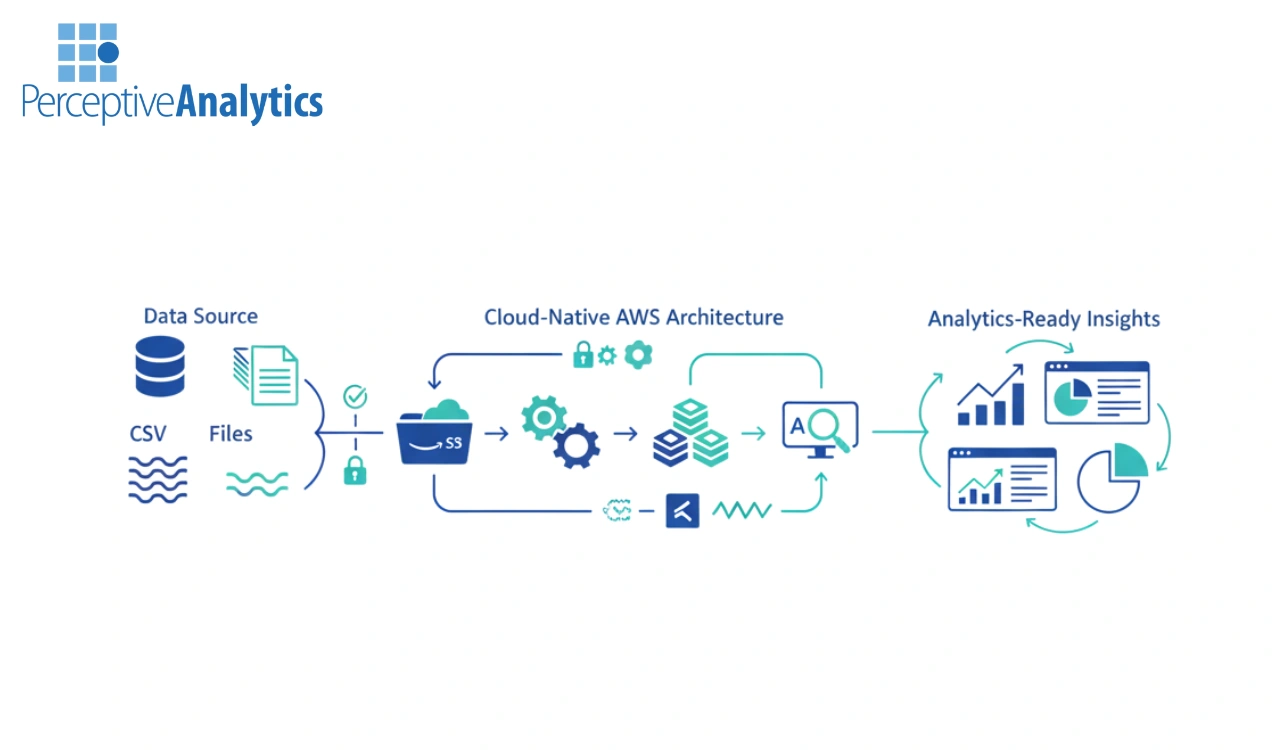
Intro: Why this matters Enterprises today need scalable, secure AWS data engineering to power modern...
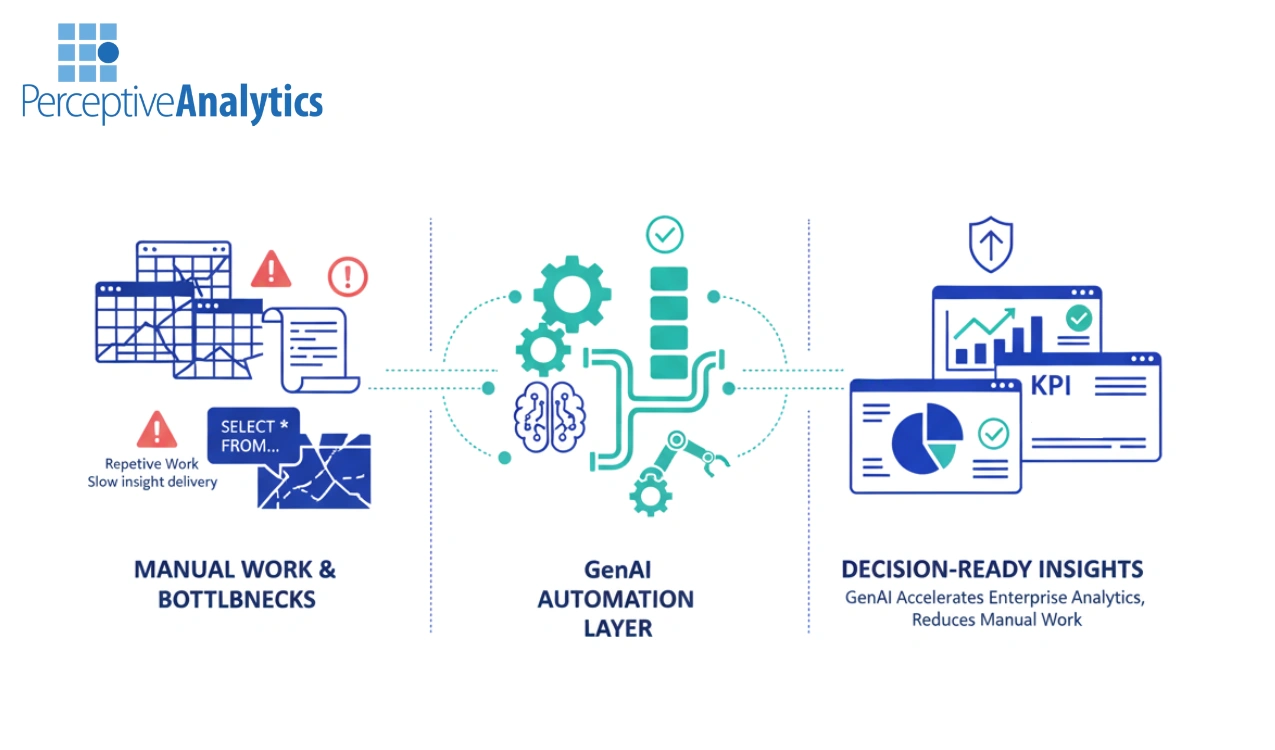
Introduction Analytics leaders are under pressure. Reporting demand keeps rising, but team capacity does not....
Forecasting is still one of the most frustrating responsibilities inside Finance and Revenue organizations. Despite...
Why Power BI Automation Is a Leadership Decision, Not a Tool Upgrade Manual Excel and...
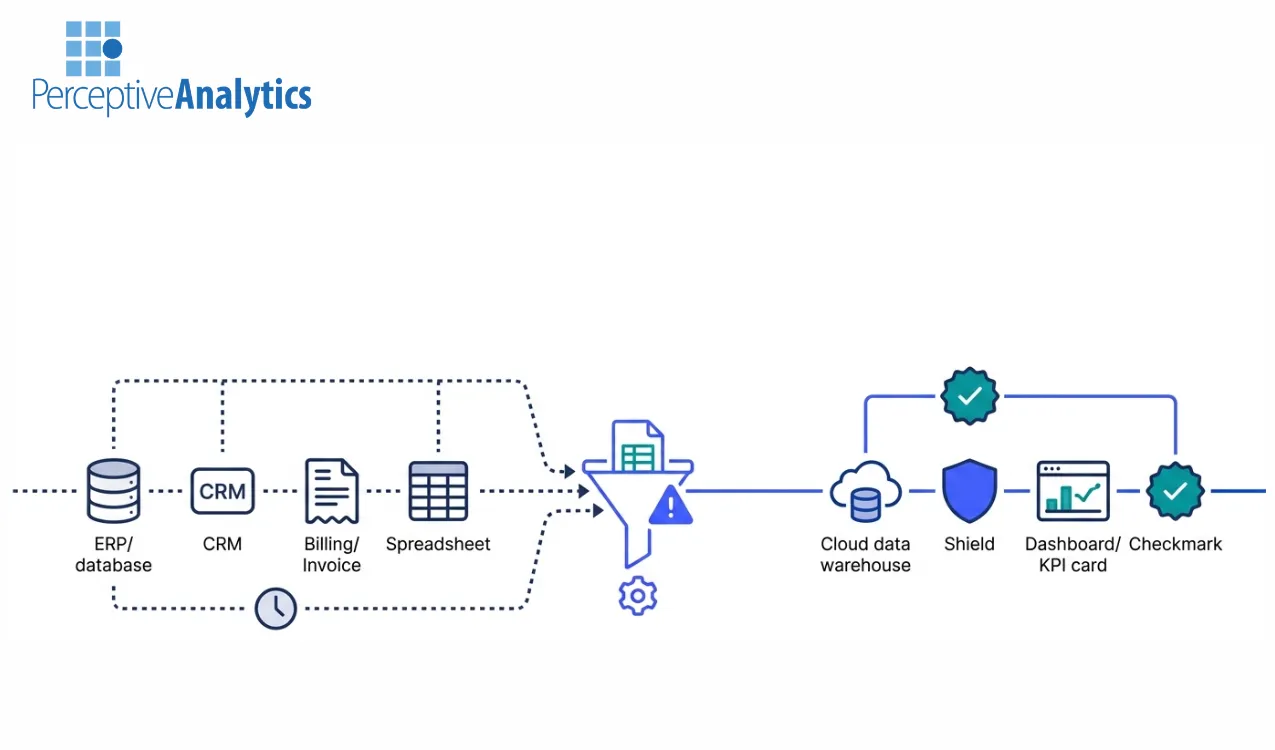
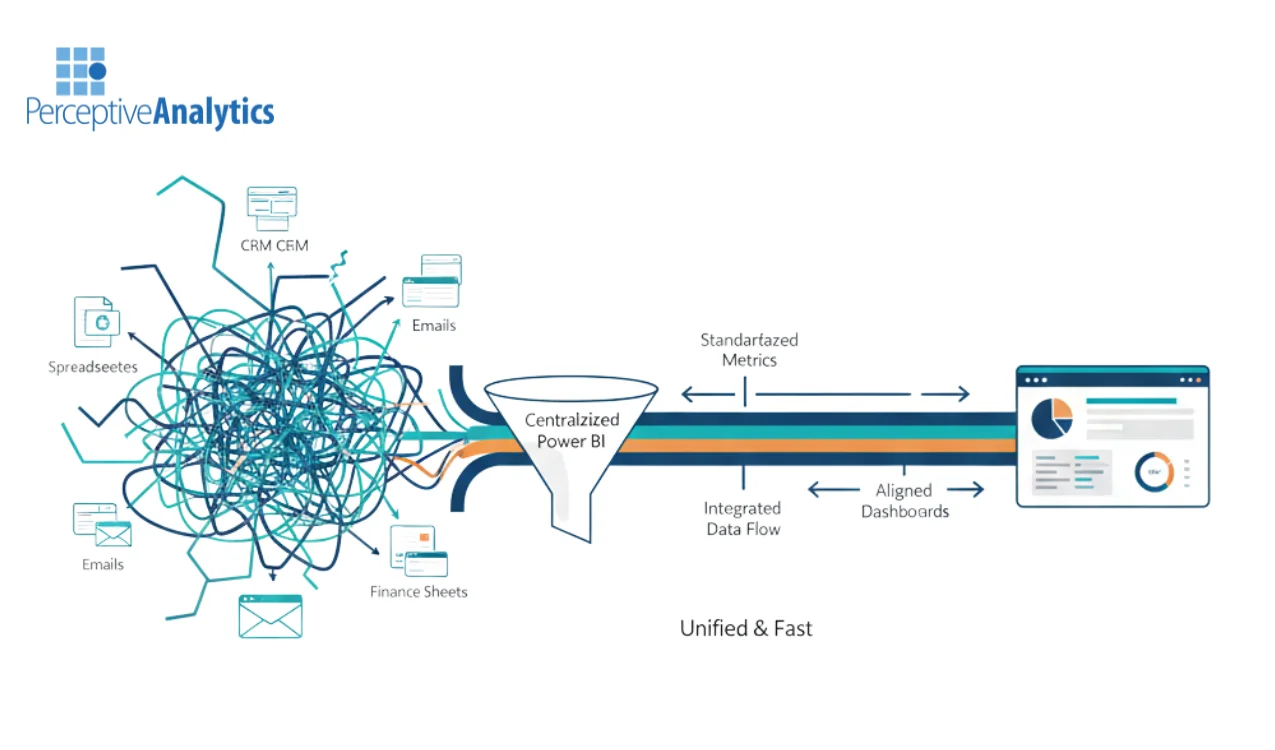
How Perceptive Analytics Handles Data Engineering for Unified Finance, Ops, and Marketing Reporting Unified reporting...
Enterprise Tableau environments underdeliver on ROI when manual reporting, fragmented tools, and poor performance consume...
Most enterprise analytics teams are still running on fragile SQL and Python pipelines that were...
FP&A cycles remain slow not because Power BI is weak, but because most organizations use...
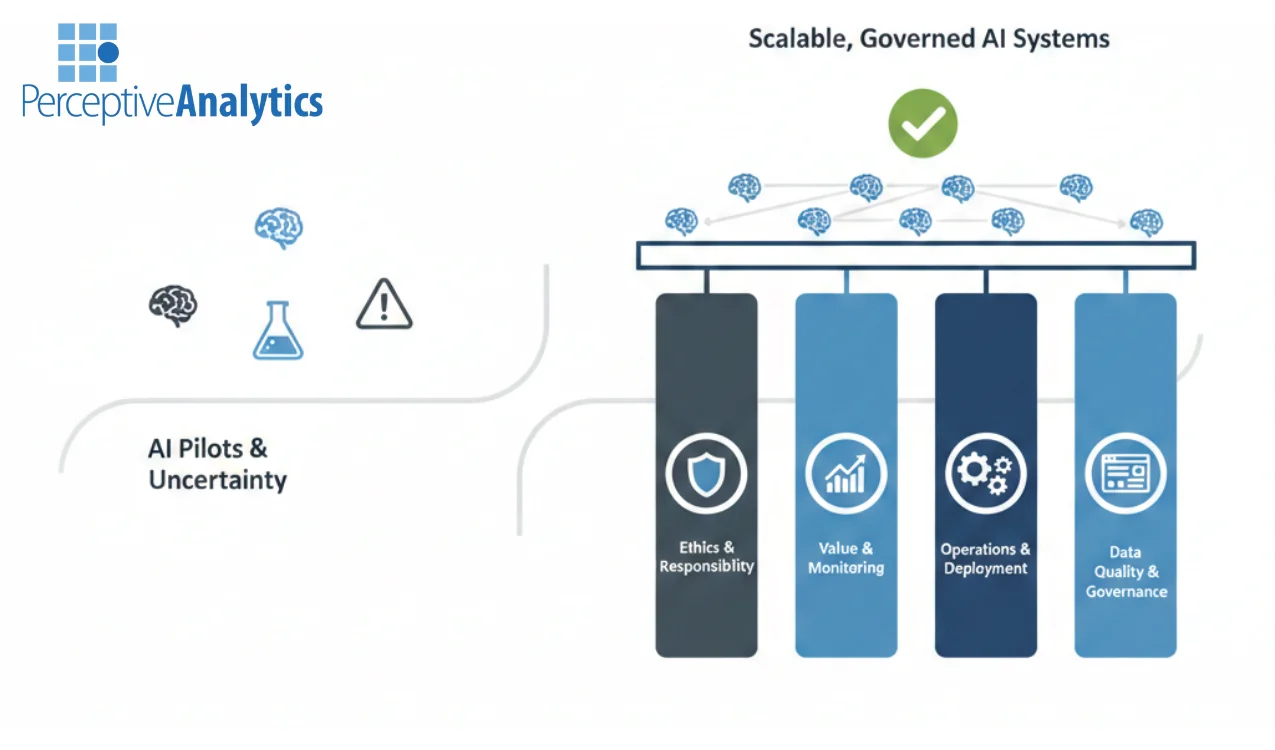
AI governance and data quality have become non-negotiable for enterprises deploying analytics, BI, and GenAI...
Why Enterprise Forecasting Fails (And How AI Automation Can Fix It) Enterprise forecasting fails because...
How to use this checklist and guide? This Power BI Checklist & Guide is designed...
Introduction According to Swiss Re, of the $7.186 trillion of global direct premiums written worldwide...
For CXOs, analytics works best when it keeps up with the speed of decision-making. The...
Event-Driven vs Scheduled Data Pipelines – Which balance cost and responsiveness better? As your company...
As your company scales, every data decision compounds. CXOs often face a difficult choice: Snowflake...
How to use this checklist and guide? This Tableau Checklist & Guide is designed to...
Download this guide as a PDF Please enable JavaScript in your browser to complete this...
How architectural choices drive shape cost, control, and scalability in analytics. Executive Summary Choosing the...
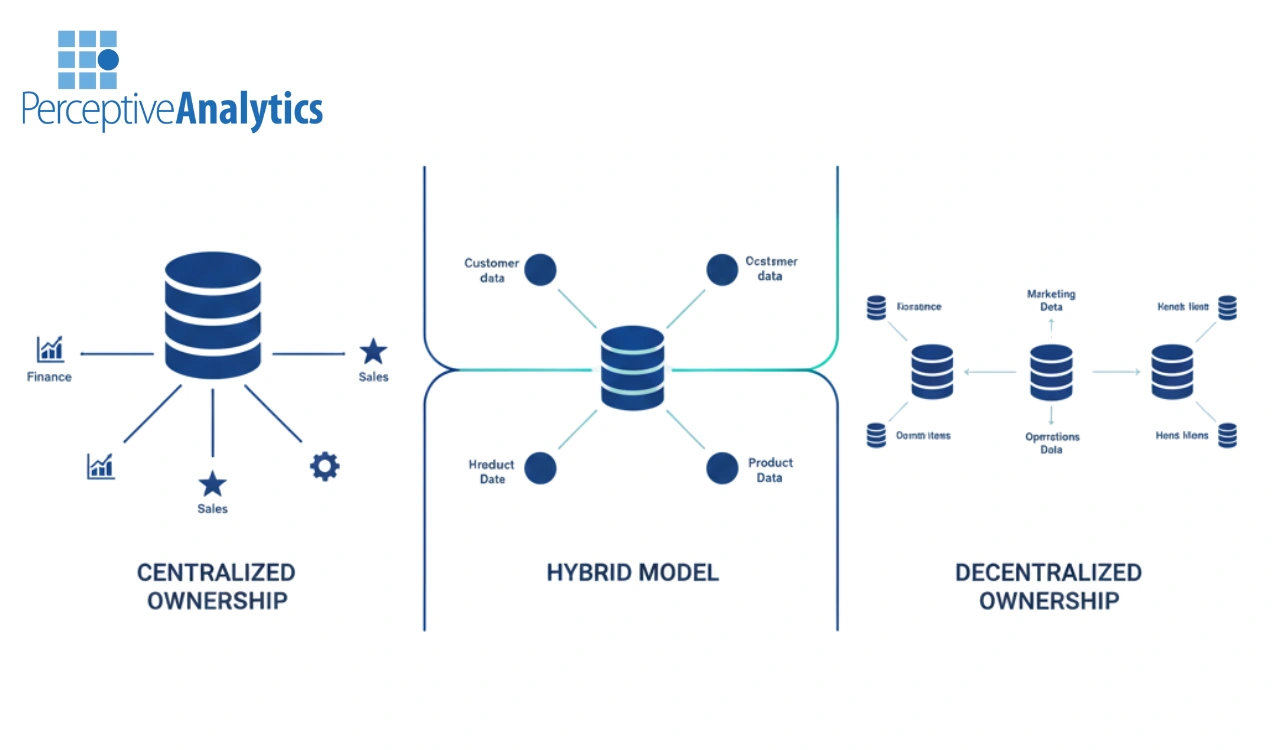
This article examines when centralized data ownership stops scaling, when decentralization becomes necessary, and why...
Why Most BI Programs Stall After Rollout—and How Leaders Fix It Introduction Most organizations don’t...
Manual ETL hasn’t disappeared.It has simply faded into the background. Behind many “modern” analytics stacks...
Modernizing BI for Unified, Faster Insights With Power BI Modern BI tools are everywhere.Yet many...
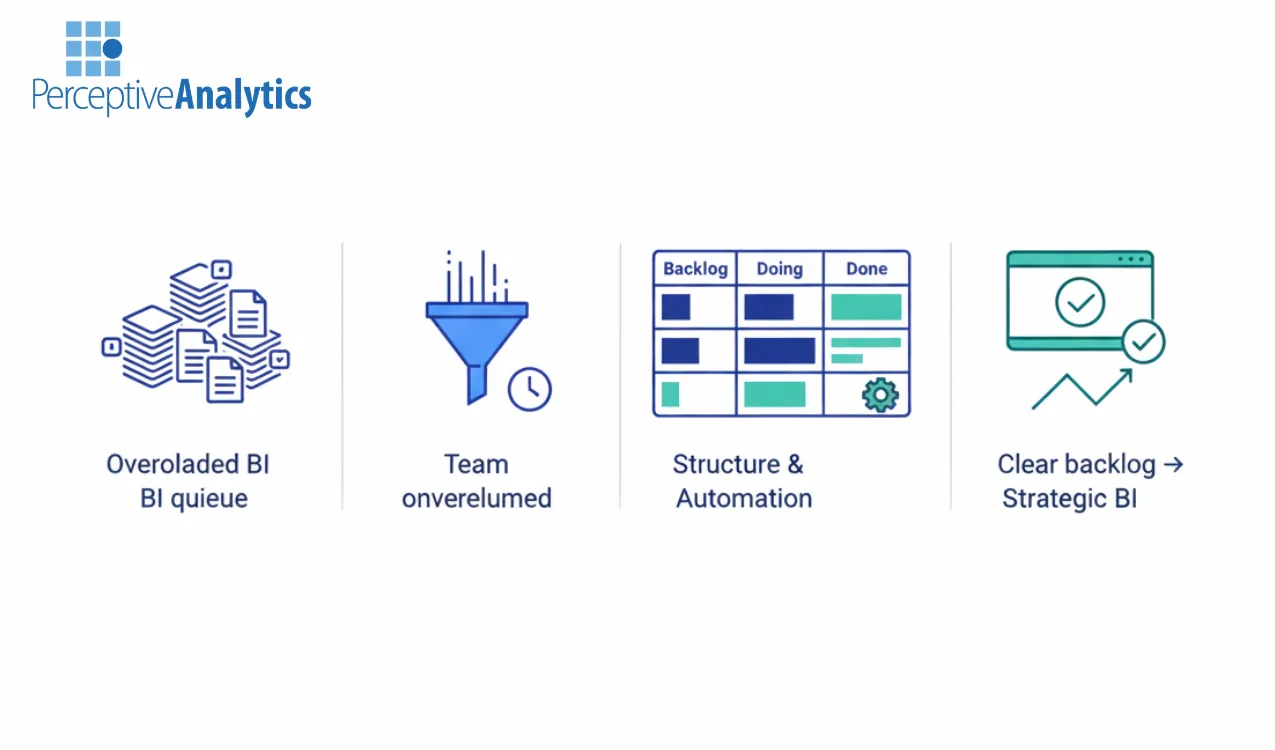
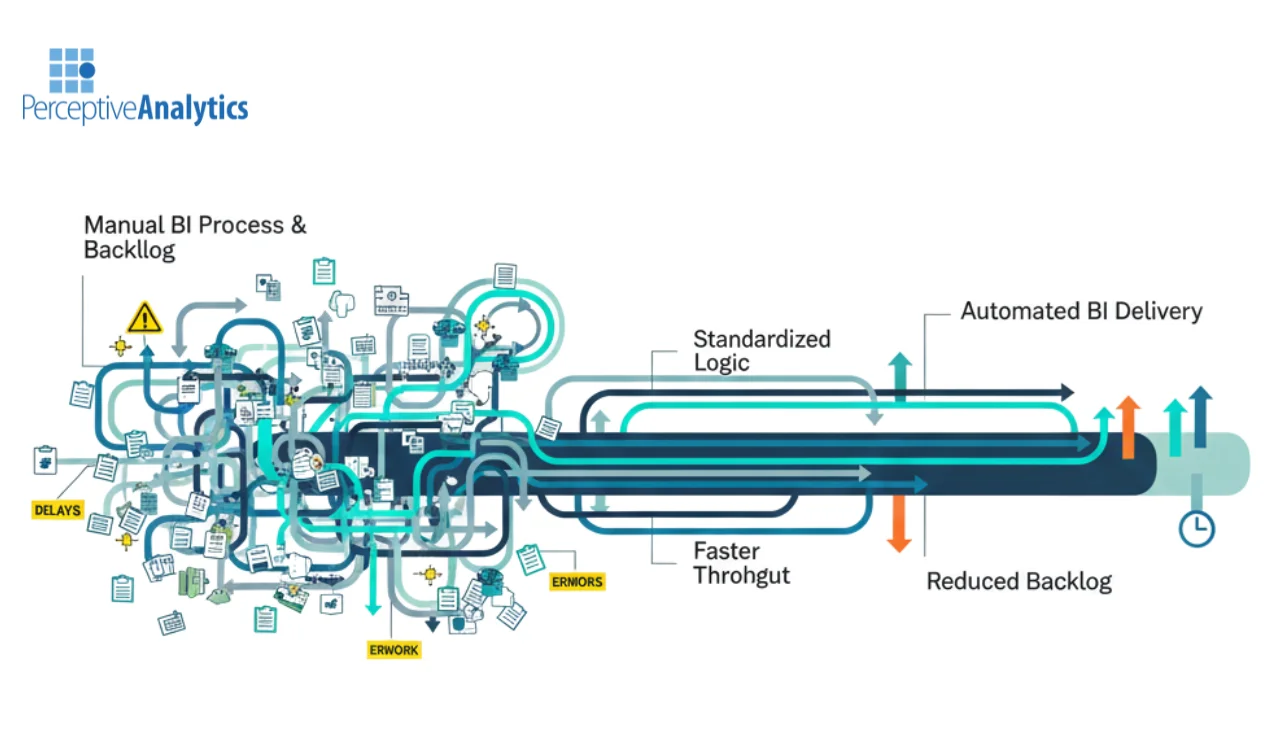
The BI backlog rarely starts as a problem.Until it suddenly feels impossible to control. Most...
Finance has more data than ever.Yet reporting inside most finance teams is still stubbornly manual....
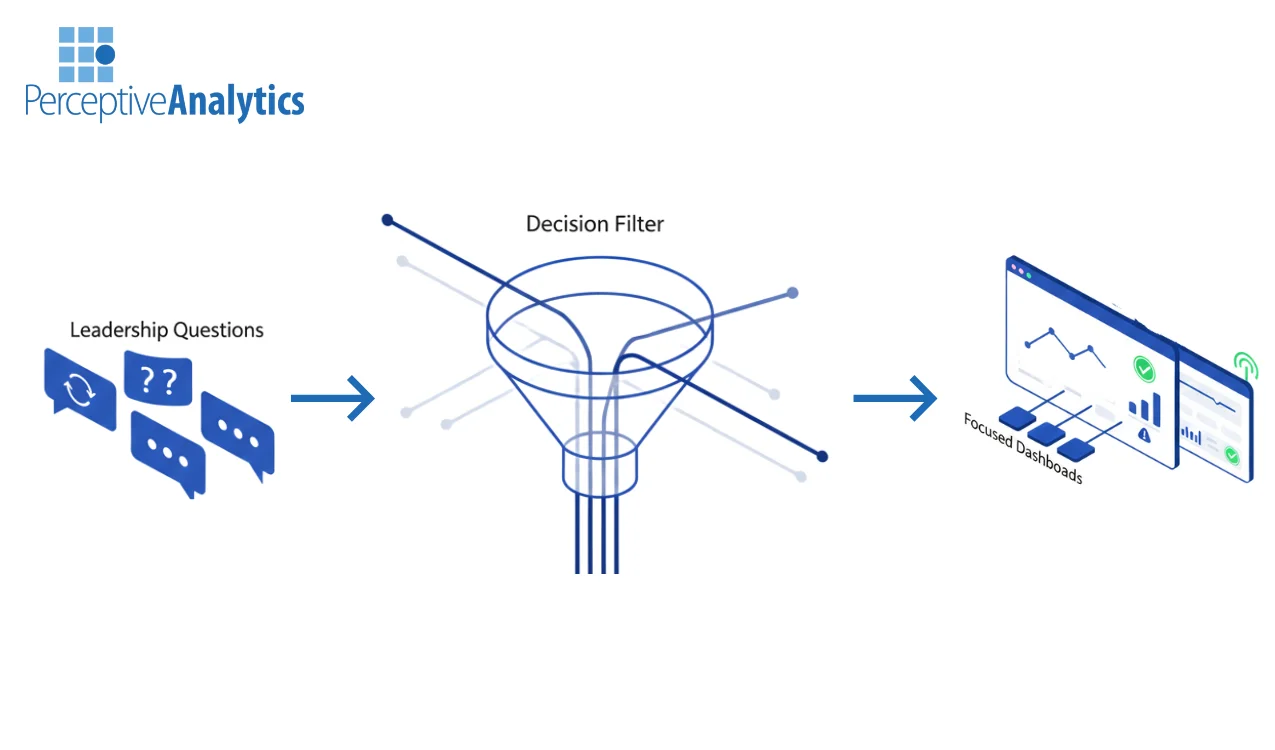
Select dashboards based on high-impact leadership questions to accelerate measurable decision outcomes. Executive Summary Most...
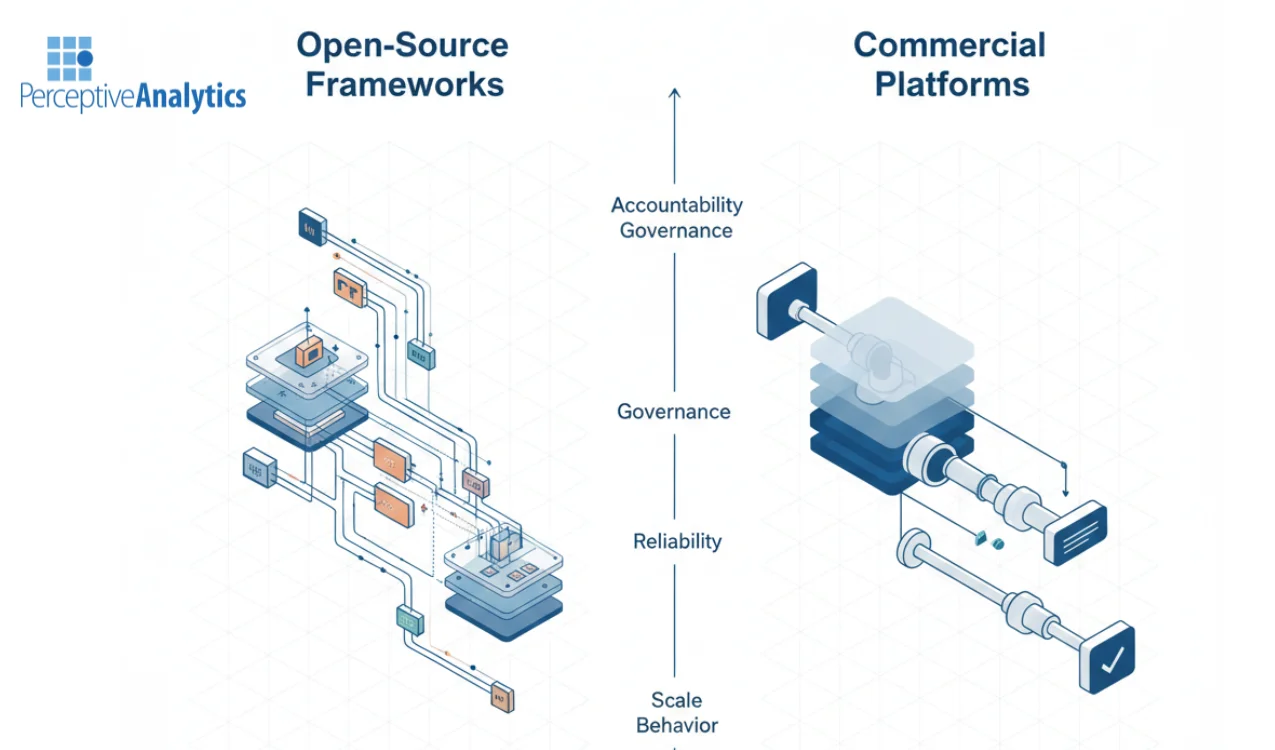
A leadership perspective on how impact and risk differ across open-source and commercial data transformation...
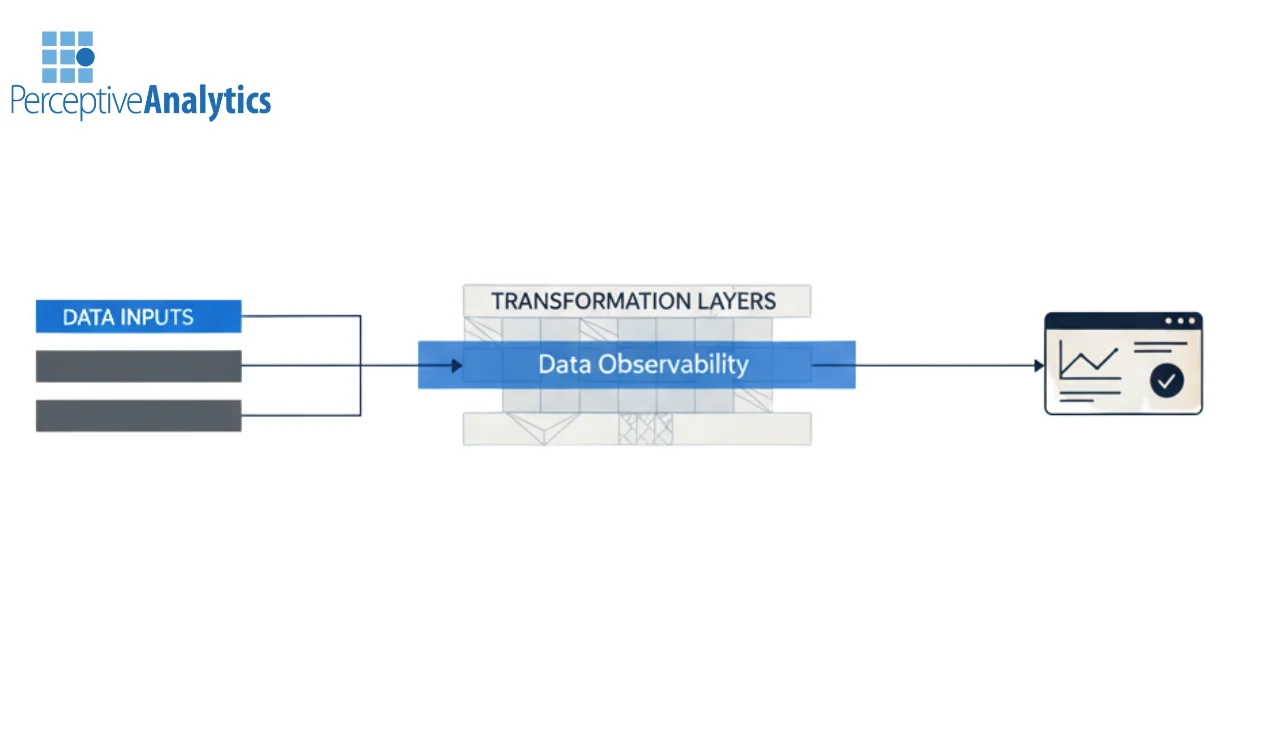
A comprehensive perspective on how data observability enables reliability, accountability, and trust in enterprise analytics...
Today’s C-suite leaders are not short on data. They are short on clarity. Every executive...
For decades, forecasting has been the backbone of business planning.Budgets, inventory decisions, hiring plans, and...
Most enterprises don’t suffer from a lack of data.They suffer from slow reporting. Reports arrive...
The silent failure behind “successful” transformations Most digital transformation programs look successful on paper. Cloud...
For years, enterprises have invested heavily in BI tools, dashboards, and data platforms yet reporting...
Most enterprises today are data-rich and insight-poor. Dashboards exist. Reports are delivered on time. Yet...
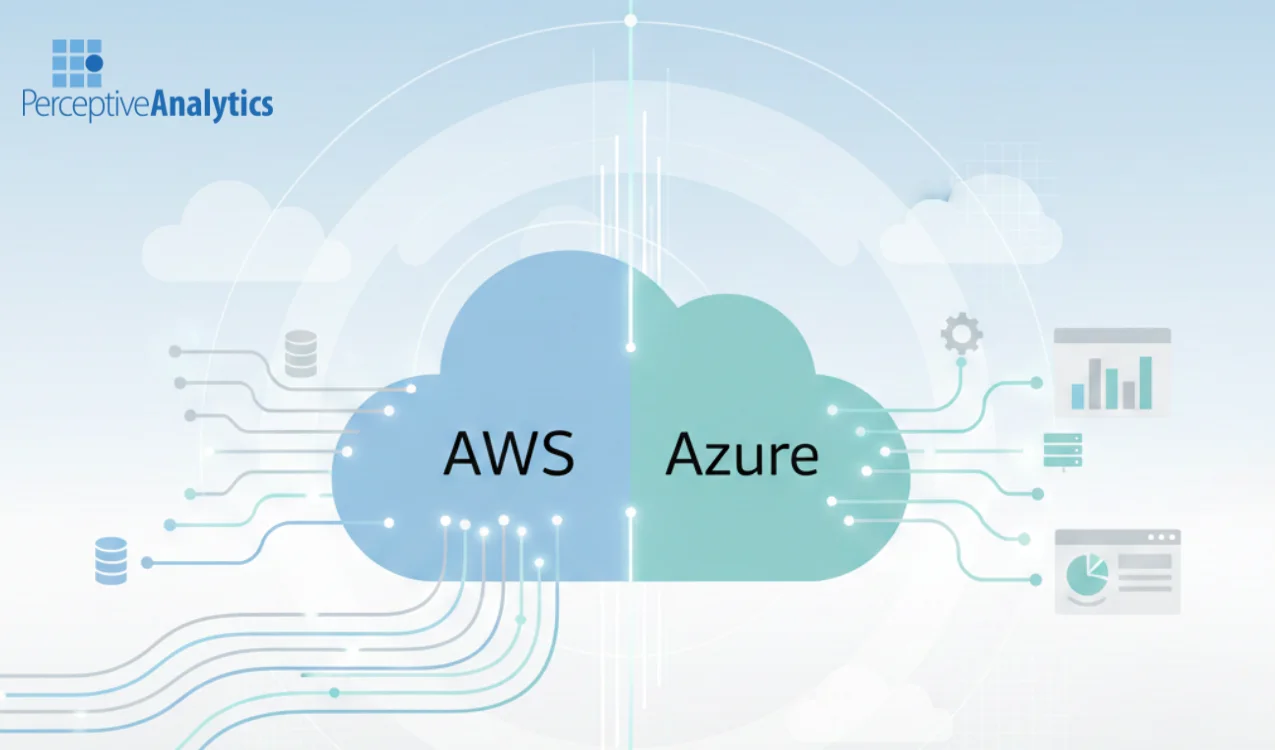
Best Practices for Scaling Analytics During Cloud Migration to AWS or Azure Cloud migration has...
Power BI governance is now essential for any organization using Power BI at scale. As...
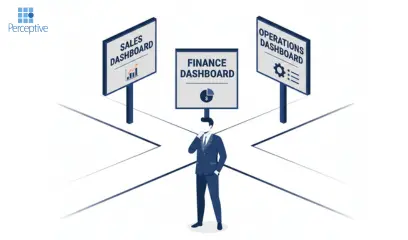
Compare Sales, Finance, and Operations to determine where early ROI and adoption will accelerate fastest....
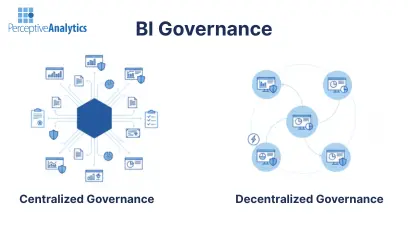
A decision framework for aligning BI governance with risk, maturity, and operational velocity. Executive Summary...
Introduction: Why the Right Analytics Strategy Matters Businesses generate massive volumes of data every second—from...
Introduction: The New ROI Mandate for Power BI Leaders demand more than dashboards—they expect measurable...
The shift from tableau migration to tableau to power bi is accelerating across enterprise analytics...
Customer engagement is evolving faster than ever. Traditional chatbots once relied on fixed scripts, but...
In today’s rapidly evolving business landscape, advanced analytics is no longer optional—it’s essential. Organizations generate...
Enterprises today are constantly reevaluating their analytics platforms to drive agility, uncover actionable insights, and...
Slow response kills deals. Delayed follow-ups drain pipelines. And overwhelmed sales teams miss easy wins....
If your customers are waiting, your competitors are winning.That’s the new reality of customer experience....
Patients don’t just need information — they need clarity, reassurance, and support at the exact...
When Slow Data Kills Fast Decisions In consulting, speed is currency.Clients hire you to think...
The Moment Consulting Stops Reporting and Starts Deciding For decades, consulting’s deliverables looked the same:...
When Time Is the New Margin In consulting, value isn’t measured by effort — it’s...
The Dashboard Era Is Ending For more than a decade, dashboards have been consulting’s favorite...
When Dashboards Stop Being Enough For years, pharma’s dream was data clarity.We built dashboards. We...
When Intelligence Meets Accountability The pharmaceutical industry stands at a crossroads.AI promises to accelerate discovery,...
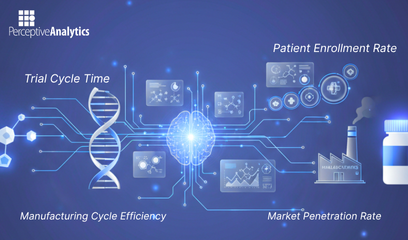
The Race Has Changed For decades, pharma’s race was about discovery — who could find...
The Bottleneck Pharma Doesn’t Talk About For years, drug development felt like building bridges—each stage...
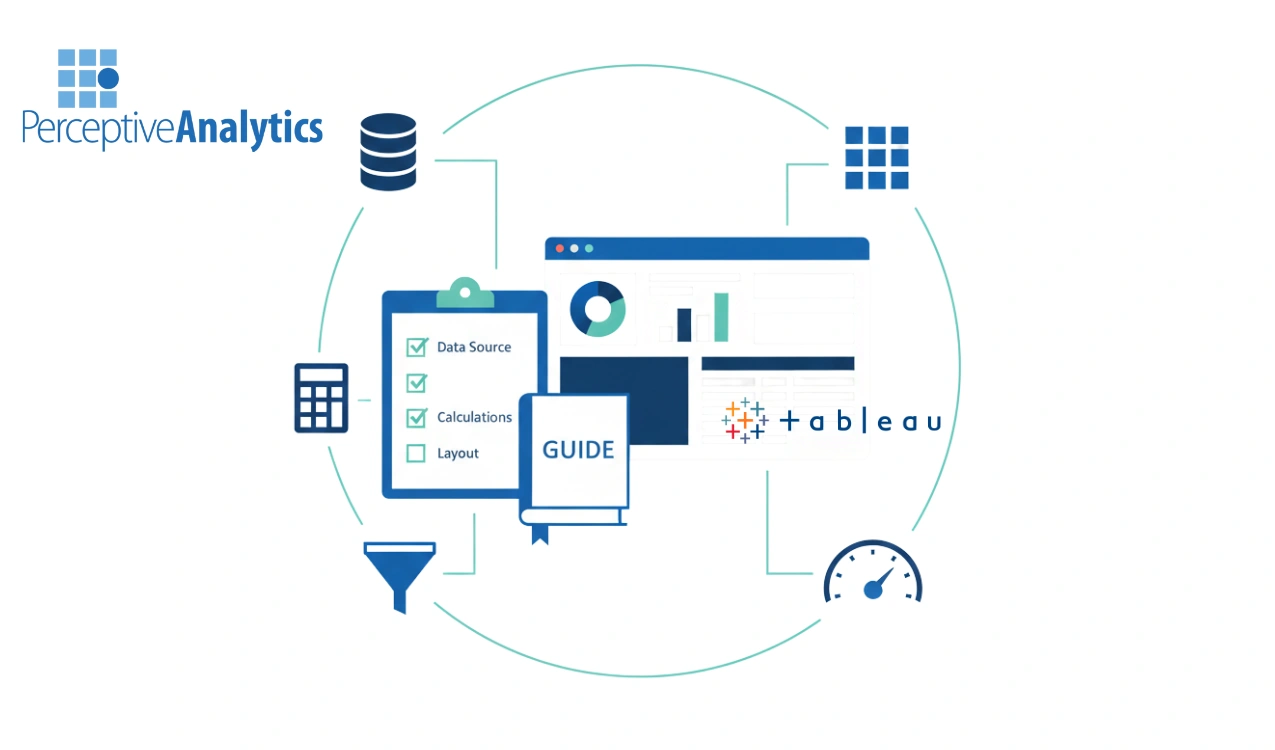
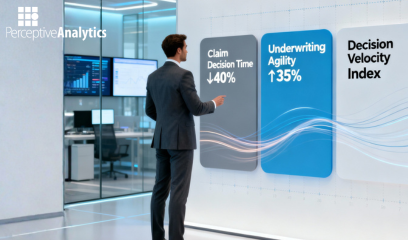
The insurance claim process is an operational cornerstone but is often hampered by legacy batch...
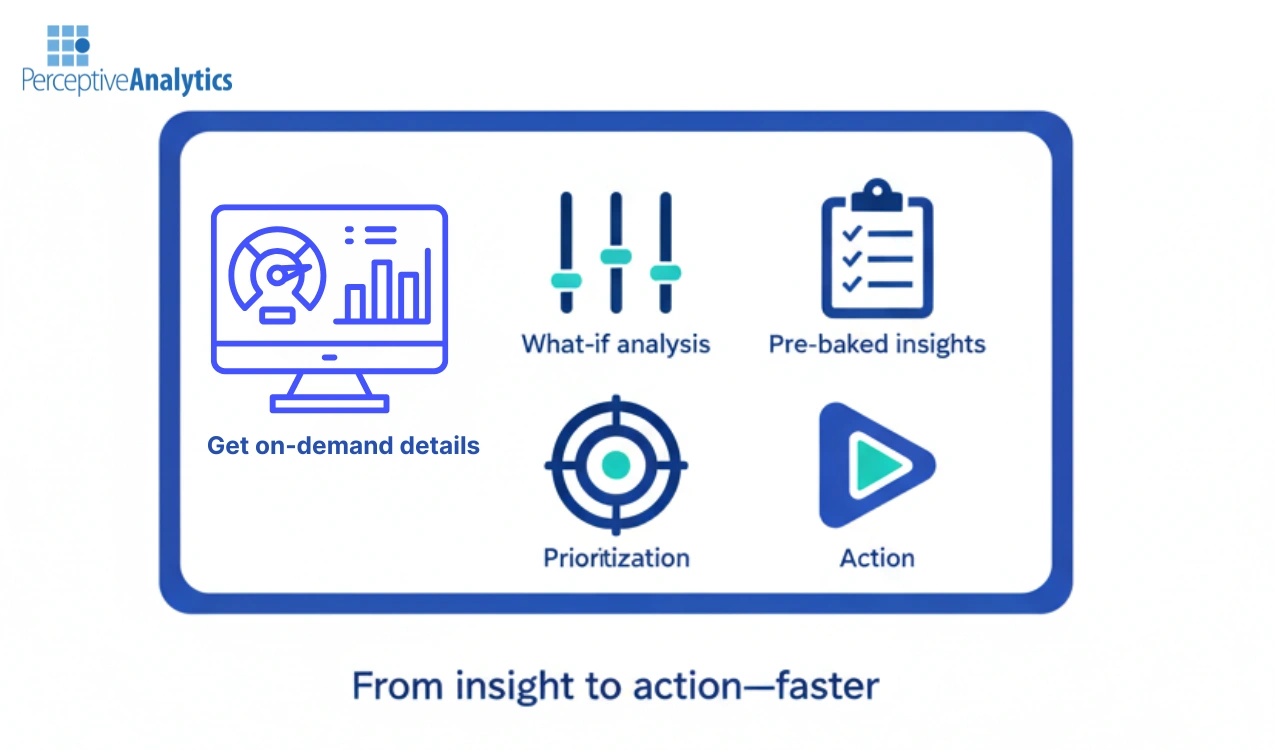
In the rapid race to modernize insurance analytics using artificial intelligence (AI), the industry narrative...
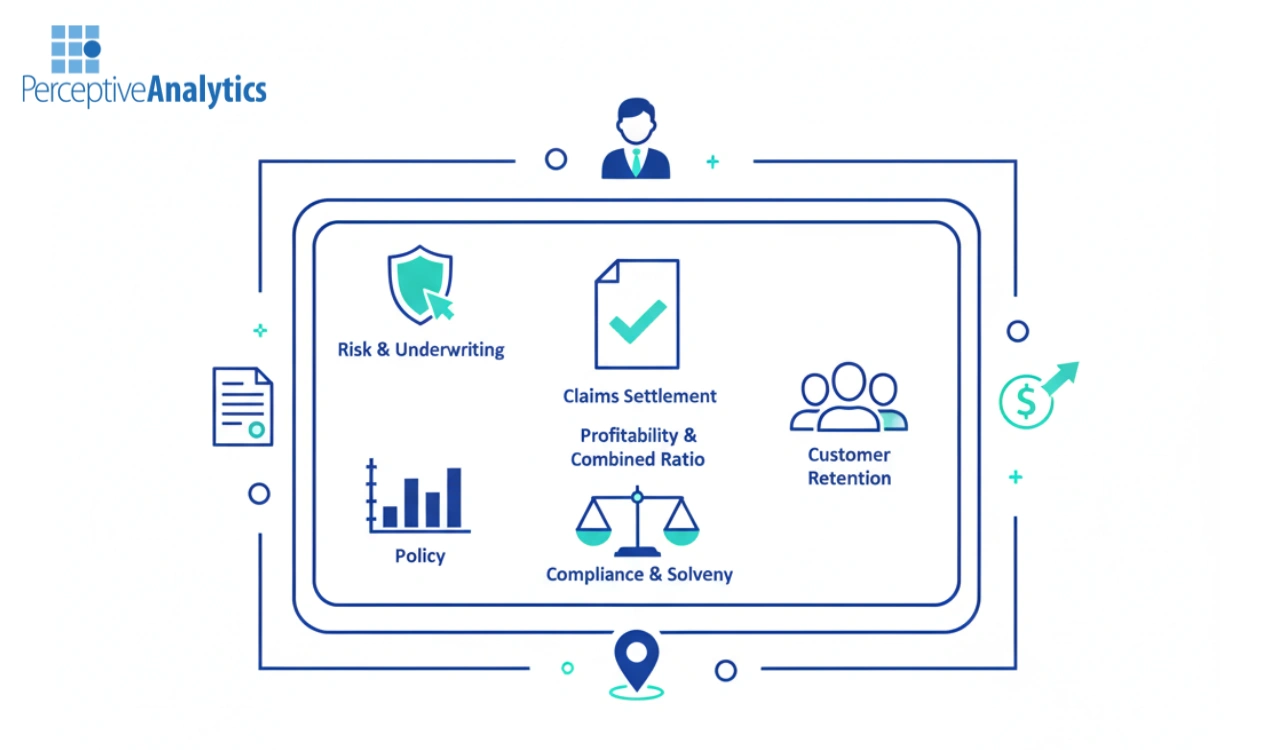
In insurance, every decision — from claims settlement to underwriting — runs on data. Yet...
For decades, insurers have competed on precision — improving underwriting accuracy, claim outcomes, and risk...
Executive Introduction Today’s CFOs juggle shrinking margins, volatile forecasts, and board requests that can’t wait...
In many organizations, dashboards are shared across multiple teams, departments, or regions. While it’s useful...
For the C-suite, every decision needs speed and certainty. Write-back in Power BI delivers both...
Executives need decisions made faster, with fewer handoffs slowing momentum. Write-back in Tableau closes the...
Your quarterly report’s headline says, “ARR up 5%.” That appears to be progress at first...
Introduction Driving operations at scale across projects, assets, vendors, and teams demands more than instinct...
Introduction In modern enterprises, technology is no longer a support function, it is the backbone...
Introduction In today’s enterprises, Human Resources has moved beyond administration to become a strategic driver...
If you’re building or improving sales dashboards, this collection is a solid place to start....
Introduction Marketing leaders today are expected to move beyond brand visibility and drive measurable business...
Introduction Leaders don’t need more charts. They need clear answers—what’s working, what’s at risk, and...
Introduction Customer support today is no longer just a reactive function, it’s a strategic advantage....
🧠 [MUST READ] Sundar Pichai: Businesses Must Optimize Content for AI Agents as They Take...
Microsoft’s Phi-4: Enterprise-Grade AI, Now On-Device Microsoft’s Phi-4 small language models deliver enterprise-grade reasoning directly...
This briefing highlights the strategic AI developments senior leaders should watch: model advances, platform moves,...
Here’s a quick roundup of recent breakthroughs shaping the future of data analytics. From AI-driven...
OpenAI Launches GPT-4.1: Cheaper, Faster, and Built for Enterprise AI Scale OpenAI’s new models —...
Choosing the right business intelligence (BI) tool can make or break your enterprise analytics strategy....
The Rise of AI in Business and Its Impact on Decision-Making Artificial Intelligence (AI) is...
Power BI introduces Translytical Task Flows: Faster decisions for today’s CXOs Until now, if you...
Dashboards with tooltips deliver clarity: Get answers on hover, no digging required Clear charts with...
60% of dashboard consumption now happens on mobile. Designing dashboards for mobile isn’t just about...
A Sunburst is a multi-layered radial chart that shows hierarchical data in one view. It...
When it’s important to track how categories rise, fall, or shift in performance over time,...
Traditional bar charts give you the “what” (What your numbers look like at a glance)....
When it’s critical to understand variability, spot outliers, or compare performance consistency, the Box and...
Turn static visuals into interactive views, using drill-down paths and branching paths to help users...
Traditional tables are useful for tracking performance, but they often lack clarity and speed. Enhanced...
Heatmaps effectively highlight high and low values but do not explain the underlying patterns. Heatmaps...
Trends over time are often shown with line or area charts. But when composition matters...
For B2B organizations, understanding how different segments perceive value, across functionality, support, pricing, and usability,...
In many dashboards, the focus is on absolute numbers. But in competitive contexts, rank often...
Traditional choropleth maps typically display a single variable. When two factors need to be compared...
Violin plots use vertically mirrored shapes to show how values are distributed, making it easier...
When the number of overlapping categories increases, Venn diagrams lose their effectiveness. They become cluttered...
In dense datasets, important patterns often remain hidden due to overlapping points. Traditional scatter plots...
In customer experience analytics, clarity of sentiment distribution is critical. Traditional stacked bar charts often...
Understanding change is as important as understanding value. A Tadpole Chart provides a compact way...
Gauge Charts turns key metrics into visual indicators of performance, making it easy to monitor...
The Key Influencers visual in Power BI brings automated, AI-powered analysis directly to your dashboard,...
Enclosed Dot Plots display the actual value as a dot, plotted against a background bar...
Traditional heatmaps are great for exact lookups, but they often break the natural flow of...
Line charts are useful for showing trends, but when there are a large number of...
Gantt charts are often used to show how long things take, but they usually only...
Traditional charts like stacked bars are useful for showing proportions, but they fall short when...
Traditional charts like stacked bars can show absolute values across categories, but they fall short...
Difference bar charts put the spotlight on change, not just the numbers. Instead of showing...
Divergent histograms place each group on opposite sides of a central axis, making comparisons intuitive....
When two metrics are shown in separate charts, it becomes difficult to understand their combined...
When you need to navigate complex hierarchies with clarity, the Icicle Chart provides a clear,...
Traditional tree maps can quickly become overwhelming when dealing with deep product hierarchies or a...
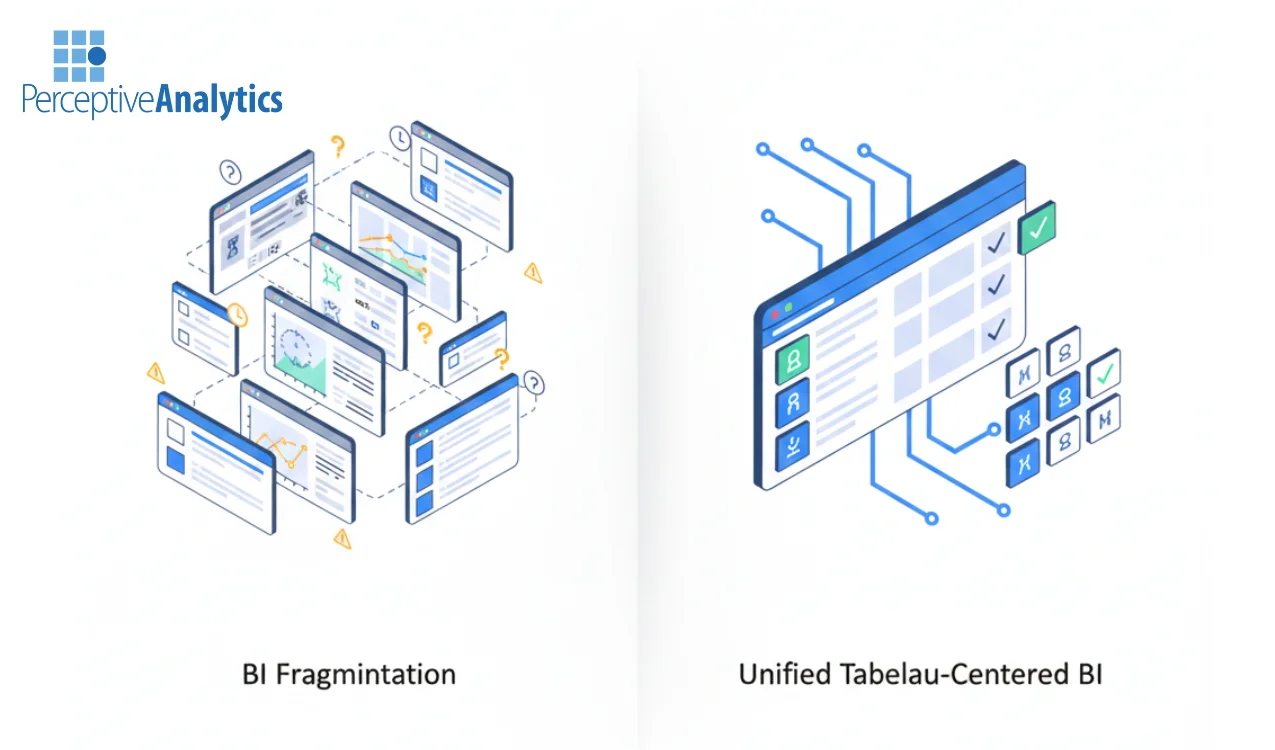
Tableau reporting is a core decision-making layer for modern enterprises. Yet many organizations still run...
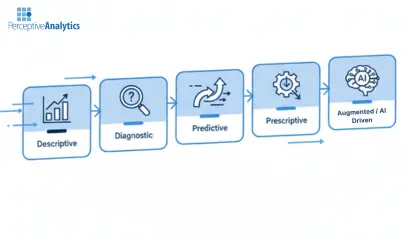
Why Advanced Analytics Matters for Modern Decision-Making Modern businesses require more than intuition—they need advanced...
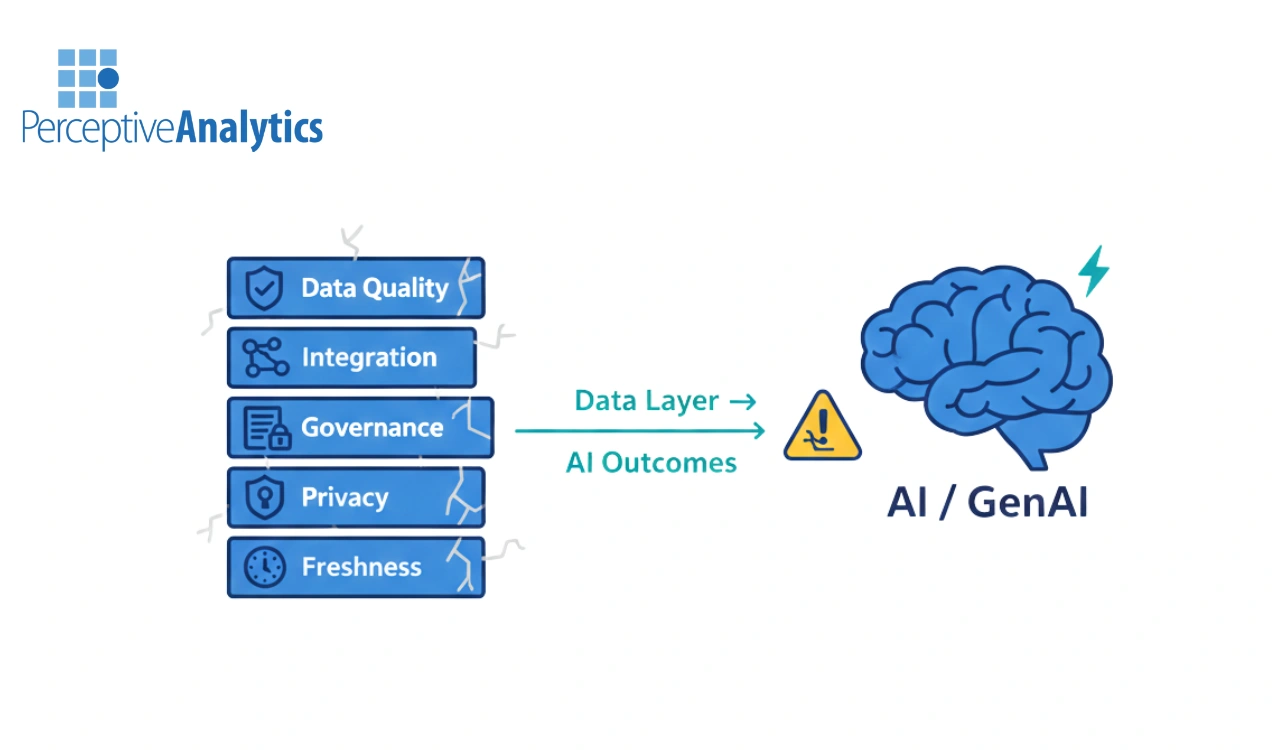
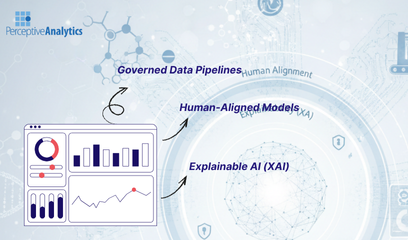
Building reliable AI and GenAI systems starts with one critical foundation—data governance. Without strong governance,...
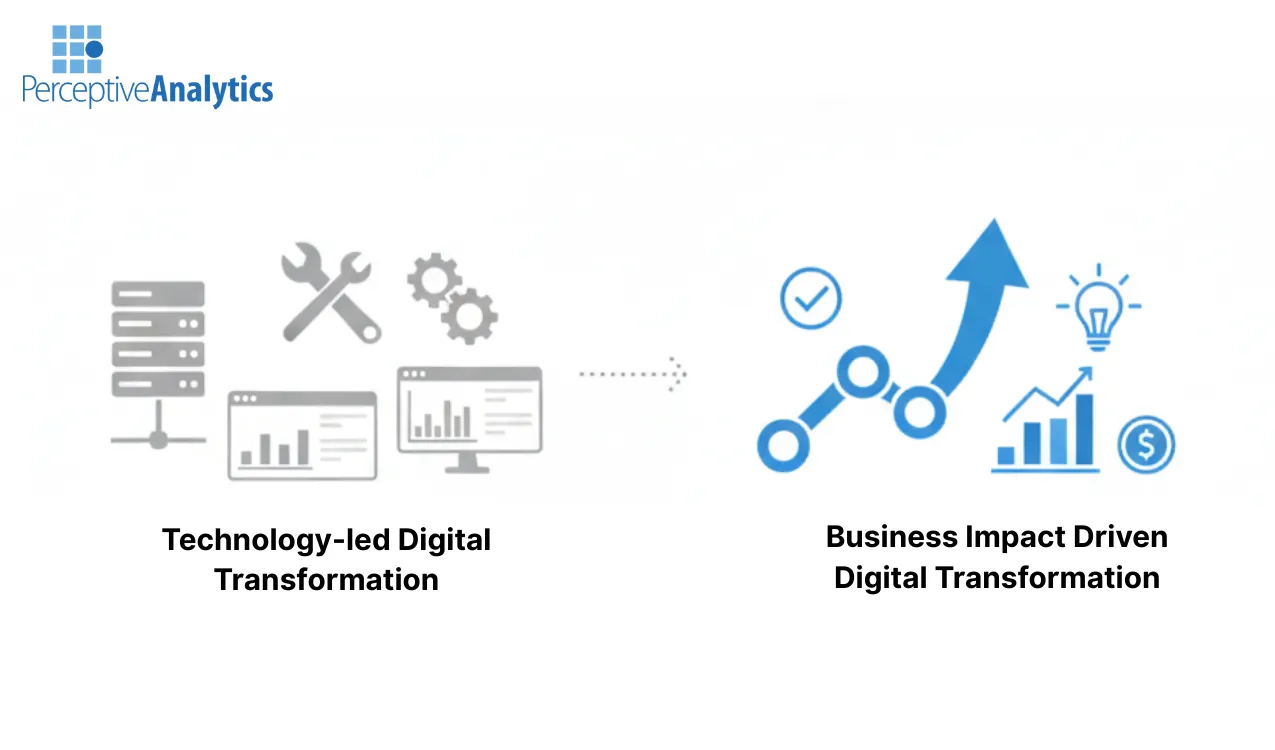
A digital transformation strategy is no longer optional—it defines how organizations compete, scale, and remain...
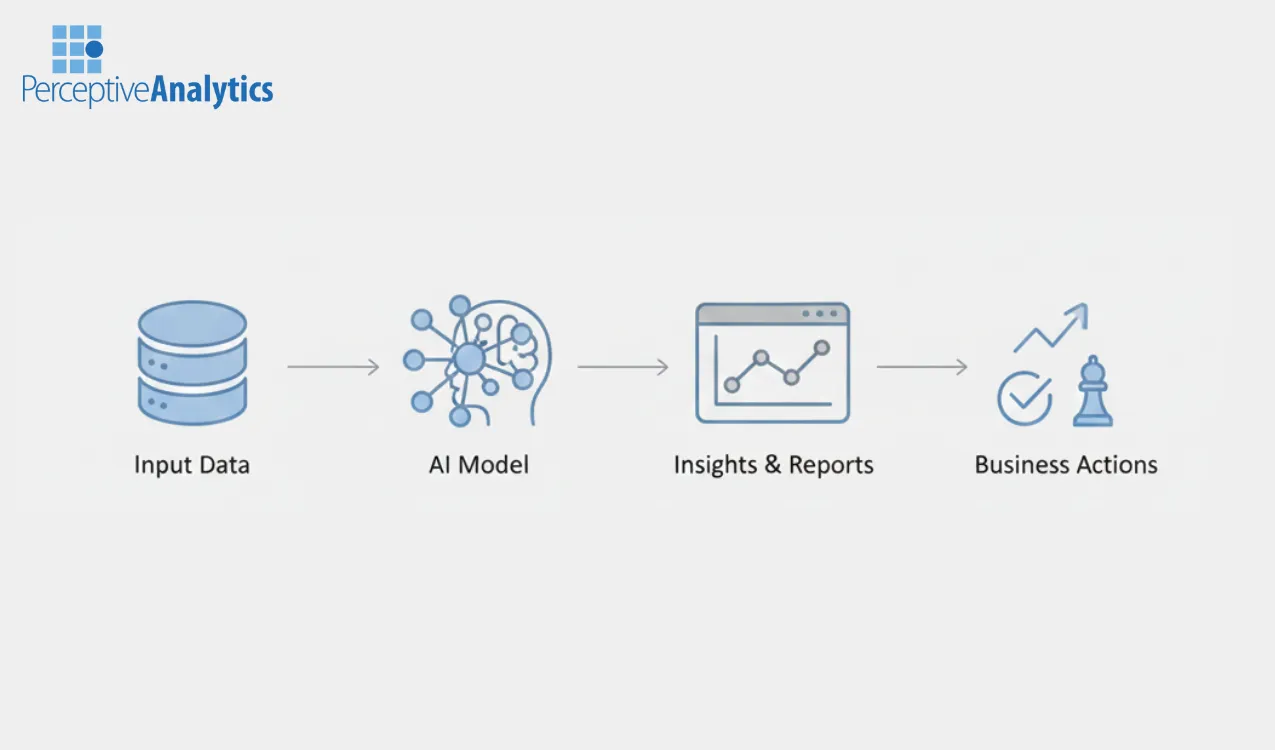
The Growing Role of AI in Data Analytic AI in data analytics is transforming how...
In this article, we will show you how to speed up the loading of your...
Executive Introduction String calculations are powerful, but on big datasets they’re expensive. When Tableau does...
A great business dashboard combines high performance and ease of use. In this article, we...
If you don’t write efficient calcs, it can slow down your dashboard. In this article,...
London cholera outbreak slides London cholera outbreak viz Tableau workbook Data prep python code For...
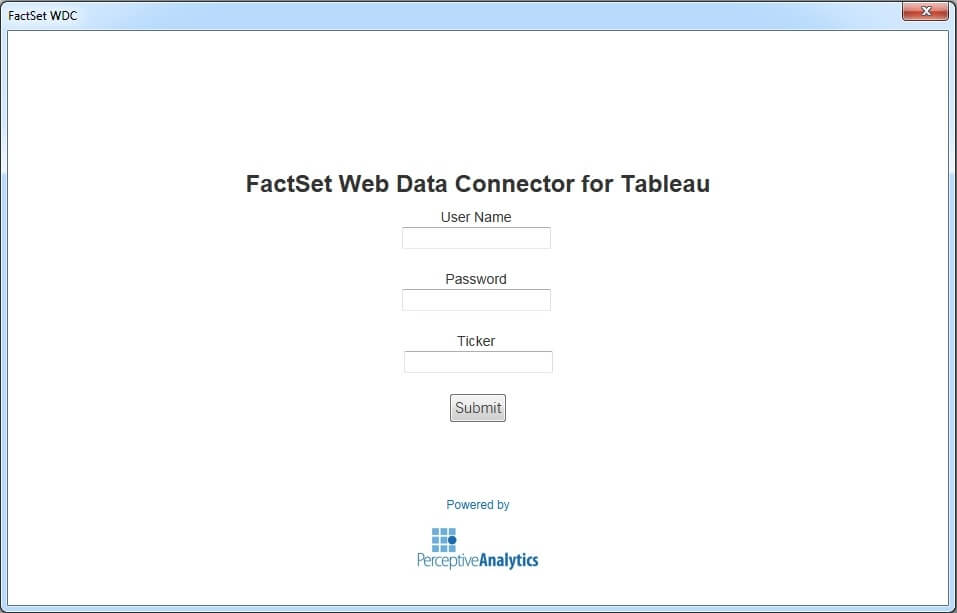
This is how you create web data connector for FactSet in Tableau.
Statistics in Tableau Data in the right hands can be extremely powerful and can be...
Did you know that Netflix has over 76,000 genres to categorize its movie and tv...
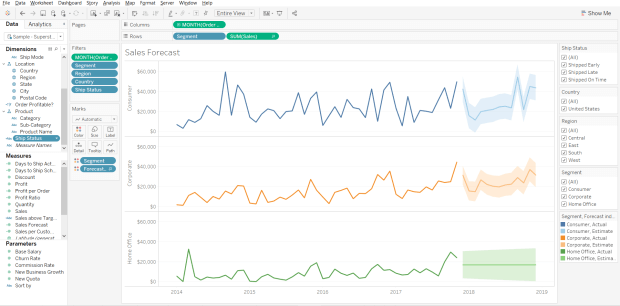
Driving Sales Performance with Tableau Dashboards Executive Overview Business leaders don’t need more reports —...
TABLEAU FILTERING ACTIONS MADE EASY This is a guest post provided by Vishal Bagla, Chaitanya Sagar, and...
Implementing Principal Component Analysis (PCA) in R Give me six hours to chop down a...
Histogram in R How to create histograms in R To start off with analysis on...
Coding is the process by which a programmer converts tasks from human-readable logic to machine-readable...
Over the last couple of articles, We learned different classification and regression algorithms. Now in this...
Working in machine learning field is not only about building different classification or clustering models. It’s more...
Reinforcement Learning with R Machine learning algorithms were mainly divided into three main categories. Supervised learning algorithms...
In the past one decade, there has been an exponential surge in the online activity...
Categorical data is a kind of data which has a predefined set of values. Taking...
Linear regression is a basic tool. It works on the assumption that there exists a linear...
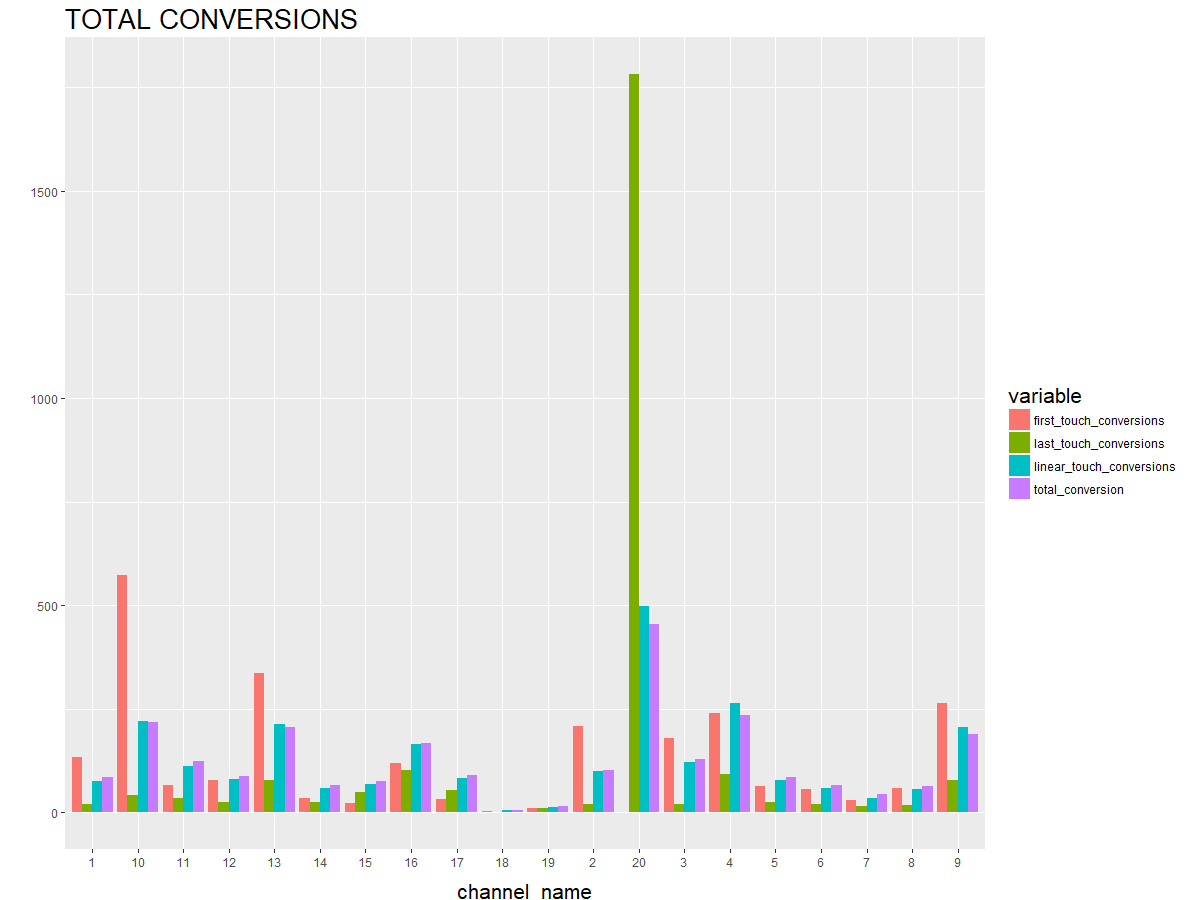
Introduction In a typical ‘from think to buy’ customer journey, a customer goes through multiple...
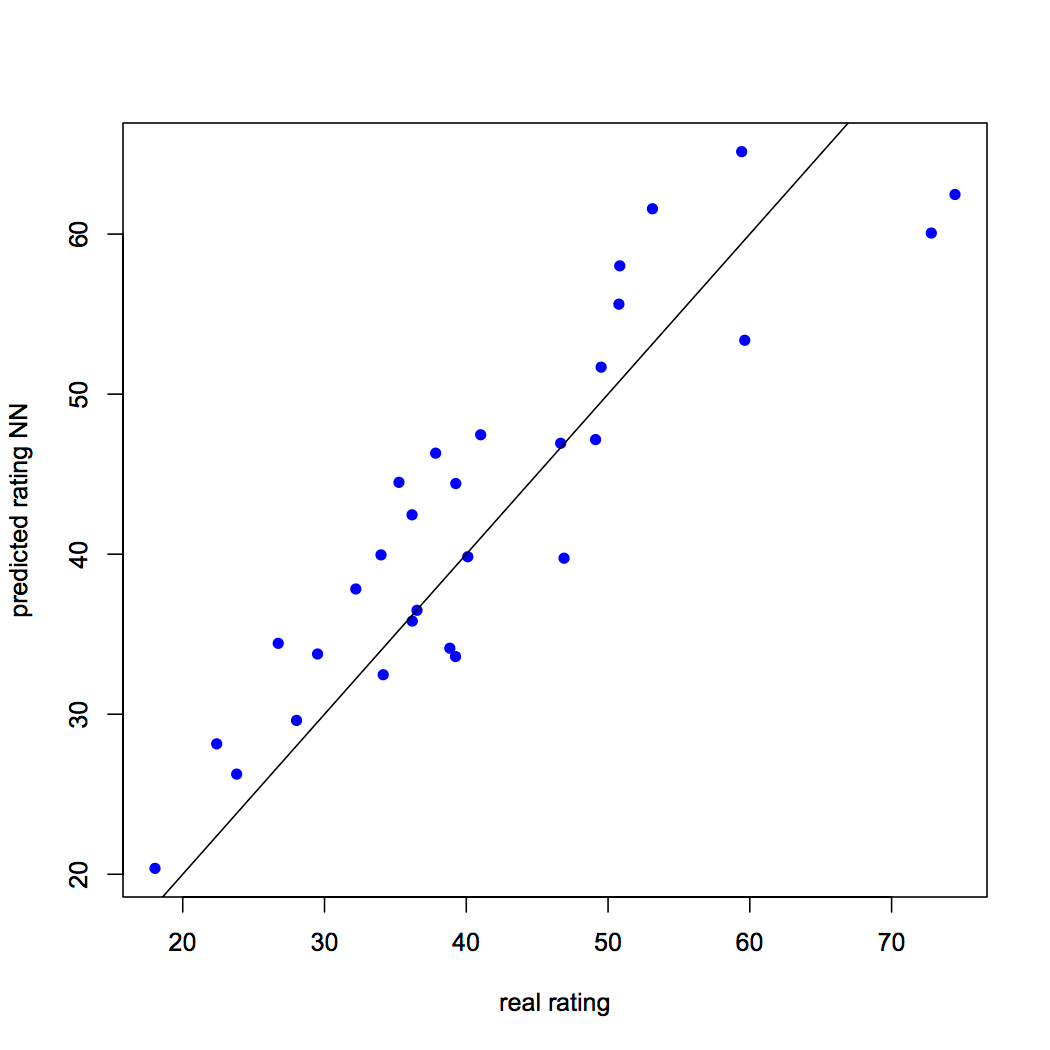
Introduction Neural network is an information-processing machine and can be viewed as analogous to human...
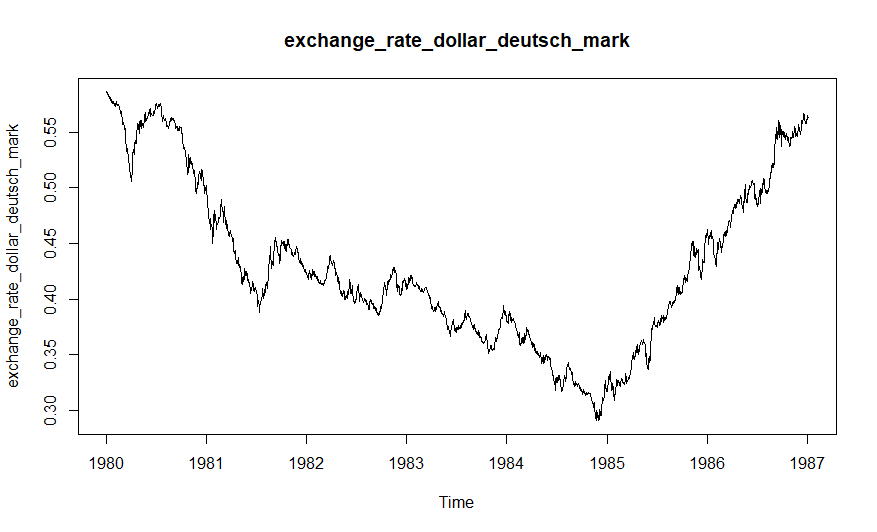
To go into the turbulent seas of volatile data and analyze it in a time...
Choropleth maps provides a very simple and easy way to understand visualizations of a measurement...
If you are a data scientist who wants to capture data from such web pages...
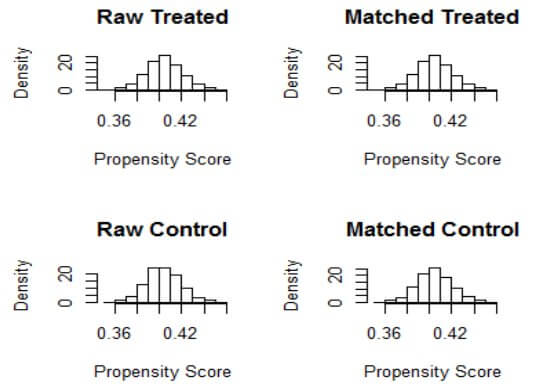
Propensity scores are an alternative method to estimate the effect of receiving treatment when random...
Optimization is a technique for finding out the best possible solution for a given problem...
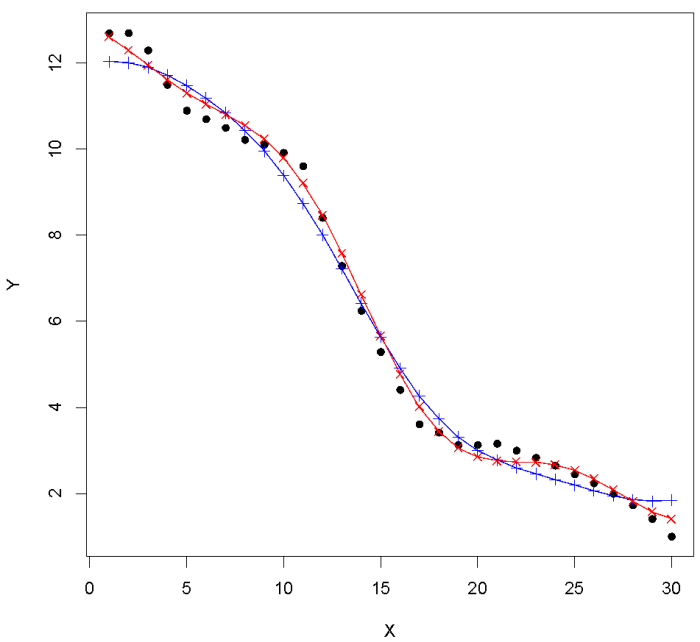
The article studies the advantage of Support Vector Regression (SVR) over Simple Linear Regression (SLR)...
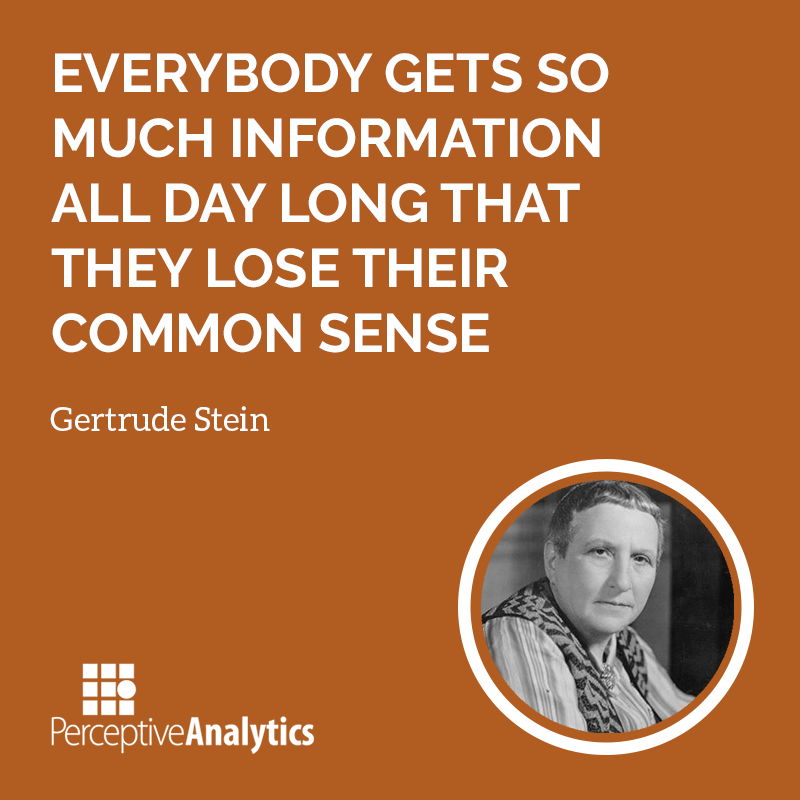
It All Starts With The Text There is so much of information lying in the...
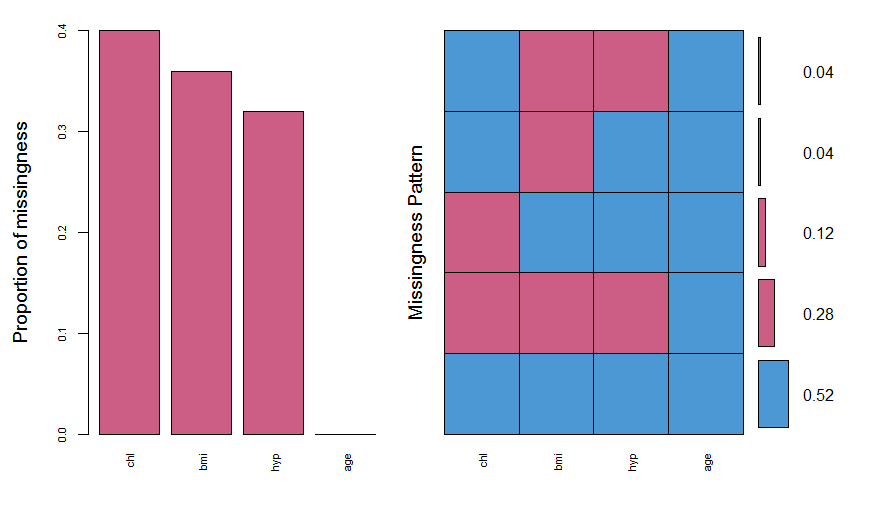
Handling missing values is one of the worst nightmares a data analyst dreams of. In...
In this article, we aim to discuss various GLMs that are widely used in the...
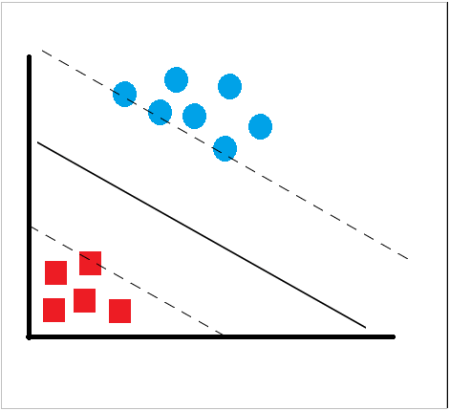
Support Vector Machines (SVM) is a data classification method that separates data using hyperplanes. The...
If something takes less time if done through parallel processing, why not do it and...
K-Means Clustering is a well known technique based on unsupervised learning. As the name mentions,...
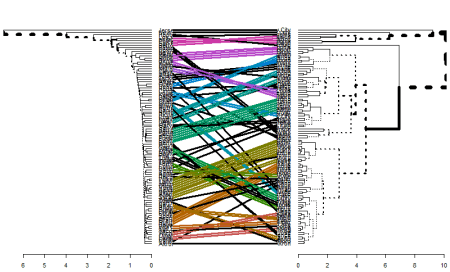
What is Hierarchical Clustering? Clustering is a technique to club similar data points into one...
Imagine you were to buy a car, would you just go to a store and...
The Best Algorithms are the Simplest The field of data science has progressed from simple...
Introduction to Looping system Imagine you were to perform a simple task, let’s say calculating...
Another way of analysis? When there are so many tools and techniques of prediction modelling,...
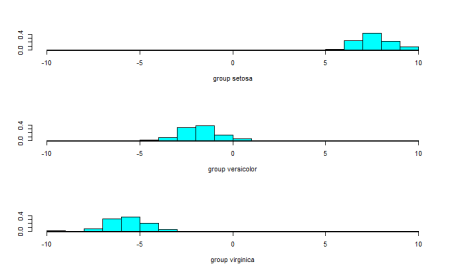
Discriminant analysis is used when the variable to be predicted is categorical in nature. This...
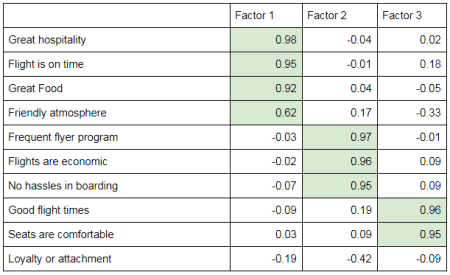
Changing Your Viewpoint for Factors In real life, data tends to follow some patterns but...
The World of Anomalies Detecting anomalies — unusual or unexpected events in data — is...
Why Data Science? The Digital age is here. The world’s most valuable resource is no...
Every business would have silos of business data in its marketing/sales department.
Word cloud is a powerful way to analyze patterns in text, particularly keywords in Internet...
When you visualize data, you see it in new light. If you really want to...
Would you like to increase Marketing ROI? Do you need insights about which channel is...
How can you use twitter to know which geographies to target your customers through twitter?...
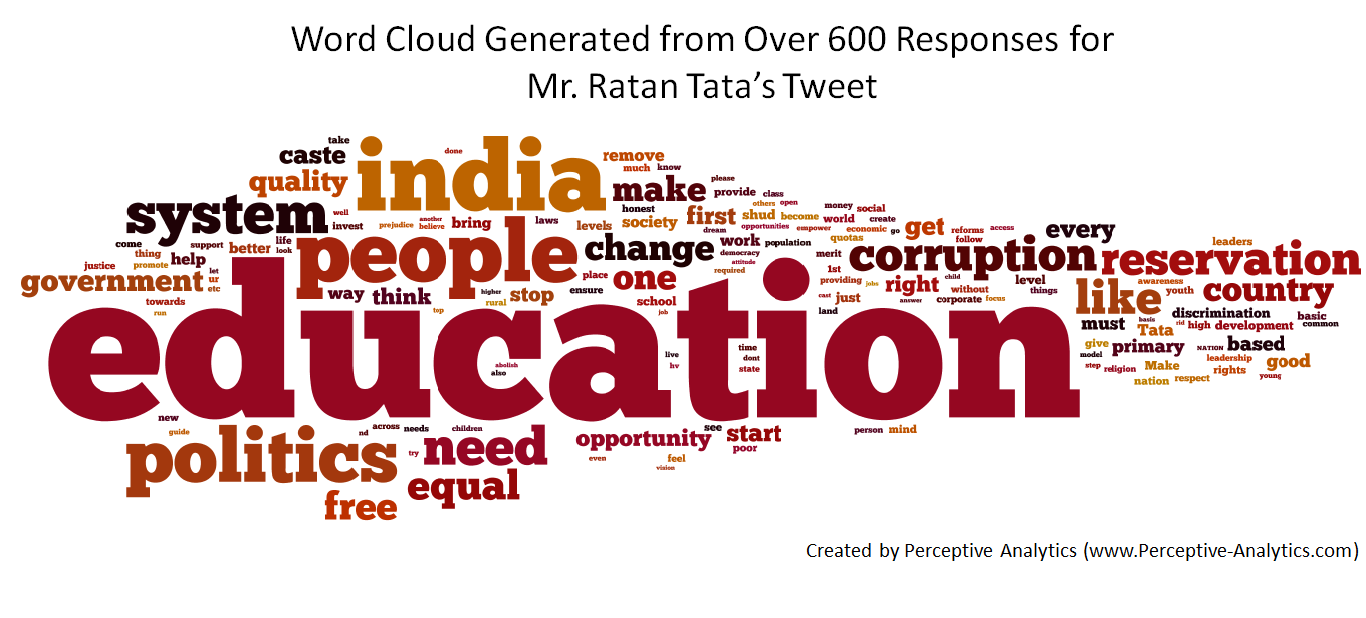
Ratan Tata has recently asked a question on twitter – “What should we do to...
Do you know that Departmental stores are being replaced by Warehouse clubs and Super stores?...
A video case study on Pilot Training
Video case study on Financial modelling
This is a video case-study on Investment Banking
Check out this video case study that talks about segmentation and identifying cross-sell opportunities.
Learn more about us: Perceptive Analytics is an award winning Data analytics company. It won...
Learn more about us: Tableau Consulting Marketing Analytics Companies Data Analytics for E-commerce Data Analytics...
Learn more about us Tableau Consulting Marketing Analytics Companies Data Analytics for E-commerce Data Analytics for Retail...
Learn more about us: Our company has Tableau Consulting services and Marketing Analytics services. We...
You can know more about us here:
Our company has Tableau Consulting services and Marketing Analytics services. We also provide Data Analytics...
Search Engine Marketing is Great! But You Can End Up Spending Too Much! In a...
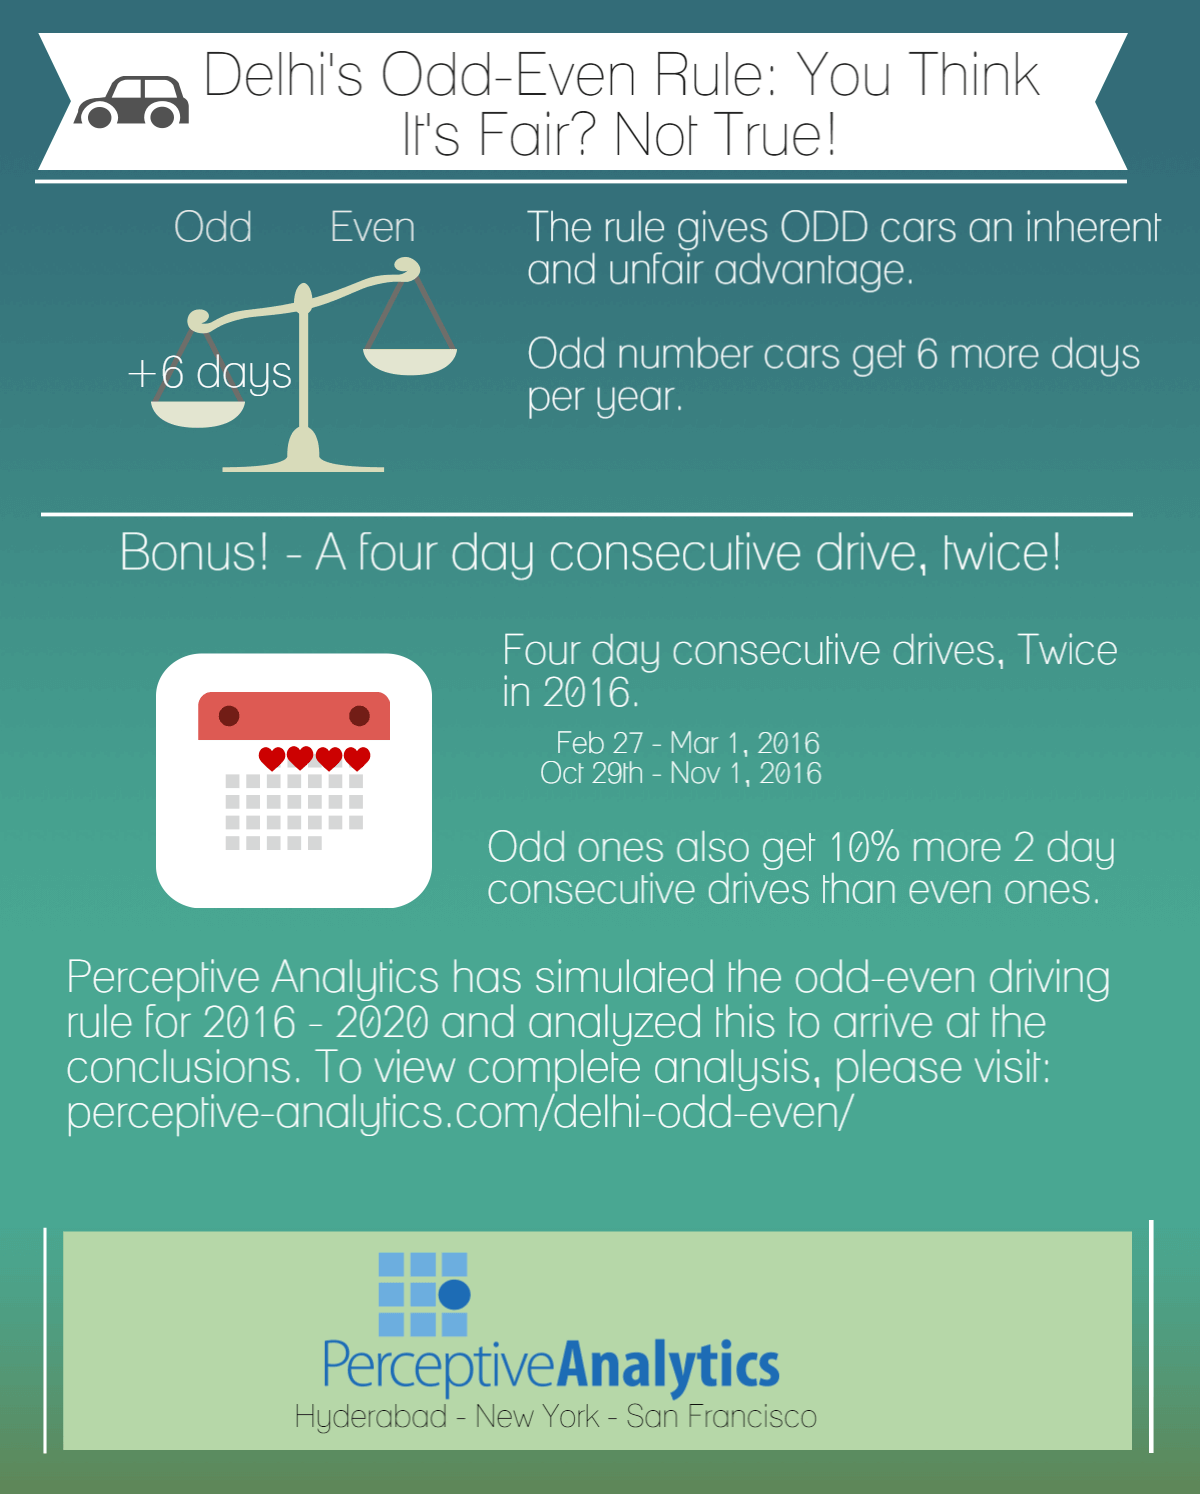
Delhi odd even rule analysis
Investment Decision Support for CFO Our client is the CFO of a mid – sized...
Financial Modeling to Determine Customer Tariff The client decided to spin off its gas division...
Executive Summary : Financial Modeling to Support Investment Decision Analysis The client, a non-profit art organization...
Reinventing Coupons: Strategies for a Successful Coupon Campaign Coupons are recognized to be a highly...
Leveraging Web Analytics for Customer Acquisition The client is a financial services company based in...
Identifying Cross Selling Opportunities PayAvenue is a payment gateway provider that allows users to pay...
Inventory Optimization for a Food Distribution Network NiteFoodie is a medium sized American fast food...
Location Strategy to Improve Effectiveness of a Branch Network This report draws attention to the...
India’s Macroeconomic Policy: Locked in an Anti-Growth Trap This report draws attention to the poor...
Financial Forecasting Tool for a Silicon Valley Startup GreatSoft, Inc. is a hi-tech company based...
Financial Modeling to Raise Capital Insta Variety is in the business of providing cloud based...
Excel Application for Street Lighting Design CLASP is an international non-profit organization striving to improve...
Employee Training Dashboard Heli, Inc. is a helicopter services provider based in Canada. The company’s...
The client is the CFO of a mid-sized electronics company engaged in activities related to...
Route Optimization Case Study The client is a logistics company with around 250 branches and...
In this article series we explain how to analyze and find right keywords from Google...
Analyzing Text: Word clouds is a great way to analyze underlying patterns in Text. Here’s...
Let Your Data Speak Do you realize that your data has hidden treasures? Something that...
Do you know how much spam are you creating? Do you customers appreciate your marketing...
Do know your customers well? Where do they come from? Why did they buy your...