


1 Customer Lifetime Value
1.1 What is Customer Lifetime Value
Customer Lifetime Value (CLV), putting in simple terms, is the worth of a customer to a business for the complete period of their relationship, or the total amount of money, a business can expect from the customer during their lifetime. Revenue generated by the customer varies for each customer business pair individually. For a business, a customer might be worth a million, but a second customer might be worth nil, or maybe the first one might worth nil for another business. CLV can be used as a metric of profit associated with a customer-business relationship. A fast way for determining a customer’s profitability and the potential for the company to develop over the long run is to compare the customer lifetime value against the cost of acquiring a new client.
Customer profitability, sometimes referred to as CP (the difference between the revenues and the expenses connected with the customer connection for a specific period), is distinguished from customer lifetime value, or CLV, by the fact that CP evaluates the past, while CLV anticipates the future. It’s a significant measure, and the way you approach it may not only help define your company but also change considerably based on what it is you want your company to do for you in the long run. For further detail, have a look at this article.
1.2 Strategic Importance of CLV
As the cost of acquiring new customer is higher than retaining an existing customer, which means that existing customers are great wealth to a business. With customer lifetime value in action, a business can decide how much money to spend on acquiring new customer and how much on retaining existing customers. Not just that, with in depth analysis of Customer Lifetime Value, a business can divide its customers into segments and then decide upon strategies, expenditure and action plan for each group separately.
CLV can also be used to predict or catch early signs of attrition, for example for TeleCom Company, lesser and lesser subscriptions over the months or years shows signs of attrition. All businesses irrespective of size, capital needs strategies to retain its customers and acquire new customers in such a manner to maximise the profit. High CLV is an indicator of product-market fit, brand loyalty and recurring revenue from existing customers. Hence, it becomes important for every business to analyse its customer base and profitability. For more details, refer to this article.
With in-depth analysis of Customer Lifetime Value, a business can divide its customers into segments and then decide upon strategies, expenditure and action plans for each group separately — a key practice among leading marketing analytics companies.
2 Calculating Customer Lifetime Value
2.1 Basic Understanding
As described in the above section, CLV is the total worth generated by customer in the complete relationship lifetime. So, we can say that for a customer CLV can be calculated
Customer Life time Value = Customer Value × Customer Life time
where Customer Value is what truly differentiates a customer from other and is given by
Customer Value = Average Purchase Value × Number of Transactions
If talking in terms of profit, the Customer Lifetime Value will see a change in the term of Customer
Value given as
Customer Value = Average Purchase Value × Number o f Transactions × Profit Margin
and the term Customer Lifetime represents the retention period of a customer for the business. Let’s take an small example, For a hypothetical Clothing Store, the average purchase value of an item is |500, and a customer, on average shops for 5 times a year, in this case the Customer Value would be calculated as
Customer Value = 500 × 5 = 2500
and let say the average profit margin is 20%, then the Customer Value would be:
Customer Value = 2500 × 0.2 = 500
And an average customer shops for 10 years from the Store, then the Customer Lifetime will be 10 years. So the Customer Lifetime Value will be calculated as:
CLV = Customer Value × Customer Life time = 500 × 10 = 5000
This is the basic idea behind calculation of CLV. However, in practical, the calculation is not this simple, there are several factors that account in calculation of CLV. We will be talking about these factors in upcoming sections. Important point to note that in our calculation, we have taken a few factors, such as Purchase Value, Customer Lifetime, Profit Margin but these factors are not as static as we have assumed. Such factors change with time and will affect our Customer Lifetime Value.
2.2 Factors Affecting CLV
2.2.1 Customer Lifespan
As stated earlier, it is the duration for which a customer was actively associated with the business, performing transactions before being dormant or dropping off. The cost of customer retention is generally much lower than customer acquisition cost, so it can be simply understood that the longer the duration for which a customer remains loyal to a brand, more profitable the customer will be for the firm. This statistic is significant when you examine the expenses connected with recruiting new consumers as well as determining whether you should spend more or less to discover new customers. This calculation is a component of a much broader one that determines the Customer Lifetime Value (CLV).
2.2.2 Retention Cost and Rate
Retention Cost, is the amount spent on a customer in various forms, such as discounts, ad campaign, emailing, customer services, etc. Retention Rate is the percentage of customers who continued with the business. Higher retention cost mean that the customer is costing high for the firm and it may be the case that customer may not prove to be profitable at all, if they doesn’t provide firm back with purchases (revenue). Higher retention rate is desired by each companies. Companies like to keep Retention cost low, up to a certain limit that it doesn’t cost them with losing customers, keeping the retention rate high. The retention cost may vary from customer to customer. Companies generally have different policies for different segment of customers, resulting in different retention cost for each segment.
2.2.3 Customer Churn Rate
Customer Churn rate (also known as attrition rate), in its simplest terms, is a measure of the number of customers ceasing the relationship with their current service provider on the basis of dissatisfaction. Customer churn is when an existing customer, user, player, subscriber or any kind of return client stops doing business or ends the relationship with a company. This could, for example, mean cancellation of a subscription, non-renewal of a contract or service agreement, ending of a membership or Consumer decision to shop at another store/use another service provider. It is just opposite of retention rate. High Churn Rate means companies need to lookout for new customers or get their past customers back, if they intend to make profits. As stated earlier, acquisition cost are much higher than retention cost, meaning more cost to the company, which is not desired.
2.2.4 Acquisition Cost
Acquisition Cost is the money spent for acquiring a new customer, that could be in term of media and publicity, advertisement, direct contacts, etc. Higher Acquisition Cost implies high input and an additional reduction from the profit. This means that this quantity just like retention cost, must be subtracted from the pre-calculated Customer Lifetime Value, to get a better result for CLV. Acquisition cost varies from customer to customer. It maybe possible that for all the customer some expenses in acquisition such as Advertisement may be same, but other components vary from one customer to other. It is the business that decides how much to expend for acquiring a particular type of customer.
2.2.5 Profit Margin
Profit Margin is one of the most popular profitability ratio for measuring the income of a business in terms of the money expend. It is represented in percentage and shows how much money business made per |100 of investment. There are several types of Profit Margin, but the most commonly used one is net profit Margin, which the companies saving after all other expenses.
![]()
Profit Margin is an important factor is calculation of CLV, as we have seen already. Higher Profit Margins means more profit by the business, which is desired. However, the profit margin may not be same for every customer, for example, in general trend, upon purchasing large bundles of a product, a customer might get and extra discount, thus reducing the profit margin. Similarly, TeleCom companies offer different plans for different type of users, each having a different profit margin for the business.
So far, we had a basic understanding of the calculation of CLV, but we also saw that the calculation is not that simple and involves several factors, which maybe dynamic in nature. We have specialised models for calculation of CLV. These models use different approaches, different assumptions and consider different factors and analyse them in their unique way. We will look into these models in the subsequent sections.
3 Models for Customer Lifetime Value
Many models are present in the literature for calculation of CLV, each one with dealing with different condition of factors, having different target outcome. On the basis of approach, they can be summarised in following three categories:
A) Deterministic Models
Customers in deterministic models are given scores that are based on the characteristics of their previous purchases. These criteria include the purchase frequency, recency, purchase amount, and so on. On the basis of these scores, it is projected what the consumer behaviour is going to be in the next purchase period, assuming that customer behaviour is going to remain same, and thus, CLV is derived. RFM models, retention model, migration model are some of the most common models of this category.
B) Probability Models
In probability models, the behaviour of customers is analysed in terms of the stochastic processes that are operating in the background. These processes are defined by the observable and latent aspects of client purchase behaviours. The fact that these qualities differ from person to person makes the concept more applicable in the real world. These models are used when calculating CLV on an aggregate level such customer cohort or customer base, rather than at the individual customer level. Pareto/NBD, EP/NBD, Gamma-Gamma are the most popular models of this category. For predicting future transactions, purchase frequency and Churn, we used Pareto/NBD, or EP/NBD or BG/NBD Model but for predicting monetary values such as Average order Value, we use Gamma-Gamma
model(see here).
C) Econometric Models
In the third category, known as the Econometrics Models, the behaviour of customers is observed based on variables such as customer acquisition, retention, and growth (cross-selling or margin), and then these factors are combined (all or few of them) to estimate customer lifetime value (CLV). These models operate on a basis that is fairly similar to that of probability models. Some of the most popular models include model for Customer Acquisition, Customer Retention, Customer Margin, Customer Expansion, etc. We will into econometric models later in more detail.
Persistence Models are an improved version of the Econometric Models that are included in the underlying concept. In a manner that is analogous to that of the Econometric Models, they model behaviour on the basis of the purchase components such as acquisition, retention, and so on. Within the framework of the Persistence Models, these constituents are regarded as dynamic systems and subjected to time series analysis. The method examines how the changes in one variable influence the others and takes those relationships into account.
On the basis of desired outcome, we can also classify the models as follows:
A) Models for calculation of CLV
In the first category are the models that have been developed specifically for the goal of calculating the Customer Lifetime Value (CLV), or that utilise the results of CLV calculations to develop a strategy for the most effective use of available resources in order to maximise CLV. These are a compilation of applicable models that are used in the process of formulating CLV-based plans and choices. Some of the popular models of this category are basic structural model, customer migration model, optimal resource allocation model, customer relationship model, we will look into more detail for some of these models.
B) Models of customer base analysis
The second category takes into account the previous purchase patterns of an organization’s entire customer base in order to forecast the probabilities of customer behaviour during the subsequent purchase period. This can be done in terms of the likelihood of a purchase being made or the predictive value of a purchase being made. When assessing the chance of a customer making a purchase in the subsequent time period, these models take into consideration the stochastic behaviour of consumer purchases. This implies that they take into account the reliability of each and every client. The CLV is calculated using the results of these models as the foundation for the computation or as the underlying theorem for calculating CLV. Some of the most common models for this category
are Pareto/NBD, EP/NBD, etc.
C) Normative models of CLV
Normative Models focus primarily on the problems that have an effect on the CLV and, as a result, help maximise the CLV. These include the research into the effects of a variety of variables on CLV and the elucidation of the guiding principles that may optimise these aspects to provide the greatest possible CLV. When calculating CLV, these models account for some of the most fundamental assumptions and beliefs, such as the notion that customers with longer lifetimes generate higher profits. The concerns with CLV are studied using normative models, which, in contrast to empirical models, these do not allow for the interference of noise. The majority of these models have overlooked competition, mostly because there was a lack of data related to the influence that competitors had. There are several models for the many components that make up CLV, such as acquisition, retention, profit margin,
purchase frequency, etc., and occasionally these aspects are merged into a single model. However, there are distinct models for each of these components. Some of the most popular models of this category are Customer Equity Model, Dynamic Pricing Model, etc.
We looked at the broad categorization of CLV Models, let’s have a look at some of the most popular CLV models.
3.1 Basic Structural Model of CLV
This model specifies a class of distinct CLV models based on the Net Present Value (NPV) of the future cash flows from customers. These NPVs are derived from the cash flows that will be received from consumers in the future. This fundamental concept of NPV is what defines such models to their core. These models make the assumption that there will be a cash flow at a certain moment throughout each and every time period. This is one of the most noticeable aspects of these models. This model only takes into account the customers who are now doing business with the company; it does not take into account customers who have done business with the company in the past or customers who may do business with the company in the future. In addition to this, it disregards the cost of acquisition as well as the probabilistic aspects of cash flow and shopping behaviour. The model will be given as
![]()
where i is the period in which cash is generated from customer transactions; Ri is the amount of revenue generated from customers in period i and Ci is the entire cost of earning the revenue Ri in period i and n is the total number of periods that make up the customer’s expected life span.
3.2 Customer Migration Model
According to Dwyer (1997), who was the one who introduced this concept, the consumers may be separated into two subgroups: those who are always-a-share and those who have lost their share permanently, lost-for-good. Always-a-share denotes that a consumer may maintain relationships with several companies at the same time, doing business with each company in turn in a back-and-forth cycle, or sharing his purchases with all of the companies with whom he is affiliated. When using lost for-good, a client who has recently switched companies or ended their previous connection with the business is deemed lost. This applies even if the customer has been doing business with the same company for a significant amount of time. The fundamental premise that underpins lost-for-good is that switching suppliers is expensive and difficult from a management standpoint. This is exactly the
reverse of the perspective that is taken in the always-a-share category. The model that we looked at before, which is the fundamental structural model for CLV, may either be utilised on its own or be supplemented with some changes in order to be used for the customers who fall into the category of lost-for-good. For the second Category, which is always-a-share, we are going to have to make the assumption that a client is never going to be lost. For this specific category, we have a customer migration model that makes use of a customer’s most recent purchase history in
order to forecast that customer’s behaviour towards future purchases. It only indicates whether or not the buyer will make a purchase during the next season but does not talks about the purchase amount. This model may be combined with a few other models, which will be covered in more detail later on, that discuss the anticipated purchase amount in order to arrive at an accurate estimate of CLV.
The fact that this model takes into consideration the stochastic character of buying behaviour (in the form of recency), which is something that many simpler models don’t do, is a noteworthy benefit of this model. Dwyer’s model has other limitations as well, some of which are similar to those of the fundamental structural model, and it also makes the assumption that the purchase will occur at the same same instant in each time period, which presupposes that all time periods are the same in and of themselves.
3.3 Customer Retention Model
Customer Retention Models(CRM) are deceptively simple in that they account for basic features of CLV and represent them concisely very well. We provide a definition for the term Discounted Expected Transaction (DET), which was first proposed by Calciu and Salerno. This term DET represents the CLV or transactions in which the monetary benefit (profit margin) is one hundred percent. Therefore, we are able to define CLV as a product of DET and monetary gain, which, in the typical situation, does not equal 1. This model is one of the deterministic models.
C LV = g × DET
where g is the monetary gain. For a just acquired customer, CLV is given by
![]()
where “g” represents the net gain or margin, “d” represents the discount rate, and “r” represents the retention rate that we discussed before. After some more streamlining, the model for CLV that was illustrated above may be expressed in writing as:
![]()
The fraction obtained by dividing r by (1+d-r), i.e, r (1+d−r) is referred to as the margin multiple. It has been assumed that the gain would stay unchanged with time, but if the gain has to rise at a constant rate of q, then the margin multiple will be r (1+d−r(1+q) . When estimating CLV for groups of customers, deterministic models neglect the discrete probabilistic character of consumers, which is one key shortcoming of such models, despite the fact that they perform quite well for management purposes.
Earlier on, we had made the assumption that the retention rate would stay the same, but it turns out that this is not the case. Businesses have the ability to modify retention criteria by altering either their retention budget or their retention policy. So now, r instead of remaining constant, could be a function of these variable given as f (R). So our model would change to be:
![]()
where (m −R f/(R)) is the gain g, which is margin minus average retention cost and R is the fraction of retention spending per customer.
3.4 Pareto/Negative Binomial Distribution Model
When calculating CLV, it is of the utmost importance to have a comprehensive understanding of the client base, which includes both current customers and potential new consumers. The Negative Binomial Distribution (NBD), often known as the Pareto Model, is one of the most well-known probabilistic models for addressing CLV. It was first proposed by Schmittlein, Morrison, and Colombo. It gives us an idea of the likelihood that a consumer is still active. This approach has been used by commercial enterprises in the process of calculating their customer base, also known as the company’s active clientele.
The forecast is made on the basis of the purchase history of the consumer, taking into consideration both the recency and frequency of their purchases. This model may not only be used to analyse the already-established client base, but it can also be used to provide forecasts about the expansion of the customer base. Unlike the models that were previously mentioned, this model takes into consideration the stochastic character of the client, which means that a customer may make any purchase at any moment in time and can become inactive and active at any time. Pareto/NBD Model is given as follows:
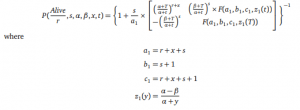
r, s, α,β are model parameters, t is the time since trial at which the most recent transaction occurred, T is the time since trial, x is the number of purchases made in the time period T, F() is the Gauss hypergeometric function Reinartz and Kumar made several modifications to the Pareto Model in order to provide a framework
that can be used in non-contractual contexts for the purpose of determining the customer lifetime profitability pattern and the model is named as Extended Pareto/NBD Model. A non-contractual situation is one in which the client has complete power over the purchasing choices, and the company has no say in the matter. They decided to go with a discontinuous output in the form of a categorization of Alive/Dead rather of a continuous probability stream in the event that the Pareto Model was used.
This model used information about when the connection with the customer first began and the customer’s purchasing patterns to generate a probability threshold. Using this threshold, the researchers determined when the client would no longer be profitable to the company. This model also provides us with information on the lifespan of the client, which may be expressed as the difference between the expected time of death and the time of birth. These models may be used in scenarios where the analyst is unaware of the client’s period of inactivity and the customer is free to make any number of purchases at any time as well as to become inactive at any time. In several experiments on finding best suited models for online retail stores, the EP/NBD model has outperformed other probabilistic models in a majority of evaluation metrics and can be considered good and stable for non-contractual
relations in online shopping. It should be emphasised, however, that in order for such models as Pareto or Modified-Pareto to perform, a lengthy stream of data is necessary; transaction statistics for at least three years is believed to be essential. This is something that should be kept in mind while using these models. The two models discussed above are quite complex, which makes it challenging to use them in real-world settings. Additionally, when the number of clients in the customer base grows and the average amount each customer spends declines, these models become less effective since they take into account each customer individually to determine individual probabilities of purchase.
3.5 Customer Equity Model
In the last section, we looked at a model to help us better understand a company’s customer base; this model, the Customer Equity Model, which was established by Blattberg and Thomas, provides the customer equity value for newly acquired consumers. With the assistance of this model, a firm is able to do an in-depth analysis of the influence that marketing has, element by element, on the value of the client base of the company throughout the course of time. The authors claim that this model provides a way to assess the accuracy of various qualitative results on customer relationship marketing that are often made. According to this approach, a company’s customer equity model is determined by the following:
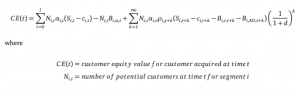
The model states that the customer equity is equivalent to the profit made by acquiring new customers or the profit made from first-time customers minus the cost of acquisition, plus the profit made from future sales to these customers divided by the discount rate, with the total for all of the segments being added up.
3.6 Econometric Models
The term “Econometric Models” refers to a class of models or a collection of models that adhere to the same fundamental principles as Probabilistic Models like Pareto/NBD. In these models, the components that make up CLV, such as customer acquisition, customer retention, profit margin, and customer growth, are modelled and investigated individually or in combination with one or more of the aforementioned components.
Some of these models are:
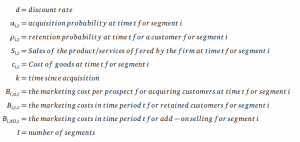
3.6.1 Customer Acquisition
Customer Acquisition is the process of regaining either a former client or a new customer or a former
client. The logit and probit models are often used in the estimation of customer acquisition. The model
is going to be presented as
where Zjt refers to customer j at time t, Xjt are the covariates and αj are consumer specific response parameters. εjt are the error term, depending on which it will be decided whether the model is logit or probit.
3.6.2 Customer Retention
The term “customer retention” refers to the likelihood of an existing client making more purchases from the same company in the future. In contractual relationships, such as those between a customer and a TeleCom company or magazine publisher, the customer notifies the company before halting the relationship with the company; consequently, the company is already aware of the retention parameters. On the other hand, in non-contractual relationships, such as those between a company and an online retail store, the company must predict whether or not a customer has churned. It has been shown via studies and models that client acquisition and customer retention are not two very independent processes. Rather, there is a strong correlation between the two processes, which has proven to be profitable for businesses when it is modelled. Also, surveys have discovered that substantial price cuts,
which have proved to be quite advantageous in the process of attracting new consumers, do not seem to be particularly effective for pre-existing clients. This is connected to the level of satisfaction that the customers experience; initially, during the acquisition process, they received the same product at a lower price; however, later on, after the acquisition discount was removed, the price went up, and the customer experienced a price hike; as a result, the customer might not wish to continue with the service. We have already seen customer retention model is one of our previous sections, so we will skip that here and move to the next section.
3.6.3 Customer Margin and Expansion
The margin created by each client throughout the time period t is another component of customer lifetime value. The profit that is earned is dependent not only on the purchasing behaviour of the firm’s customers but also on the efficiency with which the company engages in up-selling and cross-selling its products, that is the selling behaviour of the company. Two different methods may be used to simulate customer margin in a general sense. The first strategy models the margin in a direct manner, while the second technique models cross-selling in order to comprehend the margin. In the process of modelling the customer margin, one of the most frequent assumptions that have been made is that the margin would be constant over time. This is something that we have already seen in several of the models that have been presented above. On the other hand, Venkatesh and Kumar came
up with a model for calculating the margin that was based on linear regression which does not make this assumption, rather tends to find out how margin is changing over time. The model is presented as follows:
∆CMj t = βXjt + εjt
where ∆CMj t is the change in margin for customer j at time t, αj is customer specific response parameters, εjt is the error term and Xjt is the covariate.
These models use advanced statistical and machine learning techniques — often implemented by firms specializing in AI consulting — to predict future customer behavior, retention likelihood, and revenue generation.
4 Limitation of CLV Models
All of the models that have been suggested for determining CLV have some shortcomings. These constraints come in the form of limits on the quantity of cash flow from a client, the timing of cash flow, the sort of company to which the model is relevant, the type of data that is required, and so on and so forth. The scope of research in CLV modeling has been narrowed down to a few distinct variants of the fundamental model, the Pareto/NBD model, and the Markov chain model. Their application is severely restricted due to the restrictive assumptions made, the complexities involved, and the limited applicability. When estimating CLV, practitioners often rely on models that are quite fundamental. It is difficult to find empirical validation for many CLV models. There is a need for research on estimating systems that may produce estimates that are reliable, consistent, and objective.
Most CLV models do not contain demographics and product consumption factors. There is a need for research to enhance such models so that they can include such factors. There is a need for more research to build new models for various product categories or to alter current models so that they may be used for other product categories. The currently available CLV models do not take into account the purchasing decision made by the customer. It is possible to incorporate into CLV models factors such as those that drive consumers to make purchases, the effect of marketing activities on consumers, and factors that influence consumers to purchase products from the same company on multiple occasions, such as switching costs and the influence of marketing.
There are hardly any studies that combine the concepts of client acquisition and customer retention into a single model. Because the cost of client acquisition plays a significant role in calculating the net profit that may be made from a single customer, it is preferable to use models that take into account both customer acquisition and customer retention. There is a need for more study on such models.
In order to correctly anticipate CLV based on consumption patterns in the past and estimations of CLV
from the past, further study is required.
5 Using Machine Learning to predict Customer Lifetime Value
5.1 Approaches for modeling CLV
There are two broad approaches for modelling Customer Lifetime Value:
A) Historical Approach: In order to calculate the Customer Lifetime Value, this framework takes use of data from the past. The primary objective of this framework is to determine the Customer Value for the time period during which the customer has previously been in a connection with the organisation. These models were all based on the same fundamental idea, which is
Historical CLV = (Sum o f all transaction) × (Average gross margin)
Such models which uses historical approach can be categorised in following two categories:
1. Aggregate Model: Computing the CLV by making use of the typical revenue generated by each client based on previous purchases. We only get one value back for the CLV when we use this approach.
2. Cohort Model: Dividing the consumers into distinct cohorts according to the date of their most recent transaction, for example, and determining the average revenue generated by each cohort. The CLV value may be obtained for each cohort using this procedure. Now we will take a look at predictive CLV, which is an algorithmic method that analyses a customer’s transaction history and behavioural patterns to calculate the customer’s present value and anticipate how the customer’s value will change over the course of time. This value grows more accurate over time and is a superior technique for calculating customer lifetime value (CLV) when a customer makes
more purchases and interacts with a business.
B) Predictive Approach: It is an algorithmic method that analyses a customer’s transaction history and behavioural patterns to calculate the customer’s present value and anticipate how the customer’s value will change over the course of time. This value grows more accurate over time and is a superior technique for calculating customer lifetime value (CLV) when a customer makes more purchases and interacts with a business. There are five steps in calculation of Predictive CLV, which are:
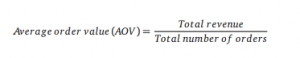
Step 1: Calculating Average Order Value
It is the revenue generated by an average customer. For calculating Average order value, firstly take a time period which is good representation of customer purchase behavior, something like 1 year or 2 year.
Step 2: Calculating Average Purchase Frequency
It is the representation of the frequency with which the customer makes purchases from a business. A
customer with high frequency will be termed as loyal customer
![]()
Step 3: Calculating Customer Value
Customer value represents how much revenue(or profit) is generated by an average customer in the
given time period.
Customer value (CV) = Average order value × Average purchase frequency
Step 4: Calculating Average Customer Lifespan
Customer’s Lifespan is the duration between the customer’s first purchase and the last purchase, before
ending their relationship with the firm.
![]()
Average Customer Lifespan can also be given as 1/(Churn Rate)
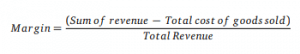
Step 5: Calculating Customer Lifetime Value
As we have already seen earlier, customer lifetime value is given as Customer life time value
(CLV) = Customer value × Average customer lifespan × Margin
all of which we have calculated earlier and Margin is given as
Predictive Models can also be categorised into set of models:
1. Probabilistic Model: Makes an estimate of the future count of transactions as well as the monetary value associated with each transaction by attempting to fit the data into a probability distribution.
2. Machine Learning Model: Using Machine Learning techniques such as regression, clustering, etc on past data to predict CLV for upcoming future.
5.2 Modeling Machine Learning Algorithm
5.2.1 Dataset
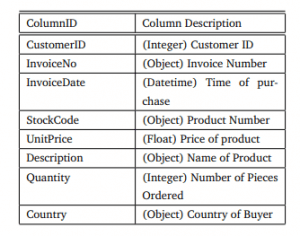
For using any sort of machine learning or analysis, firstly we need a proper dataset. Some of the must required quantities in the dataset would be InvoiceID, CustomerID, ProductID, Quantity, Amount, InvoiceDate. Other than that, columns such as Order Address, Buyer’s descriptions, etc can also be helpful if performing demographic analysis.
For example a open-source retail dataset containing all transactions occurring during a year for a
UK-based and registered non-store online retail looks like
5.2.2 Data-Preprocessing
Next Important and must step is Data-Preprocessing., where the data set is cleaned and altered in order to make it useful for the purpose. It involves reducing noise and redundancy. Some of the important processes in this step would be 1. Add checks and balances to verify the data points and remove the data points with inconsistent information. 2. Removing Noise 4. Converting Datatypes.
5.2.3 Feature Selection and Feature Engineering
Feature selection is very important for reducing the computation power and time, and improving model efficiency. In our dataset there might be some features which are of no use to us but including them in our model, unnecessarily increases the load on the model and slows it down. Similarly, there might be some latent features in the data that are not visible, or are rather a combination of more than on features of the dataset of an alteration of a feature, such features can be incorporated into our dataset using feature enginnering. Both feature selection and feature engineering involves understanding the correlation of the features in the dataset with other features in the dataset and the result.
5.2.4 Customer Segmentation
To efficiently and responsibly advertise to each group, customer segmentation separates consumers into segments or groups based on their shared characteristics. Additionally, it helps in raising the retention rate, which in turn aids in raising the Customer Lifetime Value. Calculating RFM, or recency, frequency, and monetary value, is one of the most helpful segmentation approaches. The customer base can be divided into several groups or segments based on the revenue generated as well. This will allow us to understand each group separately and the effect of different parameters on each group separately.
5.2.5 Modeling CLV
This is most crucial step which involves finding and training a suitable model for Customer Lifetime Value. As it might seem that all the values are numerical in the calculation of CLV such as Average Order Value, Average Purchase Frequency, Average Customer Lifespan, a regression model might suit our need. Given the dataset for past year or two year or so, we can apply a regression model to predict all of these features independently and then use them to calculate CLV, or rather combine them in form of some suitable model and then apply regression model. One important thing to keep in mind is while using a predictive model, it’s better to keep individual traits in the dataset, that is while using a combination of feature, it should always be seen that if that particular customer is going to make a purchase in the next period or not, if only they are going to be involved with the business, their values are to be added in the CLV.
Regression was just an example, there are several other models possible such as XGBoost, LGBM, Gradient Boosting, etc. It’s always a good practice to split our dataset into training set and testing set, and then training our model only on training set, and testing it on test set. Sometime, a crossvalidation set may also be put to use to further improve the model statistics. Also, if not sure about which model would fit betters, is good practice to test various models and compare their results. The train-test size can also be altered to improve our model’s performance.
5.2.6 Model Performance and Evaluation
After modeling CLV, it’s better to check, how well our model(s) have performed. This involves, testing
our model on test set and look at various evaluation metrics such accuracy, f1-score, recall, r2
value, etc. It is obviously not possible to check if the CLV calculated for future time-period is correct or not, but we might train our model for some past time, leave a past time period, such as 6 month os so, and then see how well our model predicts the CLV for this 6 months, this can also be a measure for the model performance.
For a detailed paper on machine learning modelling of CLV, please check this paper.
References
[1] D.Jain and S.S. Singh, “Customer lifetime value research in marketing: A review and future directions,” Journal of interactive marketing, vol.16, no.2, pp.34–46, 2002.
[2] S.Sharma, “Customer lifetime value modelling,” 2021.
[3] M.Calciu, “Deterministic and stochastic customer lifetime value models. evaluating the impact of ignored heterogeneity in non-contractual contexts,” Journal of Targeting, Measurement and Analysis for Marketing, vol.17, no.4, pp.257–271, 2009.
[4] S.Gupta, D.Hanssens, B.Hardie, W.Kahn, V.Kumar, and N.Lin, “& ravishanker, n.(2006),” Modeling customer lifetime value. Journal of Service Research, vol.9, pp.139–155.
[5] P.D. Berger and N.I. Nasr, “Customer lifetime value: Marketing models and applications,” Journal of interactive marketing, vol.12, no.1, pp.17–30, 1998.
[6] W.J. Reinartz and V.Kumar, “On the profitability of long-life customers in a noncontractual setting:
An empirical investigation and implications for marketing,” Journal of marketing, vol.64, no.4, pp.17–35, 2000.
[7] R.C. Blattberg and J.S. Thomas, “Dynamic pricing strategies to maximize customer equity,” Unpublished manuscript, Northwestern University, Evanston, IL, 1997.
[8] D.C. Schmittlein, D.G. Morrison, and R.Colombo, “Counting your customers: Who-are they and
what will they do next?,” Management science, vol.33, no.1, pp.1–24, 1987.
[9] J.S. Thomas, R.C. Blattberg, and E.J. Fox, “Recapturing lost customers,” in Perspectives On Promotion And Database Marketing: The Collected Works of Robert C Blattberg, pp.229–243, World
Scientific, 2010.
[10] P.Jasek, L.Vrana, L.Sperkova, Z.Smutny, and M.Kobulsky, “Modeling and application of customer lifetime value in online retail,” in Informatics, vol.5, p.2, MDPI, 2018
11] S.Chen, “Estimating customer lifetime value using machine learning techniques,” in Data mining,
vol.17, 2018.
Looking to do more with your data? Check out our other services : Power BI Consulting | Power BI Expert | Power BI Consultant | Tableau Consultants | Tableau Consulting | Tableau Expert | Tableau Contractor | Tableau Freelance Developer | Tableau Developer