by Bramarambika B | Jul 9, 2026 | Spreadsheet Modelling
Introduction Most of the organizations have already invested heavily in an ERP system that consists of multiple modules such as finance that records every transaction, a procurement that manages suppliers, some operations that track inventory and a sales team that...
by Bramarambika B | Jul 8, 2026 | Spreadsheet Modelling
As firms pursue faster-paced digital transformation efforts, it is found that the biggest hurdle for them is not about data collection but rather data understanding, governance, and trust. The issue here is that data may be residing in the cloud platforms, data...
by Bramarambika B | Jul 8, 2026 | Spreadsheet Modelling
The need for faster forecasting, improved planning, better working capital management, and operational transparency in the mid-market business world is increasing rapidly. Despite that, most CFOs, FP&A professionals, and operations departments are using a...
by Bramarambika B | Jul 8, 2026 | Spreadsheet Modelling
Data integration is now one of the most critical underpinnings of today’s business processes. Financial departments need integrated data to forecast, supply chain managers need real-time visibility across networks, marketing departments require unified...
by AnshumanD | Mar 29, 2026 | Spreadsheet Modelling
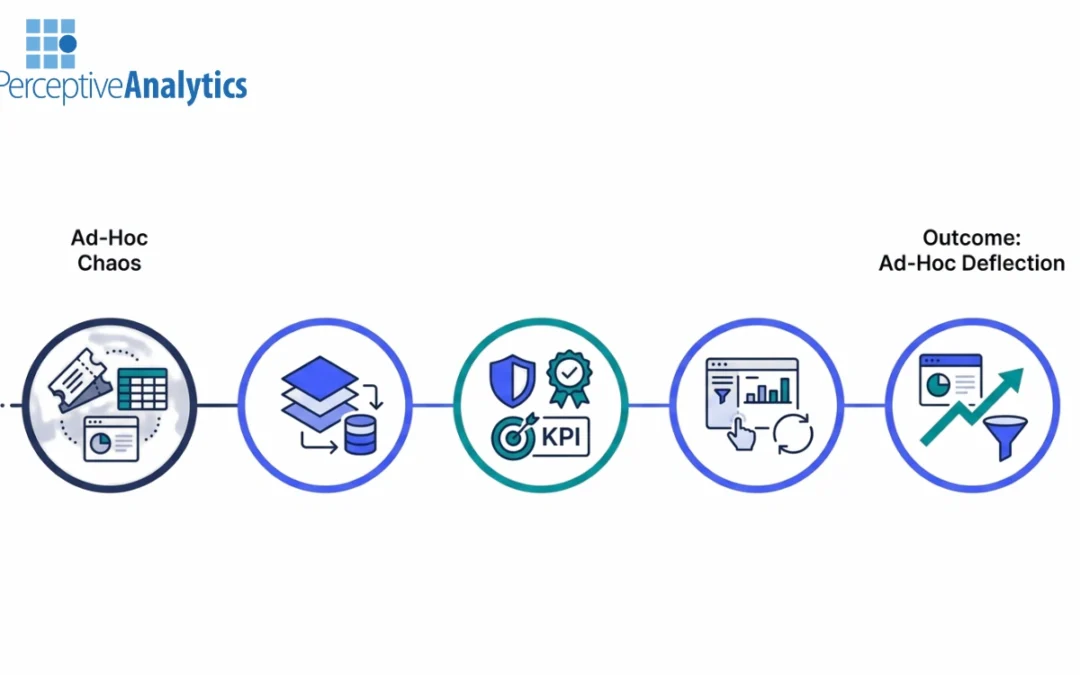
Ad-hoc reporting is where most analytics teams quietly lose control. Requests pile up, SLAs slip, and analysts spend more time answering repetitive questions than driving insights.The promise of tools like Looker is self-service—but without the right design and...
by AnshumanD | Jan 19, 2026 | Spreadsheet Modelling
Download this guide as a PDF Please enable JavaScript in your browser to complete this form.Please enable JavaScript in your browser to complete this form.Name *FirstLast Name Email Email...
Recent Comments