by admin | May 13, 2022 | Tableau Authority
In this article, we will show you how to speed up the loading of your Tableau workbook when you are dealing with a huge dataset. The Workbook Loaded in 5 Minutes and 19 Seconds We were dealing with a dataset that has 27 million rows. This dataset has information about...

by admin | Apr 4, 2022 | Tableau Authority
Executive Introduction String calculations are powerful, but on big datasets they’re expensive. When Tableau does millions of string ops at query time, even simple views can crawl. The good news: you can shift that work out of the user’s waiting time and make vizzes...
by admin | Mar 24, 2022 | Tableau Authority
A great business dashboard combines high performance and ease of use. In this article, we will show you how to efficiently create groups in Tableau. You can also look this video to see how we did it! We Created Groups with Native Feature (28 Mn Rows) It was a movie...
by admin | Jan 19, 2021 | Analytics, Case-studies
London cholera outbreak slides London cholera outbreak viz Tableau workbook Data prep python code For complex geographic or historical visualizations like this, many analysts collaborate with Tableau Consultants to ensure calculations, layers, and data connections are...
by admin | Oct 11, 2018 | Analytics, Resources, Tableau Authority
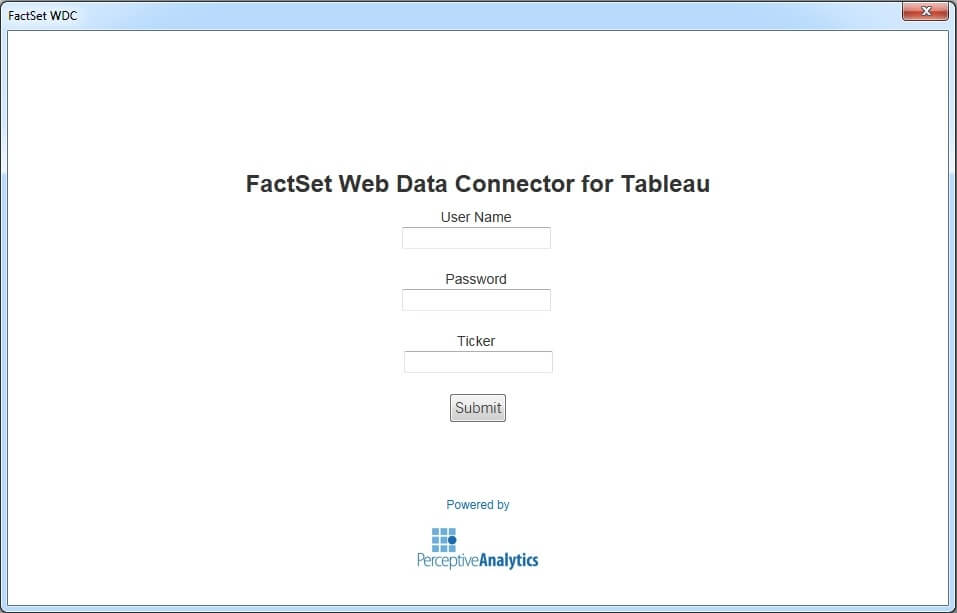
The project was to create Tableau Dashboards for visualizing financial information of different stocks/tickers that would be used by Financial Analysts. The data had to be obtained through an Application Programming Interface (API) of a third-party service provider...
by Saneesh V | Aug 30, 2018 | Analytics, Tableau Authority, Visualization
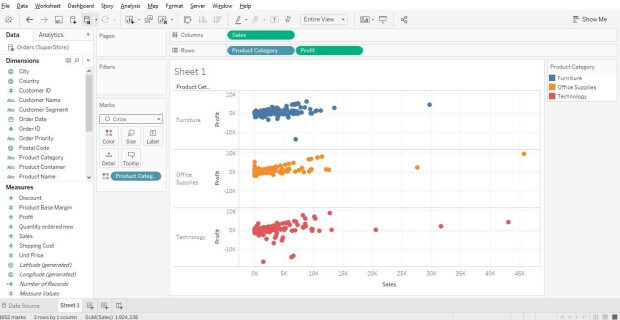
Statistics in Tableau Data in the right hands can be extremely powerful and can be a key element in decision making. American statistician, W. Edwards Deming quoted that, “In God we trust. Everyone else, bring data”. We can employ statistical measures to analyze data...
Recent Comments