Did you know that Netflix has over 76,000 genres to categorize its movie and tv show database? I am sure this must be as shocking to you as this was to me when I read about it first. Genres, rather micro-genres, could be as granular as “Asian_English_Mother-Son-Love_1980.” This is the level of granularity to which Netflix has segmented its product offerings, which is movies and shows.
But do you think is it necessary to go to this level to segment the offerings?
I think the success of Netflix answers this question on its own. Netflix is considered to have one of the best recommendation engines. They even hosted a competition on Kaggle and offered a prize money of USD 1 million to the team beating their recommendation algorithm. This shows the sophistication and advanced capabilities developed by the company on its platform. This recommendation tool is nothing but a segmentation exercise to map the movies and users. Sounds easy, right?
Gone are the days when marketers used to identify their target customers based on their intuition and gut feelings. With the advent of big data tools and technologies, marketers are relying more and more on analytics software to identify the right customer with minimal spend. This is where segmentation comes into play and makes our lives easier. So, let’s first understand what is segmentation? and why do we need segmentation?
Segmentation, in very simple terms, is grouping of customers in such a way that that customers falling into one segment have similar traits and attributes. The attributes could be in terms of their likings, preference, demographic features or socio-economic behavior. Segmentation is mainly talked with respect to customers, but it can refer to products as well. We will explore few examples as we move ahead in the article.
With tighter marketing budgets, increasing consumer awareness, rising competition, easy availability of alternatives and substitutes, it is imperative to use marketing budgets to prudently to target the right customers, through the right channel, at the right time and offer them the right set of products. Let’s look at an example and understand why segmentation is important for marketers.
There is an e-commerce company which is launching a new service for a specific segment of customers who shop frequently and whose ticket size is also high. For this, the company wants to see which all customers to target for the service. Let’s first look at the data at an aggregate level and then further drill down to understand in detail. There are 5 customers for whom we want to evaluate the spend. The overall scenario is as follows:

Should the e-commerce company offer the service to all the five customers?
Who is the right customer to target for this service? Or which is the right customer segment to target?
We will see the details of each of the customers and see the distribution of data.

Looking at the data above, it looks like Customer 1 and Customer 2 would be the right target customers for company’s offering. If we were to segment these 5 customers into two segments, then Customer 1 and Customer 2 would fall in one segment because they have higher total spend and higher number of purchases than the other three customers. We can use Tableau to create clusters and verify our hypothesis. Using Tableau to create customer segments, the output would look like as below.
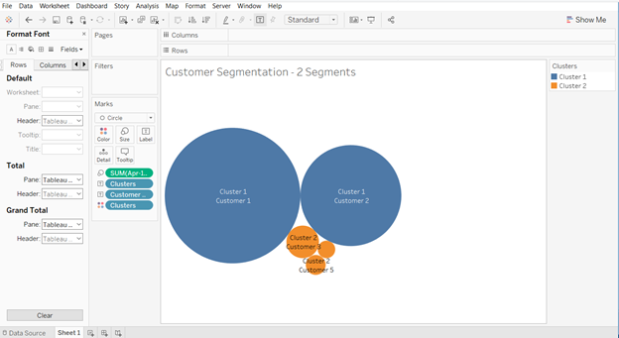
Customer 1 and customer 2 are part of cluster 1; while customer 3, customer 4 and customer 5 are part of cluster 2. So, the ecommerce company should focus on all the customers falling into cluster 1 for its service offering.
Let’s take another example and understand the concept further.
We will try to segment the countries in the world by their inbound tourism industry (using the sample dataset available in Tableau). Creating four segments we get the following output:
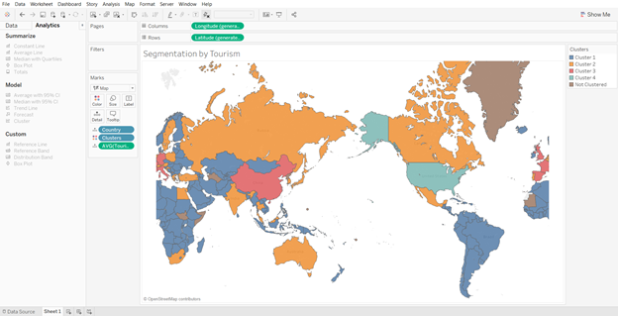
There are few countries which do not fall into any of the clusters because data for those countries is not available. Looking at clusters closely, we see that the United States of America falls in the cluster 4; while India, Russia, Canada, Australia, among others fall in the cluster 2. Countries in the Africa and South America fall in the cluster 1; while the remaining countries fall in the cluster 3. Thus, it makes it easier for us to segment countries based on certain macro-economic (or other) parameters and develop a similar strategy for countries in the same cluster.
Now, let’s go a step further and understand how Tableau can help us in segmentation.
Segmentation and Clustering in Tableau
Tableau is one of the most advanced visualization and business intelligence tool available in the market today. It provides a lot of interactive and user-friendly visualizations and can handle large amounts of data. It can handle millions of rows at once and provides connection support to almost all the major databases in the market.
With the launch of Tableau 10 in 2016, the company offered a new feature of clustering. Clustering was once considered a technique to be used only by statisticians and advanced data scientists, but with this new feature in Tableau it becomes as easy as simple drag and drop. This feature can provide a big support to marketers in segmenting their customers and products, and get better insights.
Steps to Becoming a Segmentation Sniper
Large number of sales channels, increase in product options and rise in advertisement cost has made it inevitable not only for marketers but for almost all the departments to analyze customer data and understand their behavior to maintain market position. We will now take a small example and analyze the data using Tableau to understand our customer base and zero-in on the target customer segment.
There is a market research done by a publishing company which is mainly into selling of business books. They want to further expand their product offerings to philosophy books, marketing, fiction and biographies. Their objective is to use customer responses and find out which age group like which category of books the most.
For an effective segmentation exercise, one should follow the below four steps.
- Understand the objective
- Identify the right data sources
- Creating segments and micro-segments
- Reiterate and refine
We will now understand each of the steps and use Tableau, along with, to see the findings at every step.
- Understand the objective
Understanding the objective is the most important thing that you should do before starting the segmentation exercise. Having a clear objective is the most imperative thing because it will help you channelize your efforts towards the objective and prevent you from just spending endless hours in plain slicing and dicing. In our publishing company example, the objective is to find out the target age group which the company should focus on in each of the segments, namely philosophy, marketing, fiction and biography. This will help the publishing company in targeting its marketing campaign to specific set of customers for each of the genres. Also, it will help the company in identifying the target age group that like both business and philosophy or business and marketing, or similar other groups.
- Identify the right data sources
In this digital age, data is spread across multiple platforms. Not using the right data sources could prove to be as disastrous as not using analytics at all. Customer data residing in CRM systems, operational data in SAP systems, demographic data, macro-economic data, financial data, social media footprint – there could be endless list of data sources which could prove to be useful in achieving our objective. Identifying right variables from each of the sources and then integrating them to form a data lake forms the basis of further analysis.
In our example, dataset is not as complex as it might be in real life scenarios. We are using a market survey data gathered by a publishing company. The data captures the age of customer and their liking/disliking for different genres of books, namely philosophy, marketing, fiction, business and biography.
- Creating segments and micro-segments
At this stage, we have our base data ready in the analyzable format. We will start analyzing data and try to form segments. Generally, you should start by exploring relationships in the data that you are already aware of. Once you establish few relationships among different variables, keep on adding different layers to make it more granular and specific.
We will start by doing some exploratory analysis and then move on to add further layers. Let’s first see the results of the market survey at an aggregate level.
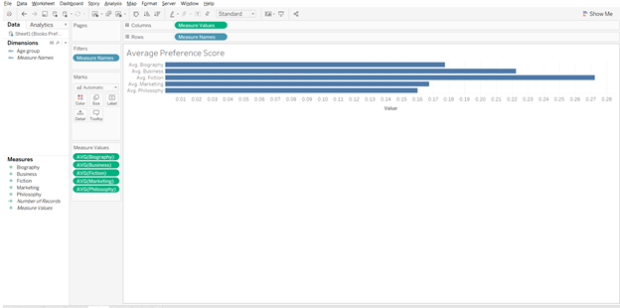
From the above analysis, it looks like fiction is the most preferred genre of books among the respondents. But before making any conclusions, let’s explore a little further and move closer to our objective.
If we split the results by age group and then analyze, results will look something like the below graph.
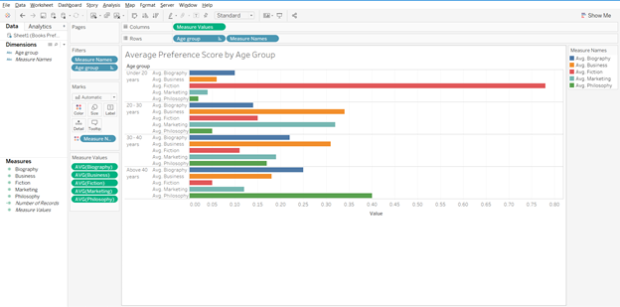
In the above graph, we get further clarity on the genre preferences by respondents. It gives us a good idea as to which age group prefers which genre. Fiction is most preferred by people under the age of 20; while for other age groups fiction is not among the top preference. If we had only taken the average score and went ahead with that, we would have got skewed results. Philosophy is preferred by people above the age of 40; while others prefer business books.
Now moving a step ahead, for each of the genre we want to find out the target age group.
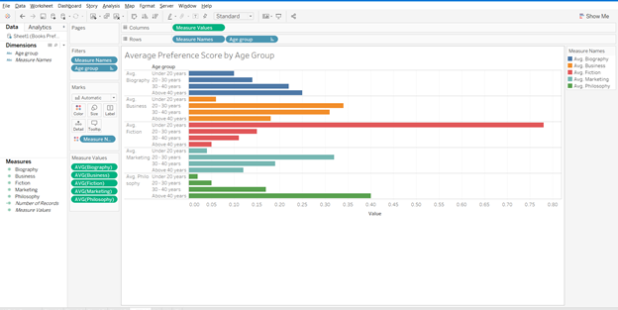
The above graph gives us the target group for each of the genres. For biography and philosophy genres, people above the age of 40 are the right customers; while for business and marketing, age group 20-30 years should be the target segment. For fiction, customers under the age of 20 are the right target group.
Reiterate and refine
In the previous section, we created different customer segments and identified the target segment for publishing company. Now, let’s say we need to move one more step ahead and identify only those age groups and genres which have overlap with business genres. To put it the other way, if the publishing company was to target only one new genre (remember, they already have customer base for business books) and one age group, which one should it be?
Using Tableau to develop a relation amongst the different variables, our chart should look like the one below.
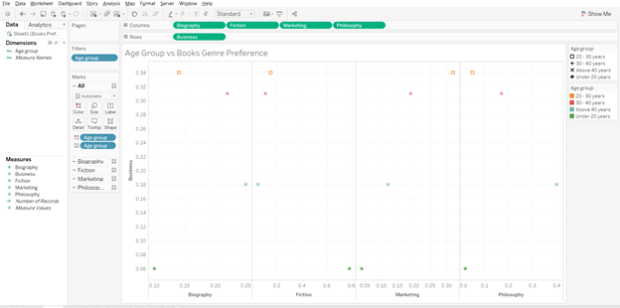
Starting with the biography genre, age group 30-40 years comes closest to our objective, i.e., people in this age group like both biography and business genre (Biography score – 0.22, Business score – 0.31). Since, we have to find only one genre we will further explore the relationships.
For fiction, there is no clear overall with any of the age groups. For marketing, age group 20-30 year looks to be clear winner. The scores for the groups are – marketing – 0.32, business – 0.34. The relation between philosophy and business is not as strong as it is for business and marketing.
To sum it up, if the publishing company was to launch one more genre of books then it should be marketing and target customer group should be in the range of 20-30 years.
Such analysis can be refined further depending on the data we have. We can add gender, location, educational degree, etc. to the analysis and further refine our target segment to make our marketing efforts more focused.
I think after going through the examples in the article, you can truly appreciate the level of segmentation that Netflix has done and it clearly reflects the reason behind its success.
