by Saneesh V | Aug 22, 2018 | Analytics, R
Working in machine learning field is not only about building different classification or clustering models. It’s more about feeding the right set of features into the training models. This process of feeding the right set of features into the model mainly take place...
by Saneesh V | Aug 21, 2018 | Analytics, R
Reinforcement Learning with R Machine learning algorithms were mainly divided into three main categories. Supervised learning algorithms Classification and regression algorithms Unsupervised learning algorithms Clustering algorithms Reinforcement learning algorithms...
by Saneesh V | Aug 20, 2018 | Analytics, R
In the past one decade, there has been an exponential surge in the online activity of people across the globe. The volume of posts that are made on the web every second runs into millions. To add to this, the rise of social media platforms has led to flooding to...
by Saneesh V | Aug 19, 2018 | Analytics, R
Categorical data is a kind of data which has a predefined set of values. Taking “Child”, “Adult” or “Senior” instead of keeping the age of a person to be a number is one such example of using age as categorical. However, before using categorical data, one must know...
by Saneesh V | Aug 18, 2018 | Analytics, R
Linear regression is a basic tool. It works on the assumption that there exists a linear relationship between the dependent and independent variable, also known as the explanatory variables and output. However, not all problems have such a linear relationship. In...
by Saneesh V | Aug 16, 2018 | Analytics, R
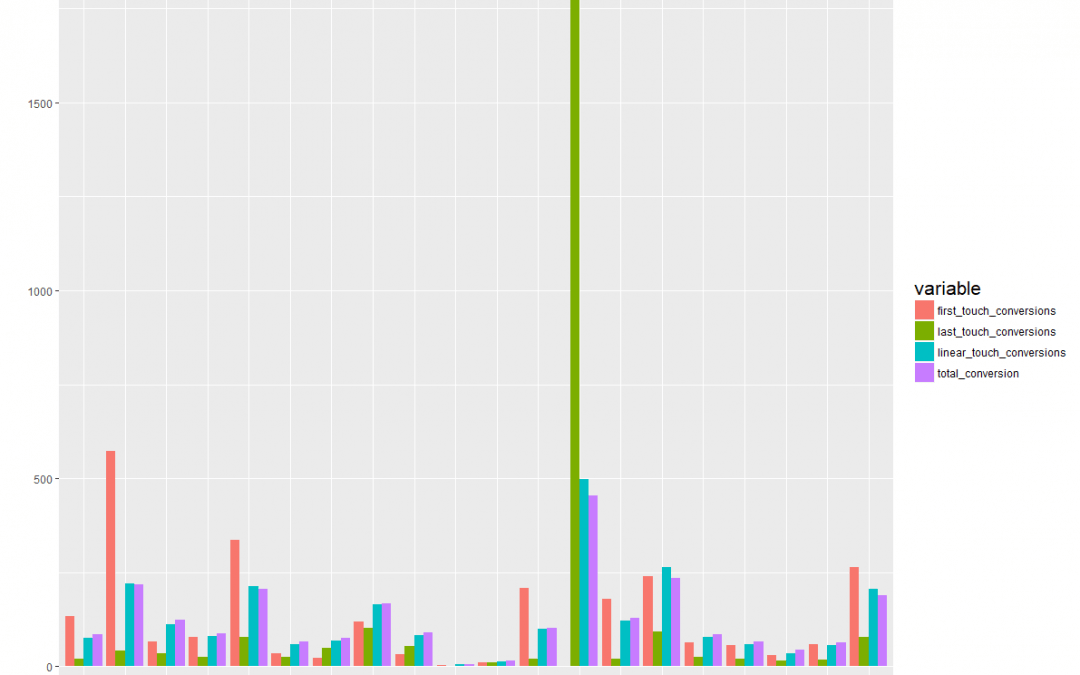
Introduction In a typical ‘from think to buy’ customer journey, a customer goes through multiple touch points before zeroing in on the final product to buy. This is even more prominent in the case of e-commerce sales. It is relatively easier to track which are the...

Recent Comments