by Saneesh V | Aug 14, 2018 | Analytics, R
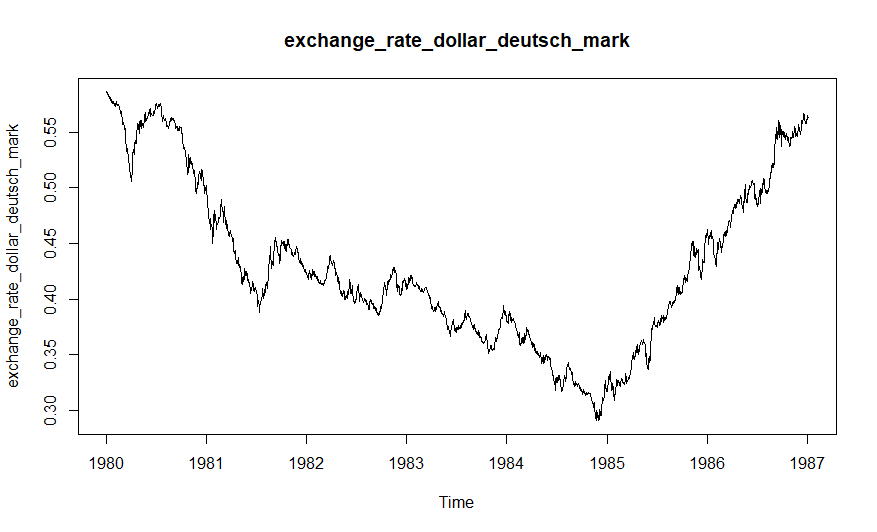
To go into the turbulent seas of volatile data and analyze it in a time changing setting, ARCH models were developed. Marching towards the ARCH and GARCH When techniques like linear regression or time series were aimed at modelling the general trend exhibited by a set...
by Saneesh V | Aug 13, 2018 | Analytics, R
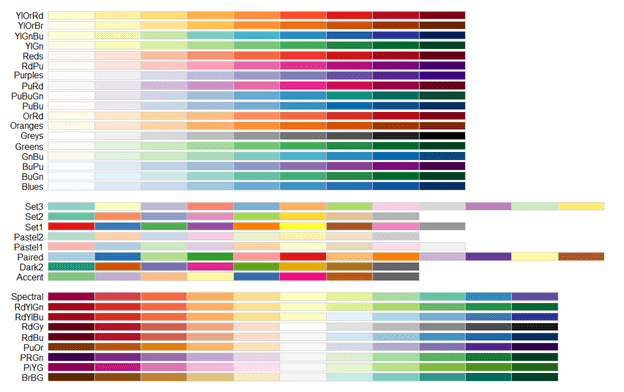
Choropleth maps provides a very simple and easy way to understand visualizations of a measurement across different geographical areas, be it states or countries. If you were to compare growth rate of Indian states and present it to a bunch of people who have 15-20...

by Saneesh V | Aug 12, 2018 | Analytics, R
If you are a data scientist who wants to capture data from such web pages then you wouldn’t want to be the one to open all these pages manually and scrape the web pages one by one. To push away the boundaries limiting data scientists from accessing such data from web...
by Saneesh V | Aug 11, 2018 | Analytics, R
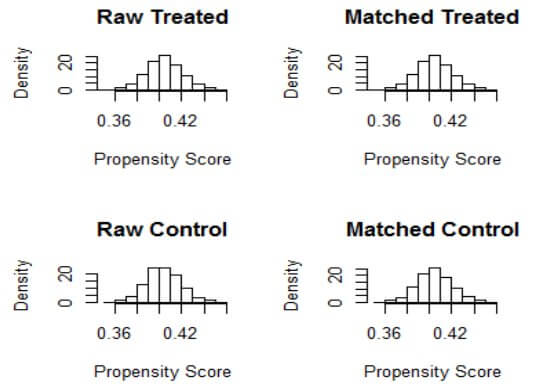
Propensity scores are an alternative method to estimate the effect of receiving treatment when random assignment of treatments to subjects is not feasible. The concept of Propensity score matching (PSM) was first introduced by Rosenbaum and Rubin (1983) in a paper...
by Saneesh V | Aug 10, 2018 | Analytics, R, Spreadsheet Modelling
Optimization is a technique for finding out the best possible solution for a given problem for all the possible solutions. Optimization uses a rigorous mathematical model to find out the most efficient solution to the given problem. What is optimization? Optimization...
Recent Comments