by sagarp4412@gmail.com | Sep 22, 2026 | AI, Power BI
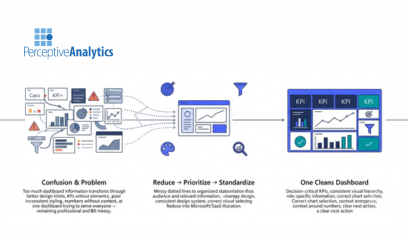
IntroductionA Power BI dashboard can contain all the right data and still be frustrating to use.Usually, the issue isn’t the data itself. It’s the presentation.A page with 20 visuals, six slicers, a map, several KPI cards, and a few tables may look...
by sagarp4412@gmail.com | Sep 22, 2026 | BI, Power BI
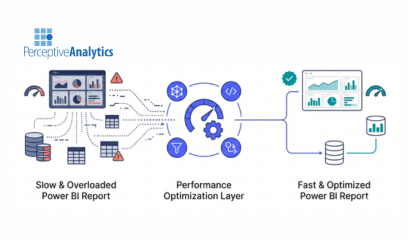
Why does Power BI performance get worse over time?Most slow reports don’t start out slow.A team builds a report with a few pages, a manageable dataset, and some straightforward measures. Then the report gets useful. More people start using it. New business...
by sagarp4412@gmail.com | Sep 22, 2026 | BI, Power BI
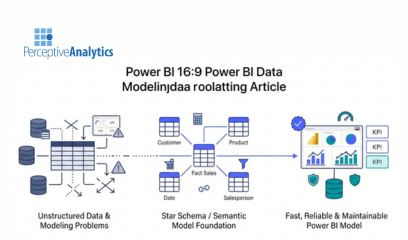
IntroductionA Power BI dashboard can look great and still be difficult to use.Maybe a simple filter takes several seconds to respond. Two pages show different revenue numbers. A developer has to write increasingly complicated DAX just to get a basic KPI to work.Those...
by sagarp4412@gmail.com | Sep 22, 2026 | BI
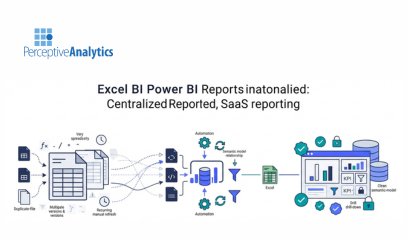
IntroductionExcel usually isn’t the problem when a reporting process starts getting messy.The problem is that the business has started asking Excel to do more than it was meant to do.A workbook that once handled a monthly sales report can gradually turn into a 15-tab...
by sagarp4412@gmail.com | Sep 21, 2026 | Analytics
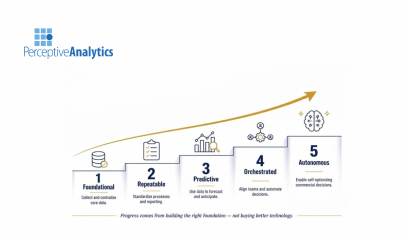
Pharma commercial analytics maturity runs across five levels: Foundational, Repeatable, Predictive, Orchestrated, and Autonomous. Progress does not come from buying better technology. It comes from building the specific foundation, identity, signal volume, or...

Recent Comments