Perceptive Analytics
  • About
    • About us
    • Our Team
  • Services
    • AI Consulting
    • Chatbot Consulting
    • PowerBI Consulting
    • Tableau Consulting
    • Snowflake Consulting
    • Talend Consulting
    • Looker Consulting
    • Marketing Analytics
  • Industries
    • Insurance
    • Business Consulting
    • Pharma
    • E-commerce
    • Retail
  • Our Work
  • Careers
  • Resources
    • Insurance Analytics 2026
    • Consulting Analytics 2026
    • Pharma Analytics 2026
  • Blog
  • CONTACT
Select Page
How to Choose the Right Tableau Services Partner for Enterprise Analytics

How to Choose the Right Tableau Services Partner for Enterprise Analytics

by AnshumanD | Feb 25, 2026 | Tableau

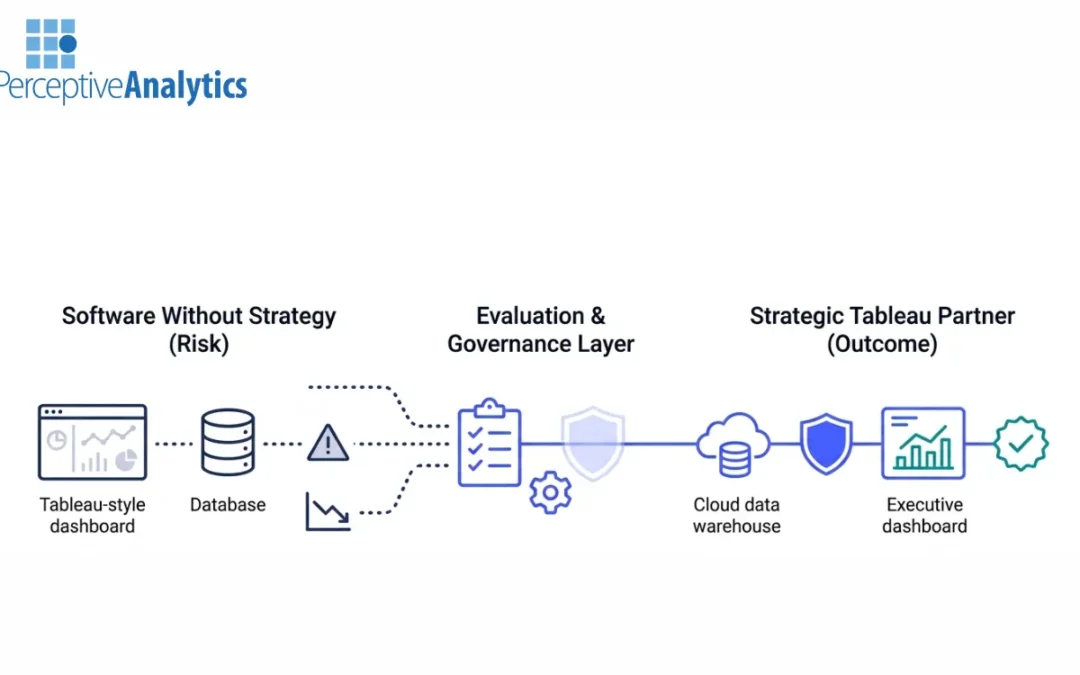
Purchasing a Tableau enterprise license is only the first step in becoming a data-driven organization. The reality for many enterprises is that without the right implementation and adoption strategy, powerful software quickly becomes a graveyard of unused dashboards....
How to Optimize Tableau Performance at Scale With Proven Results

How to Optimize Tableau Performance at Scale With Proven Results

by AnshumanD | Feb 22, 2026 | Tableau

When Tableau is used correctly, it becomes the foundation for executives for holistic decision-making. However, as the enterprise data continues to grow, the number of dashboards increases, and multiple users begin to use the system concurrently, the system...
How Perceptive Analytics Delivers Automated, Real-Time, and Scalable Tableau Dashboards

How Perceptive Analytics Delivers Automated, Real-Time, and Scalable Tableau Dashboards

by AnshumanD | Feb 20, 2026 | Tableau

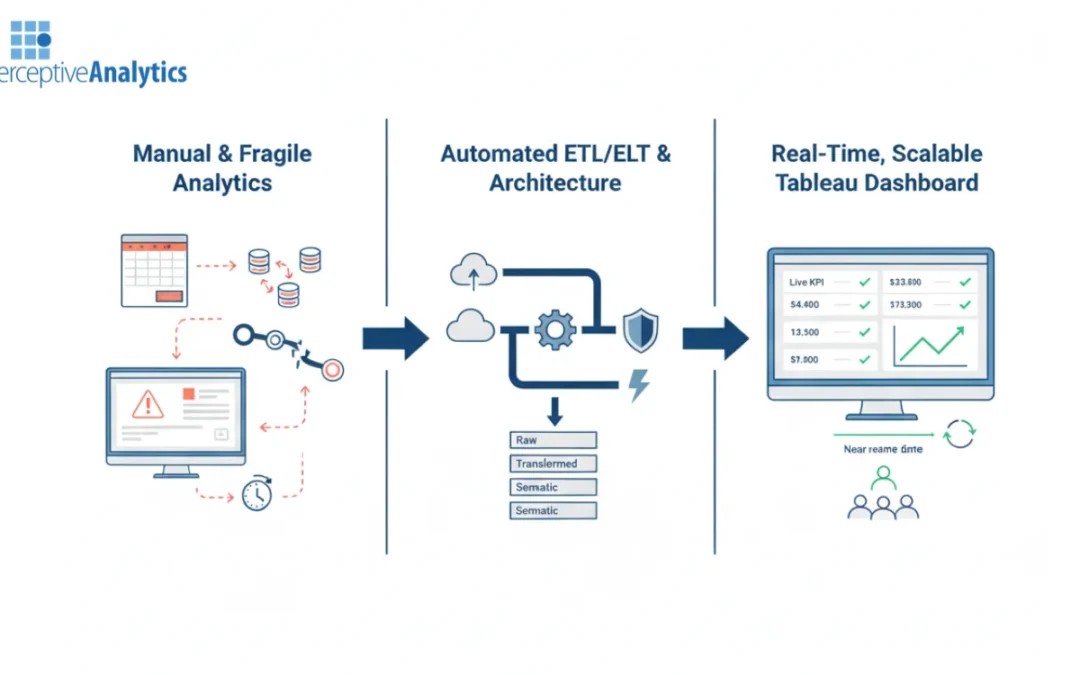
Enterprises rarely struggle with visualization tools. They struggle with unstable pipelines, delayed refresh cycles, brittle dashboard performance, and manual intervention across systems.Whether using Tableau, Power BI, or Looker, the pattern is consistent: dashboards...
Standardizing KPIs in Tableau for Modern Executive Dashboards

Standardizing KPIs in Tableau for Modern Executive Dashboards

by AnshumanD | Feb 19, 2026 | Tableau

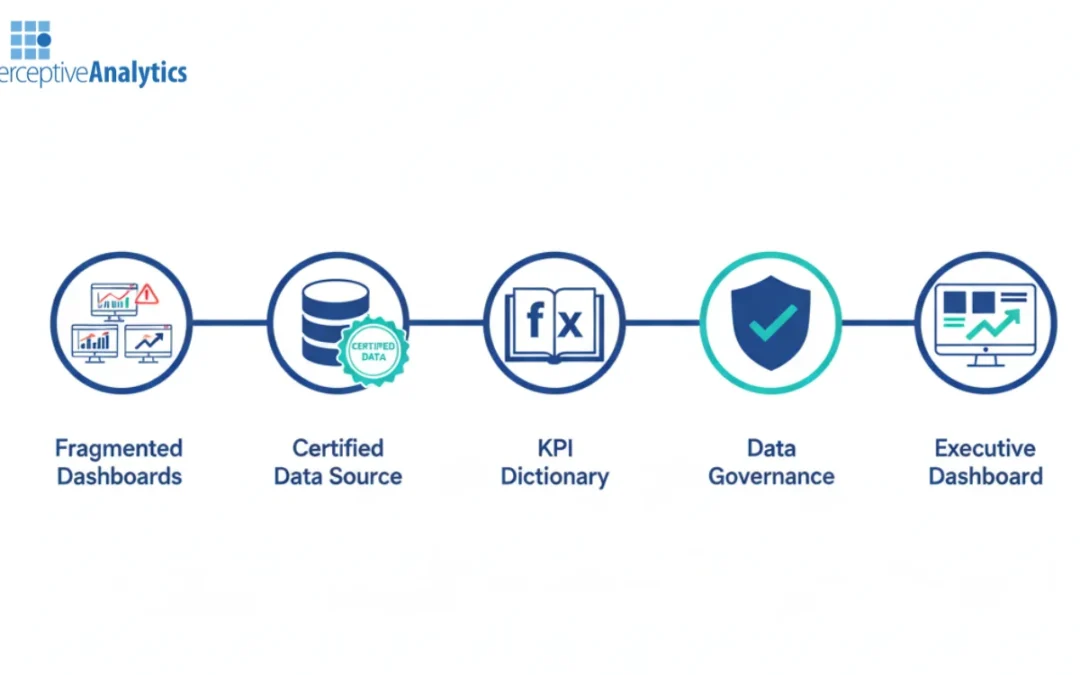
One of the quickest ways  executive trust in analytics breaks is when the same KPI shows the same numbers in several Tableau dashboards. This is a prevalent issue even in established Tableau environments. In this post, we’ll explain why KPI consistency is so...
Unified CXO Dashboards in Tableau: Finance, Ops, Revenue on One Screen

Unified CXO Dashboards in Tableau: Finance, Ops, Revenue on One Screen

by AnshumanD | Feb 19, 2026 | Tableau

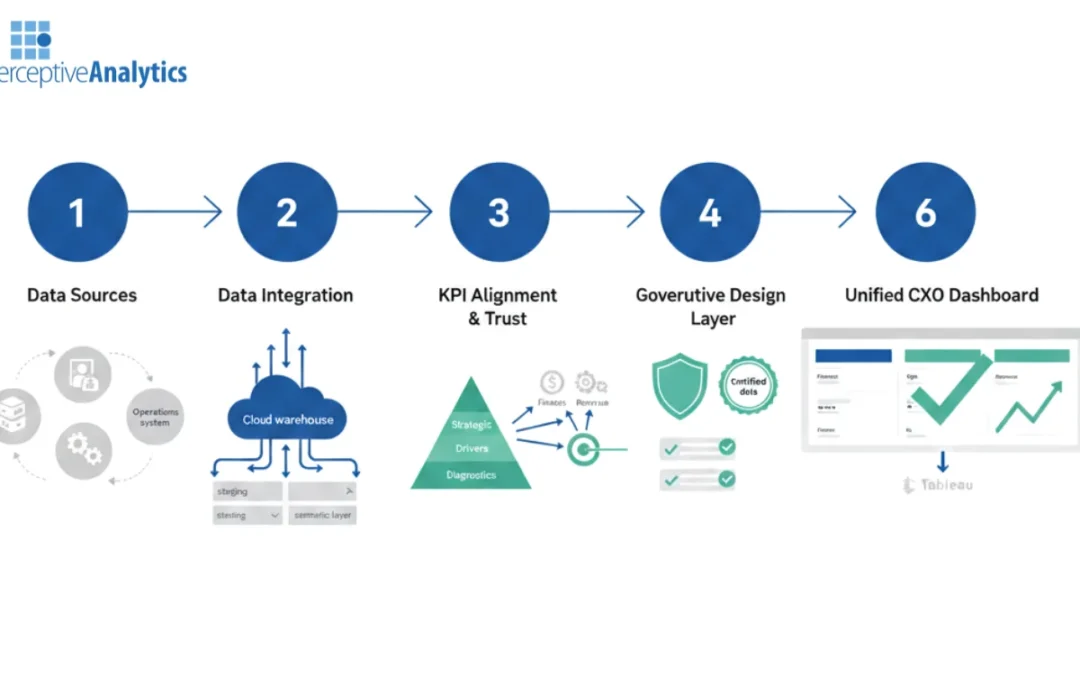
Unified CXO Dashboards in Tableau: Finance, Ops, Revenue on One Screen – Insights by Perceptive AnalyticsCXO’s and business leaders do not suffer from lack of data but lack of fragmented views. Information without sense is noise. When views are fragmented the...
Frameworks and KPIs That Make Executive Tableau Dashboards Actionable

Frameworks and KPIs That Make Executive Tableau Dashboards Actionable

by AnshumanD | Feb 19, 2026 | Tableau

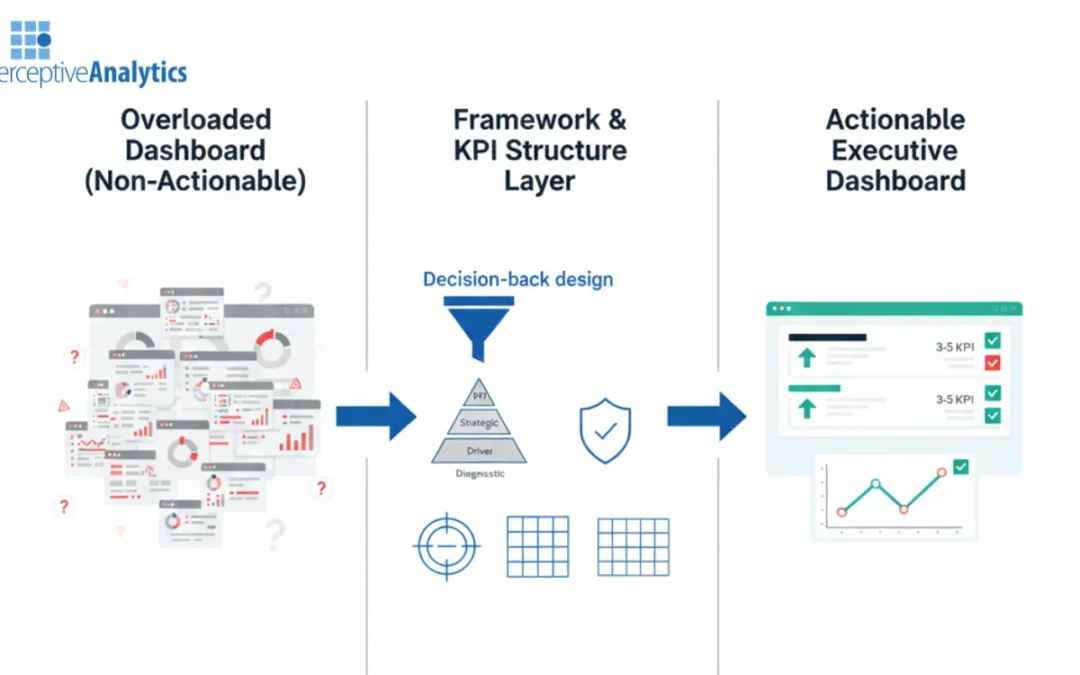
Executives do not require more charts. They require clarity, accountability, and action driven signals that provide them valuable insights for their business. The primary reason that many Tableau dashboards fail is not due to weak visuals or poor aesthetics but...
Page 3 of 5«12345»

Recent Posts

  • How to Choose Data Integration Software That Keeps KPIs Consistent
  • How to Evaluate Data Integration Platforms for Real-Time Finance and Operations Dashboards
  • How Modern Data Engineering Transforms Enterprise Analytics, BI, and Costs
  • How Looker Consulting Services Automate and Prioritize Ad-Hoc Reporting
  • How to Choose Looker Consulting Partners for Executive Dashboard Efficiency

Recent Comments

  • AnshumanD on Implementing Parallel Processing in R
  • AnshumanD on How AI Chatbots Increase Sales and Conversions for Businesses
  • Kristen S. Harrell on Analyzing Text Using Word Clouds
  • Sireesha on Marketing Analytics: How to Multiply Results from Search Marketing

Archives

  • March 2026
  • February 2026
  • January 2026
  • December 2025
  • November 2025
  • October 2025
  • September 2025
  • January 2025
  • December 2024
  • January 2024
  • July 2022
  • May 2022
  • April 2022
  • March 2022
  • January 2021
  • October 2018
  • August 2018
  • July 2018
  • October 2017
  • March 2017
  • January 2017
  • October 2016
  • May 2016
  • March 2016
  • January 2016
  • April 2015
  • March 2015
  • July 2014
  • October 2013
  • September 2013
  • August 2013
  • June 2013
  • November 2011
  • May 2011
  • April 2011

Categories

  • AI
  • Analytics
  • Articles
  • BI
  • Business Consulting
  • Business Model
  • Business Model
  • Case-studies
  • Chatbot
  • Comic
  • Comics
  • Data Engineering
  • Data Integration
  • Digital Transformation
  • Ecommerce
  • Financial Services
  • Insurance
  • List of Blogs
  • Looker
  • Marketing
  • Newsletter
  • OR Condition
  • Pharma
  • Power BI
  • R
  • Resources
  • Resources
  • Retail
  • Sales
  • Snowflake
  • Spreadsheet Modelling
  • Strategy
  • Supply Chain
  • Tableau
  • Tableau Authority
  • Uncategorized
  • Visualization
  • Wisdom

Meta

  • Log in
  • Entries feed
  • Comments feed
  • WordPress.org

About

  • About us
  • Our Team

Industries

  • E-commerce
  • Pharma
  • Retail
  • Our Work

Services

  • Marketing Analytics
  • Tableau Consulting
  • Data visualization design
  • Excel Consultants

Careers

  • Careers

Resource

  • Blog
  • Webinar
  • Tableau Resources

contact

hello@perceptive-analytics.com

646.583.0001

  • facebook
  • twitter
  • linkedin
  • insta
  • rss
Perceptive Analytics
  • Privacy Policy
  • Terms of Use
  • Cookies

© 2025 Perceptive Analytics