by AnshumanD | Jan 1, 2025 | AI
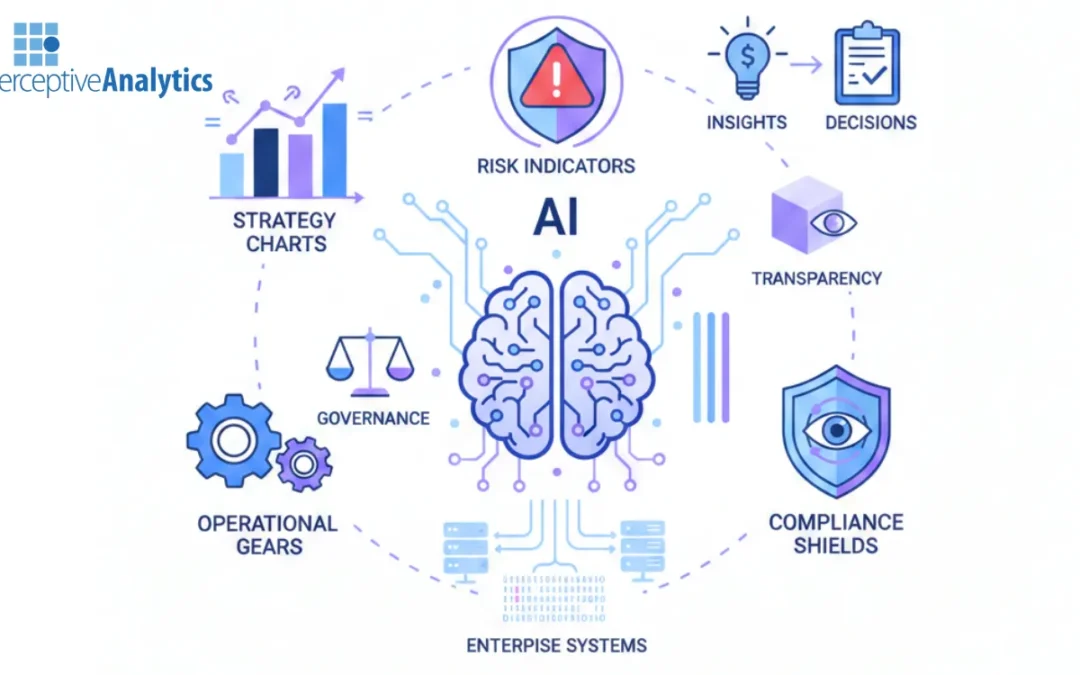
The Rise of AI in Business and Its Impact on Decision-Making Artificial Intelligence (AI) is transforming business operations across industries, from automating repetitive tasks to providing actionable insights that drive strategic decisions.Organizations leveraging...
by AnshumanD | Jan 1, 2025 | Resources
https://www.perceptive-analytics.com/wp-content/uploads/2025/09/TTF-GIF-V7.mp4 Power BI introduces Translytical Task Flows: Faster decisions for today’s CXOs Until now, if you wanted to make changes or trigger workflows from Power BI, you needed external apps like...
by AnshumanD | Jan 1, 2025 | Resources
Importance-of-ToolTip Dashboards with tooltips deliver clarity: Get answers on hover, no digging required Clear charts with deeper context instantly Focused insights that speed up decisions Examples in action: Churn KPI shows 8% → Tooltip flags spikes above average...
by AnshumanD | Jan 1, 2025 | Resources
Mobile-Dashboard-Guide 60% of dashboard consumption now happens on mobile. Designing dashboards for mobile isn’t just about shrinking visuals – it’s about rethinking the experience. This guide helps you – Spot the differences in how users consume and interact on...
by AnshumanD | Jan 1, 2025 | Resources
Sunburst-Chart A Sunburst is a multi-layered radial chart that shows hierarchical data in one view. It starts with a central category and expands outward into phases and tasks, with slice size representing metrics such as time, cost, or sales. Unlike pie charts or...
Recent Comments