
-
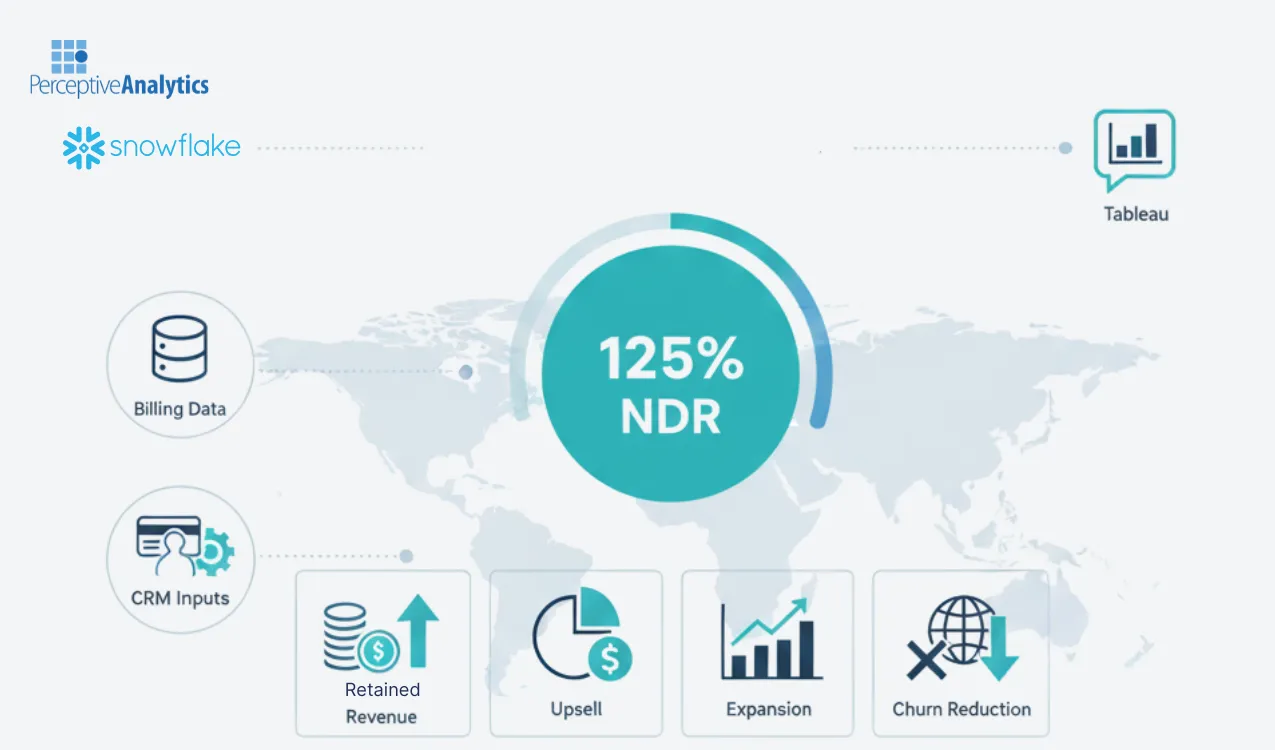
- Client: Global B2B payments platform, 1M+ customers in 100+ countries.
- Challenge: Leadership lacked a unified, real-time view of customer revenue retention, churn, and expansion patterns across regions and services. Fragmented insights from CRM, billing, and product usage systems made it difficult to identify at-risk revenue or prioritize engagement efforts.
- Tools: Snowflake, Tableau, CRM, and Transaction Usage and Invoices Data.
- Solution: A comprehensive Net Dollar Retention (NDR) analysis integrating customer usage, billing, and transaction data to quantify how revenue evolved across customer cohorts, industries, and regions. The analysis identified patterns of churn and growth, linked them to behavioral signals, and surfaced specific opportunities for retention and upsell.
- Impact:
- Reduced churn by 10% in high-risk segments through targeted retention programs.
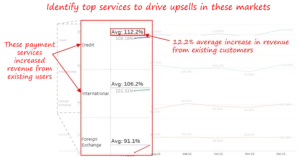
- identified 12.2% average increase in revenue from existing customers across high-growth services, industries and regions. Defined upsell strategies targeted for these segments.
- Cut executive review and planning time by 40% through automated, ready-to-use visualizations.
- Enabled leadership to prioritize engagement across top-performing geographies and service lines driving consistent NDR above 100%
- Reduced churn by 10% in high-risk segments through targeted retention programs.
- Client: Global B2B payments platform, 1M+ customers in 100+ countries.
Introduction and Business Context
In the payments industry, customer retention directly defines recurring revenue stability. While new customer acquisition fuels top-line growth, sustaining and expanding revenue from existing customers determines long-term profitability.
Our client, a rapidly growing global payments platform, faced the challenge of understanding how existing accounts contributed to monthly and quarterly revenue changes. With millions of transactions processed across industries and regions, leadership lacked cohesive visibility into whether growth was coming from new customers, existing ones, or being offset by churn.
Data existed across multiple systems — CRM, billing, and product usage — but none presented a unified picture. As a result, teams were limited to reactive retention strategies and lacked clarity on which geographies or industries were driving expansion or contraction.
To address these gaps, we conducted a Net Dollar Retention (NDR) Analysis, providing a single, quantitative measure of how effectively the company retained and grew revenue within its existing customer base.
Business Objectives
The engagement was structured around four strategic goals directly tied to revenue protection and growth efficiency:
- Quantify NDR by segment and geography to highlight where existing customers drive or dilute revenue.
- Identify churn and expansion patterns within customer cohorts to guide retention and upselling efforts.
- Enable proactive decision-making by connecting customer usage trends with revenue outcomes.
- Provide leadership with data-driven insights to prioritize revenue protection and growth initiatives.
Our Analytical Approach
1. Data Integration and Standardization
We began by consolidating customer billing, transaction, and product usage data into Snowflake. This created the foundation for accurate NDR computation and month-over-month comparisons.
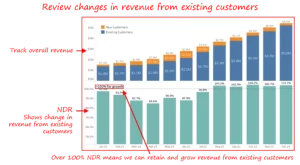
We defined Net Dollar Retention as:

This measure captured both revenue retention and growth, distinguishing it from traditional churn metrics that focus only on customer loss.
2. Segmentation and Trend Analysis:
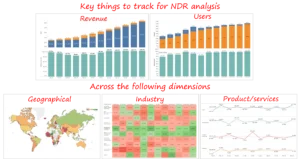
To uncover deeper insights, NDR was analyzed across:
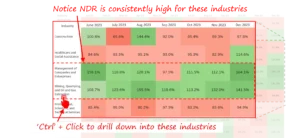
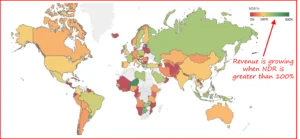
- Geographies: Identified regional leaders like Libya with consistently strong NDR performance.
- Industries: Highlighted stable sectors sustaining NDR above 100% across multiple months.
- Payment Services: Exposed high-growth offerings driving upsells among existing customers.
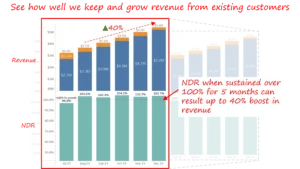
Trend tracking revealed that sustaining NDR above 100% for five consecutive months can result in a 40% boost in total revenue.
3. Retention and Expansion Correlation
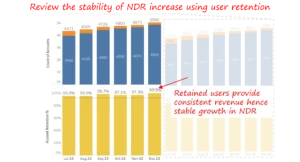
Customer retention rates and transaction usage were mapped against NDR to validate stability. Retained users consistently contributed to NDR improvements, while drops in engagement predicted contraction risk. This linkage helped teams connect customer behavior with financial performance.
4. Root Cause Exploration
High user retention wasn’t always the case. Previously, declines in NDR were investigated across cohorts. For example, certain service downgrades in logistics-linked accounts aligned with reduced cross-border activity, revealing external dependencies. Conversely, Improved NDR in mining and consulting clients correlated with higher product usage of their respective used products namely credit and international transactions. Promotional strategies based on this led to an upsell success and revenue growth of 12% from these industries.
5.Visualization and Communication of Findings
Using Tableau, results were visualized through comparative trend charts, retention curves, and segment-level summaries. Color-coded indicators (green for growth, red for decline) provided leadership with intuitive clarity on where retention strategies were succeeding or faltering.
Outcomes and Measurable Impact
The NDR analysis fundamentally shifted how leadership viewed customer-driven revenue performance. It replaced fragmented reporting with a unified, evidence-based understanding of growth and risk within the existing customer base.
Key Results:
- Revenue Growth Insight: Identified a 12.2% average revenue increase from existing customers across payment services.
- Churn Reduction: Targeted engagement strategies achieved a 10% drop in churn among high-risk cohorts.
- Growth Focus: Highlighted regions and services with sustained NDR >100%, enabling leadership to double down on profitable segments.
- Efficiency Gains: Reduced analytical turnaround time by 40% due to automated data refreshes and governed common definitions.
These results turned NDR tracking from a theoretical KPI into a strategic decision-making tool — guiding resource allocation, retention planning, and upsell prioritization with precision
Key Learnings and Recommendations
The NDR analysis demonstrated that tracking recurring revenue health metrics is not sufficient, Growth and proactive strategic decisions demands structured analysis, segmentation, and insights
Key Learnings:
- The NDR analysis demonstrated that sustained revenue growth depends as much on expanding existing relationships as on acquiring new ones. Regions and service lines with consistent NDR above 100% proved that well-retained customers can compound revenue even in mature markets.
- Segmentation unlocks precision: Identifying high-risk and high-growth segments allows tailored engagement instead of blanket strategies.
- Stable segments hide growth potential: Segments with flat NDR around 100% revealed hidden upsell opportunities in specific services and regions, guiding targeted cross-sell initiatives.
- Regional patterns reshape priorities: Regions with sustained NDR above 120% (e.g., Libya, Southeast Asia) became benchmarks for best practices, prompting strategic reinvestment in proven markets.
- Executive simplicity ensures action: Concise Tableau visuals combining NDR, user retention, and revenue drivers kept leadership discussions focused on measurable growth levers.
- Automation drives adoption: Regular Tableau refreshes ensure business leaders act on current, reliable information.
Recommendations:
Organizations should embed NDR as a central revenue health indicator across departments.. Quarterly reviews will focus on identifying segments where contraction outweighs expansion, supported by deeper root-cause analysis on renewing and contracting customers revenue. Finance and customer success teams will collaborate to design region and service specific playbooks aimed at improving renewability and upsell. These steps ensure that NDR becomes not just an analytical metric but a management framework—connecting financial outcomes to actionable growth strategy.
Each month, we curate the latest updates, insights, and trends for senior leaders in data analytics and AI in our CXO Analytics Newsletter.
Our mission is “to enable businesses to unlock value in data.” For over 20 years, we’ve partnered with more than 100 clients—from Fortune 500 companies to mid-sized firms—to solve complex data analytics challenges. Our services include Advanced Analytics Consulting, Generative AI Consulting, and Business Intelligence (Tableau Consulting, Power BI Consulting and Looker Consulting) turning data into strategic insight. We would love to talk to you. Do reach out to us for a free consultation.
Our Work
Industry
- Industry
Function
- Function
-
Increasing Conversions with Adwords Spend Optimizer
How To Optimize Adwords Budget in Real Time
Free Download


-
Markdown Optimization for Retailers
A Methodology to Track Performance and Maximize Value
Free Download
-
Optimizing Marketing Spend with Marketing Mix Modeling
Using Statistical Modeling and Empirical Methods
Free Download
-
Leveraging Web Analytics for Customer Acquisition
Leveraging Web Analytics for Customer Acquisition
Free Download
*Subscribe to be the first one to know our latest updates
Contact us

You have crafted a powerful analytical tool for us. Thank you.
Alan Benjamin
Principal, Benjamin Realty Advisors

I have been working with Chaitanya and Perceptive Analytics for about 20 months now. They did BI / reporting and excel tool development. Their work helped us in channeling our periodic reports to the senior and operational management. The team exceeded my expectations. Chaitanya would ask thought provoking questions that trigger a new line of thinking. They created good dashboards so our senior team can quickly interpret reports. We were able to make progress because the team knew finance and tools they created were easy to implement.
Samir Lavani
CFO at Pearl Hospitality

Chaitanya and the Perceptive Analytics team worked on multiple strategic projects that involved Tableau data visualizations. Perceptive's work (~ 1 year) led to successful launch of our portal - this was an important milestone for us. Visualizations created were insightful, easy to understand and visually attractive. The team often suggested ways to show data in more intuitive way so our audience can understand it. They also knew Tableau well that helped in customizing it for our purposes. The team worked hard to finish the project on time managing expectations. I look forward to working with Perceptive on other projects.
Haroon Yaqoob
Principal at Nomenclature Inc.
