Power BI Consulting Services That Goes Beyond the Dashboard
Our Microsoft Power BI consulting services help mid-market and enterprise teams build reporting they can actually trust - architected to scale.
- Power BI dashboard design and report development
- Data modeling, DAX optimization, and semantic layer builds
- Azure, Synapse, and cloud data pipeline integration
- Row-level security, governance, and workspace management
- Embedded analytics and self-service BI enablement
💡 Most Power BI consulting firms build you a dashboard. We build what the dashboard sits on.
Get Started Now →
Trusted by Industry Leaders Worldwide
Why Power BI Rollouts Fail - And How Our Consultancy Fixes Them
Your reports load slowly and everyone knows it
Finance, ops, and sales are all pulling different numbers
You have dashboards. Nobody uses them
One person understands the data model and they're a flight risk
Your data is in the cloud but Power BI can't reliably reach it
Security and governance are held together with good intentions
Comprehensive Microsoft Power BI Consulting Services
End-to-end expertise from strategy to execution across the Microsoft ecosystem. As a specialist Power BI consulting company, we cover every layer — from raw data to boardroom-ready reports.
Strategic Consulting
BI maturity assessment, tool selection, PoV, and ROI-focused roadmaps.
Data Architecture
Designing star schemas, Dataflows, and enterprise-grade semantic models.
Fabric Migration
Seamless migration to Fabric, OneLake, and modern data architectures.
Governance & Security
Implementing RLS, OLS, data lineage, and compliant sharing policies.
Managed Services
Ongoing support, enhancements, and administration by our expert team.
Dashboard Development
UX-first design, custom visuals, and executive-ready interactive reports.
DAX Optimization
Fixing slow reports, optimizing complex calculations, and ensuring sub-second latency.
Embedded Analytics
Embedding Power BI in your applications for a seamless customer experience.
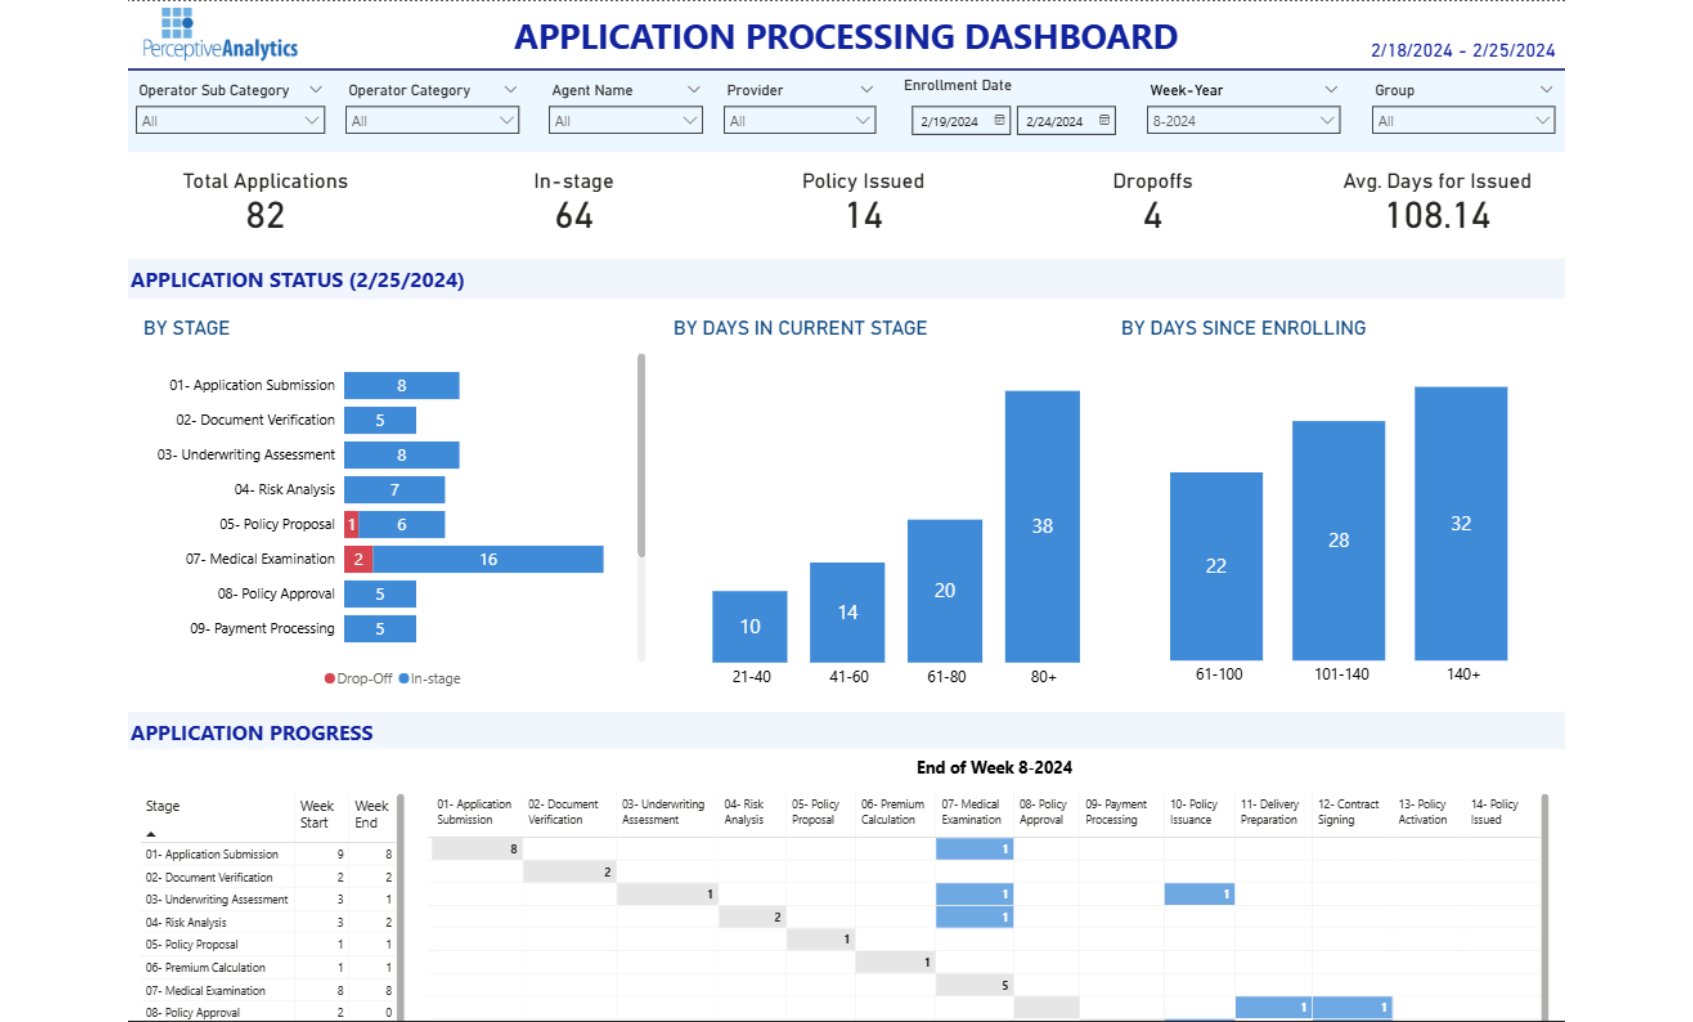
Real Impact: Enterprise Power BI Deployment
How we architect end-to-end analytics for high-growth enterprises
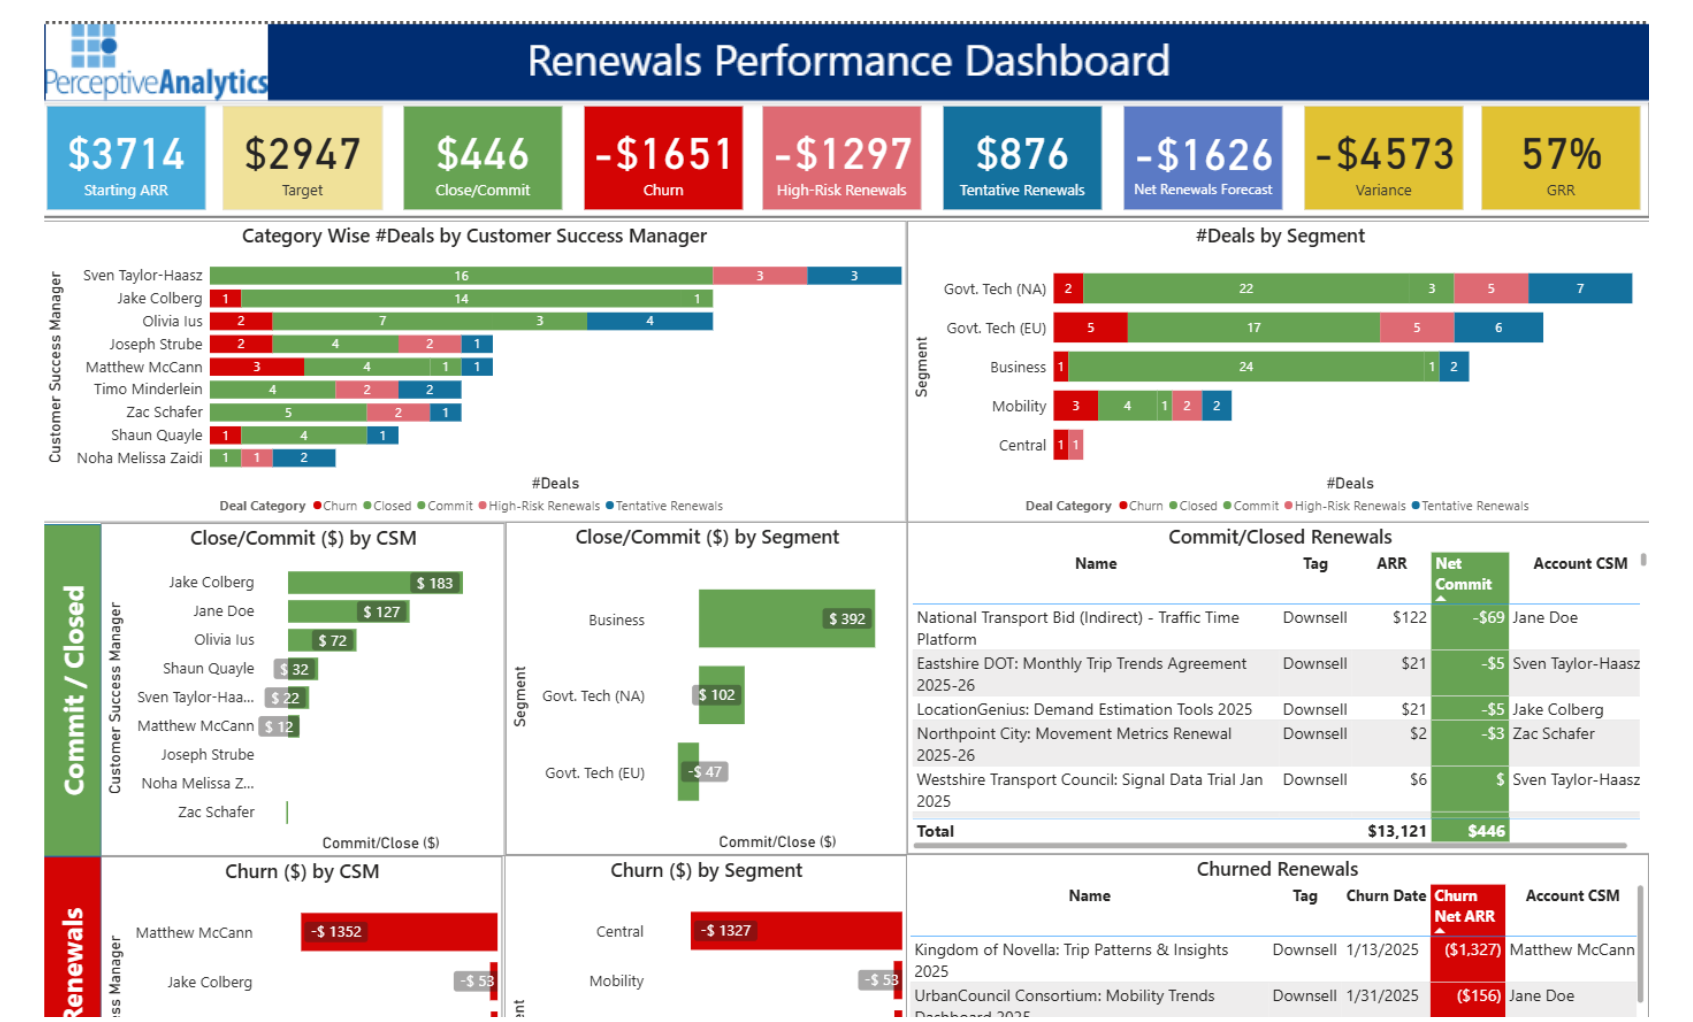
Business Impact
Gross Retention
Rate (GRR)
Visibility into
Renewal Risks
Revenue Saved
via Alerts
Check what our clients say
Hear from leaders who transformed their business with our analytics expertise
How Our Power BI Consultation Process Works
A transparent, agile process designed for Power BI success
Discovery & Assessment
We analyze your data sources (Azure, SQL, APIs) and business goals to design a scalable Power BI architecture.
Modeling & Development
Our experts build efficient star schemas and optimize DAX measures while creating interactive wireframes.
Iterative Delivery
We deploy dashboards in sprints, gathering your feedback weekly to ensure perfect alignment with business needs.
Handoff & Training
We configure RLS/gateways, hand over documentation, and train your team to manage the new reports confidently.
Ready to Get Started?
Schedule a 30-minute consultation to discuss your Power BI needs
Your information is secure and will never be shared
Latest Power BI Insights
Expert tutorials, best practices, and dashboard ideas from our Power BI consulting team
Find the Right Power BI Role
Our Power BI Consulting Engagement: 6 Phases Explained
Searching for Power BI consulting services in US? Perceptive Analytics, a leading Power BI consulting company in US, delivers Microsoft Power BI consulting services in US through our battle-tested 6-phase process. This fixed-timeline methodology eliminates surprises, ensuring US enterprises—from Buckhead fintechs to Hartsfield logistics—get live dashboards on schedule with measurable ROI.
Discovery & Scoping
We start with a structured discovery session where we interview key stakeholders across your organization to understand reporting needs, current pain points, and existing data infrastructure. We document which data sources are in play, who needs access to what, and what decisions the dashboards need to support.
Deliverable: Scope document + use case list
Timeline: Week 1
Data Audit
Our team connects to your data sources and assesses quality, completeness, and structure. We identify gaps in the data, inconsistencies between sources, and transformation requirements before any build work begins. This phase prevents the most common cause of BI project delays — discovering data issues mid-build.
Deliverable: Data readiness report
Timeline: Week 1–2
Architecture Design
Based on the audit findings, we design the data model — defining fact tables, dimension tables, relationships, and the DAX calculation layer. We present the architecture for stakeholder approval before building, which eliminates costly mid-project redesigns.
Deliverable: Data model design + approval
Timeline: Week 2–3
Build & Iterate
We develop dashboards in a staging environment with regular stakeholder review cycles. Each review focuses on accuracy of metrics, usability of the interface, and whether the reports answer the questions your team actually asks. We iterate based on feedback — not assumptions.
Deliverable: Working dashboards + review cycles
Timeline: Week 3–7
Testing & Handover
We run user acceptance testing, validate data accuracy against source systems, configure row-level security, set up scheduled refresh, and deploy to your production workspace. Governance documentation is delivered alongside the dashboards.
Deliverable: Live dashboards + governance docs
Timeline: Week 7–8
Training & Adoption
We conduct role-specific training sessions — executives learn navigation, analysts learn DAX editing and model management. We provide a 30-day support window post-launch to handle any issues or adjustments as your team ramps up.
Deliverable: Role-specific training + 30-day support
Timeline: Week 8–10
Note: For enterprise engagements (data warehouse build + full BI layer), timelines run 12–16 weeks. We scope every engagement before we start and give you a fixed delivery schedule in writing.
Power BI Consulting for US Industries: Tailored Solutions
Perceptive Analytics ranks among elite Power BI consulting companies in US, providing specialized Power BI consultancy in US for Hartsfield-Jackson logistics, Buckhead fintech, and beyond. Our consultants understand local compliance (HIPAA, SOC 2) and integrate niche sources like TMS/SCADA.
Financial Services & Fintech
Power BI is increasingly the reporting layer of choice for US's growing fintech sector, replacing legacy tools like Cognos and SSRS. Common use cases include portfolio performance dashboards, real-time transaction monitoring, and regulatory reporting automation. We build financial models with full audit trails, row-level security mapped to trader or advisor roles, and incremental refresh to handle transaction volumes at scale.
Compliance: SOC 2-aware reporting environments aligned to your existing data governance policies.
Logistics & Supply Chain
With Hartsfield-Jackson as the hub of the Southeast's distribution network, US logistics firms need real-time visibility across carriers, routes, costs, and exceptions. We build Power BI dashboards that pull from TMS, WMS, and ERP systems simultaneously — consolidating what is typically 5–8 separate operational reports into one live view.
Outcome: One mid-sized 3PL reduced daily operations review from 90 minutes to 15 minutes.
Healthcare & Life Sciences
US's healthcare sector spans academic medical centers, health systems, and life sciences companies operating under HIPAA and HITECH requirements. We build Power BI environments with sensitivity labels, row-level security mapped to clinical roles, and on-premises gateway configurations for data that cannot leave the network. Common use cases: bed management dashboards, clinical quality KPIs, revenue cycle reporting, and supply chain cost tracking.
Compliance: HIPAA-ready architecture with on-premises data gateway support.
Manufacturing & Operations
US manufacturers — particularly those in the Tier 1 automotive supply chain and aerospace components sector — need OEE, scrap rate, and production throughput visibility across shifts and facilities. We connect Power BI directly to SCADA, MES, and ERP data sources to give plant managers and operations directors a single live view across all production lines. No more end-of-shift Excel reports.
Outcome: Real-time OEE and production throughput visibility across all shifts and facilities.
Power BI vs Alternatives: Why Choose for US Businesses?
As premier Power BI consulting firm in US, Perceptive Analytics guides Microsoft Power BI consulting services in US with data-driven comparisons. US's Microsoft-heavy enterprises save 40-60% vs alternatives.
Power BI vs Tableau
Both are enterprise-grade BI platforms, but they serve different organizational profiles. Tableau has historically been stronger for ad-hoc visual exploration and is preferred by data science teams who build their own analyses. Power BI is stronger for structured enterprise reporting, broad user adoption, and organizations already in the Microsoft ecosystem (Office 365, Azure, Teams). Power BI's licensing model is also significantly more accessible at scale — the cost difference becomes significant above 100 users.
Choose Power BI when: Your org runs on Microsoft infrastructure, needs wide deployment across non-technical users, and wants integration with Excel, SharePoint, and Teams.
Power BI vs Excel
Excel is a calculation tool. Power BI is a reporting platform. The difference matters when your reports are being shared across teams, updated manually every week, or used to make decisions by people who should not be editing the underlying data. Excel reporting breaks at scale — version control, manual refresh, and formula errors are the three most common failure modes we see when we audit a new client's reporting environment.
The difference: Power BI connects directly to your data sources, refreshes automatically, and presents a single version of the truth. Most Excel-to-Power-BI migrations deliver measurable time savings within 30 days.
Consulting vs In-House Hire
A full-time Power BI developer in US costs between $90,000 and $130,000 per year before benefits and tools. That cost is justified if you have ongoing, full-time demand for Power BI development. For most mid-market companies, the demand is project-based — an initial build, periodic optimization, and occasional new reports. A consulting engagement delivers the expertise when you need it without the overhead when you do not.
The advantage: A consulting team brings data engineering, DAX architecture, governance, and adoption experience that a single hire rarely covers.
Our Power BI Methodology: Standards for US Excellence
Perceptive Analytics' methodology powers Power BI consulting services in US, delivering sub-second performance and Fortune 500 governance for Power BI consultancy in US.
Data Modeling Standards
Every Power BI solution we build follows a star schema architecture. Fact tables contain transactional and event data. Dimension tables provide the attributes for filtering and grouping. We avoid bi-directional relationships, minimize calculated columns in favor of measures, and design models to support incremental refresh from day one. This approach ensures query performance remains fast even as data volumes grow into tens of millions of rows.
DAX Engineering
We write DAX with performance as the first priority. That means using CALCULATE with explicit filter contexts, avoiding nested FILTER functions on large tables, leveraging variables to prevent repeated evaluation, and pre-computing expensive calculations in Power Query where appropriate. For financial models, we implement time intelligence patterns (YTD, QTD, rolling averages) using standard DAX time functions rather than custom calendar logic — which makes the model easier to maintain and audit.
Governance Framework
Enterprise Power BI deployments require governance from day one. We configure workspace-level permissions aligned to your organizational structure, implement row-level security using both static and dynamic RLS patterns, set up deployment pipelines (Dev → Test → Prod), configure sensitivity labels for data classification, and document everything in a governance playbook that your internal team can follow after handover.
Consultant Insights & FAQs
What types of Power BI consulting services does your team provide?
At Perceptive Analytics, our Power BI consulting services are designed to meet the needs of mid-market businesses seeking analytics maturity without the complexity and cost of enterprise-scale programs. We deliver full-lifecycle support, including:
- Requirements Analysis: Business objective scoping and discovery workshops.
- Data Modeling: Schema design and semantic layer development.
- Dashboard Development: Reports tailored to mid-market KPIs.
- DAX Optimization: Faster, more accurate calculations.
- Governance & Security: Configuration including row-level security (RLS).
- Performance Tuning: Efficient data refresh and report load times.
- End-User Training: Documentation for self-service adoption.
For mid-market organizations, we pay particular attention to scalability—building solutions that grow with your data volumes and team without requiring a re-architecture every 12 months.
What should I expect from Microsoft Power BI consulting services?
When you engage Perceptive Analytics for Microsoft Power BI consulting services, you can expect a structured, business-first approach—not just a technical delivery. Here's what the engagement typically includes:
- Discovery Workshops: Align on business objectives and reporting needs.
- Current-State Assessment: Review of your data landscape, sources, and tools.
- Data Model Design: Best practices for mid-market analytics environments.
- Iterative Development: Dashboard builds with stakeholder review checkpoints.
- Governance Setup: Access controls and audit capabilities.
- Handover & Training: Documentation for internal teams to self-serve.
For mid-market companies, this means enterprise-quality thinking without enterprise-level overhead—delivery timelines, team involvement, and solution complexity right-sized to your organization.
How does Power BI consultancy differ from basic dashboard creation?
Basic dashboard creation focuses on visuals. True Power BI consultancy goes much deeper—and for mid-market businesses, that difference has real strategic value. Here's what sets consultancy apart:
- Strategic Data Architecture: A semantic model that serves multiple use cases, not just one report.
- Metrics Definition: Standardized KPIs so every team works from a single source of truth.
- Data Integration: Connecting and transforming data from multiple business systems.
- Performance Engineering: Dashboards that stay fast as data volumes grow.
- Governance: Controlling who sees what and maintaining data quality over time.
- Change Management: Helping your team adopt and trust the analytics outputs.
At Perceptive Analytics, we apply all these layers to every engagement. Skipping architecture and governance leads to fragile solutions that break under scale—our consultancy approach ensures your Power BI environment is built to last.
What makes a Power BI consulting company stand out?
Not all Power BI consulting companies deliver the same depth of value. For mid-market businesses evaluating partners, here are the qualities that distinguish a truly capable firm:
- Deep Technical Expertise: DAX, Power Query, data modeling, and gateway configuration.
- Domain Understanding: Consultants who know your industry's data and KPIs.
- Delivery Rigor: Defined project frameworks, clear milestones, and transparent communication.
- Mid-Market Focus: Solutions designed for your team size, not enterprise complexity.
- Scalability Mindset: Building today's solution with tomorrow's growth in mind.
- Post-Delivery Support: Helping you maintain and evolve the solution over time.
At Perceptive Analytics, these aren't aspirational values—they're built into our delivery methodology. Our consultants bring senior-level expertise and a hands-on approach to every project.
How does Perceptive Analytics compare with other Power BI consulting companies?
Perceptive Analytics is specifically positioned to serve mid-market businesses that need high-quality analytics without enterprise-scale costs or complexity. Here's how we differentiate:
- Experienced Consultants: Senior practitioners with deep Power BI, data modeling, and analytics expertise.
- Transparent Delivery: Clear project scopes, timelines, and communication at every stage.
- Mid-Market Specialization: Right-sized solutions that fit your team, budget, and data maturity.
- Enterprise Governance: Rigorous practices adapted for mid-market—without being bureaucratic.
- Cross-Industry Track Record: Proven delivery across manufacturing, retail, professional services, and more.
- Business Outcomes Focus: Not just technical deliverables, but measurable impact on decisions.
While larger consulting firms often bring enterprise-scale processes to mid-market engagements, Perceptive Analytics delivers the expertise without the overhead—greater agility, responsiveness, and alignment to how mid-market organizations actually operate.
Can I get a Power BI consultation before committing to a full engagement?
Yes. Perceptive Analytics offers structured Power BI consultation sessions specifically designed for mid-market organizations that want to make informed decisions before committing to a larger investment. A typical consultation includes:
- Landscape Assessment: Review of your current reporting, data sources, and BI tools.
- Quality Review: Evaluation of existing dashboards or models for performance and governance gaps.
- Quick Wins Identification: Differentiating immediate improvements from longer-term architectural work.
- Technology Recommendations: Data modeling approach, governance structure, and technology fit.
- Phased Roadmap: Delivery options suited to your budget and timeline.
- Honest Scoping: Clear guidance on complexity and internal resource requirements.
For mid-market companies, this structured consultation removes significant risk from the decision-making process—you'll have a clear picture of what's needed, what it will cost, and what outcomes to expect before any long-term commitment is made.
Are you one of the trusted Power BI consulting firms for mid-market and enterprise projects?
Yes. Perceptive Analytics is recognized among trusted Power BI consulting firms, with particular strength in serving mid-market organizations that require enterprise-grade analytical capabilities at an appropriate scale. Our delivery capabilities include:
- Large Dataset Handling: Optimized data models and incremental refresh strategies.
- Cross-Functional Security: Role-based access and row-level security for broad user bases.
- Robust Governance: Data lineage, refresh monitoring, and audit controls.
- Secure Deployment: On-premises gateway configurations and hybrid models.
- Scalable Solutions: Designed to handle growth in data volume, users, and reporting complexity.
- Ongoing Managed Services: Support for organizations without dedicated in-house Power BI expertise.
For mid-market companies specifically, we offer the technical depth of an enterprise-focused firm without the delivery complexity that often slows projects down—moving quickly, transferring knowledge effectively, and producing analytics environments your team can own long-term.
What business outcomes can I expect from engaging Power BI consulting services?
Engaging Perceptive Analytics' Power BI consulting services delivers measurable business value—not just better-looking dashboards. For mid-market organizations, these are the outcomes you can expect:
- Faster Time to Insight: Decisions made on current data, not last month's spreadsheets.
- Trusted Analytics: A single source of truth that everyone in the business agrees on.
- Operational Transparency: Real-time visibility into performance across departments.
- Self-Service Capabilities: Business users explore data independently without IT dependency.
- Governance & Data Quality: Consistent, auditable metrics that hold up under scrutiny.
- Reduced Reporting Burden: Automated reports replacing manual Excel processes.
- Scalable Foundation: Analytics infrastructure that grows with your business.
For mid-market businesses, these outcomes translate directly into competitive advantage. When your sales, operations, and finance teams work from the same trusted data, strategic decisions improve and execution accelerates.
How does Power BI compare with other BI tools like Tableau, Looker, or Qlik?
Power BI is consistently the top choice for mid-market organizations evaluating business intelligence platforms. Here's how it stacks up against the main alternatives:
- Cost: Power BI Pro is significantly more affordable than Tableau or Qlik—the practical choice for mid-market budgets.
- Microsoft Ecosystem: Native connectivity with Excel, Azure, Teams, SharePoint, and Dynamics 365 reduces integration friction dramatically.
- DAX & Data Modeling: Power BI's semantic layer enables complex business logic that Looker requires LookML expertise to replicate.
- Deployment Flexibility: Available as cloud (Power BI Service), on-premises (Report Server), or embedded—giving IT teams more control.
- Frequent Updates: Microsoft releases monthly feature updates, keeping Power BI at the cutting edge without additional licensing costs.
- Talent Availability: One of the largest BI developer communities, making it easier to hire or train internal staff.
That said, tool selection should always be driven by your specific data environment, team skills, and business requirements. At Perceptive Analytics, we provide honest, vendor-neutral advisory during our consultation phase.
Do you offer ongoing Power BI support and managed services after delivery?
Yes. Perceptive Analytics offers structured post-delivery support and managed services, specifically designed for mid-market organizations that don't have dedicated in-house Power BI expertise. Our ongoing support covers:
- Report & Dashboard Maintenance: Updates as business requirements or data sources change.
- Data Model Optimization: Ongoing tuning as data volumes grow or new metrics are required.
- Refresh Monitoring: Proactive alerts and resolution for failed data refreshes.
- Gateway Management: Ensuring on-premises data connections remain stable and secure.
- New Report Development: Building additional reports on top of your existing data model.
- User Support & Training: Helping new team members get productive with Power BI quickly.
- Quarterly Health Checks: Reviewing performance, governance, and alignment with business goals.
Perceptive Analytics offers flexible retainer models that scale to your usage needs—so you get the right level of support without overpaying for capacity you don't use.
Do you have industry-specific expertise in Power BI consulting?
Yes. Perceptive Analytics brings cross-industry experience to our Power BI consulting engagements, with particular depth in the sectors most commonly served by mid-market organizations. Our industry expertise includes:
- Manufacturing: Production efficiency dashboards, OEE tracking, supply chain visibility, and inventory analytics.
- Retail & E-Commerce: Sales performance, customer segmentation, margin analysis, and demand forecasting.
- Professional Services: Utilization reporting, project profitability, pipeline analytics, and resource planning.
- Financial Services: P&L dashboards, portfolio reporting, compliance monitoring, and cash flow analytics.
- Healthcare & Life Sciences: Operational KPIs, patient flow, workforce productivity, and regulatory reporting.
- Distribution & Logistics: Delivery performance, route efficiency, warehouse operations, and vendor scorecards.
Industry expertise matters in Power BI consulting because data models, KPIs, and reporting structures vary significantly by sector. Our consultants bring domain knowledge alongside technical skills—meaning we spend less time learning your business and more time delivering insights that are immediately actionable.
How long does a typical Power BI consulting engagement take to deliver?
Implementation timelines vary based on scope, data complexity, and your organization's readiness—but here are realistic benchmarks for mid-market Power BI engagements:
- Consultation & Assessment: 1–2 weeks — scoping, data landscape review, and roadmap definition.
- Foundation Build (Single Domain): 4–6 weeks — data model, core dashboards, and basic governance for one business area.
- Multi-Domain Deployment: 8–16 weeks — covering sales, finance, operations, or other functions with an integrated data model.
- Full Analytics Transformation: 3–6 months — enterprise-wide semantic layer, governance framework, and self-service enablement.
- Optimization Engagements: 2–4 weeks — performance tuning, DAX refactoring, or governance improvements on existing environments.
For mid-market organizations, we focus on phased delivery—getting value into users' hands early while building toward a more complete solution. We'll provide a detailed project plan with clear milestones during our initial consultation so you know exactly what to expect before work begins.
What are the key technical considerations in a Power BI consulting engagement?
A successful Power BI implementation requires sound technical decision-making across multiple layers. At Perceptive Analytics, we address the following technical areas in every mid-market engagement:
- Data Modeling: Star schema design, relationship management, and avoiding bidirectional filters that hurt performance.
- DAX Development: Optimized measures using variables, CALCULATE context transitions, and iterator functions (SUMX, AVERAGEX) correctly.
- Power Query (M): Efficient data transformation, query folding preservation, and incremental refresh configuration.
- Gateway Architecture: On-premises gateway sizing, clustering for high availability, and scheduled refresh management.
- Row-Level Security (RLS): Static and dynamic RLS implementation for role-based data access across user groups.
- Deployment Pipelines: Dev/Test/Prod environment management using Power BI Premium or Fabric workspaces.
- Performance Optimization: Reducing model size through aggregations, removing unnecessary columns, and using Vertipaq Analyzer to identify bottlenecks.
- Composite Models: Balancing DirectQuery and Import mode for real-time vs. high-performance reporting needs.
Getting these technical foundations right from the start prevents costly rework later. Many businesses come to us after struggling with slow reports, broken refreshes, or models that can't scale—problems that stem from shortcuts taken during the initial build. Perceptive Analytics applies engineering discipline to every layer of the stack.
Power BI Consulting Across United States