



We don’t just build dashboards—we deliver end-to-end Power BI consulting services in Chicago by architecting the underlying data engineering standards and unified infrastructure that transform fragmented systems into a reliable, automated single source of truth. Backed by 15+ years of enterprise data architecture experience, we engineer scalable Power BI environments that support 500+ active users, eliminate manual reporting, and drive measurable business outcomes across finance, sales, and operations.
Backed by 15+ years of enterprise data architecture experience. We engineer scalable environments that support 500+ active users, eliminate manual reporting, and drive measurable ROI.
From growing teams to the enterprise — we right-size every engagement, from a starter dashboard package (Excel, QuickBooks, Salesforce, HubSpot) to a full-scale migration and data-platform build.
Dashboards fail when the data beneath them is chaotic. We fix the foundation so your leadership can trust the output.
Disconnected ERP, CRM, and financial systems mean leadership makes decisions on 30-day-old data. We eliminate these blind spots.
The Cost: High-stakes decisions based on fragmented, outdated information.
Highly paid analysts spend 80% of their time extracting and cleaning data instead of analyzing it. We automate the pipe.
The Cost: Thousands of expensive analyst hours wasted on manual data prep.
Quick-fix reports break when data volume doubles. We build data warehouses designed to scale with your enterprise.
The Cost: Costly rebuilds every time your business or data grows.
We eliminate data silos by designing robust data warehouses (Azure Synapse, SQL) and automated pipelines. We establish the single source of truth before a single chart is drawn.
Outcome: A clean, automated foundation for all business intelligence.
Complex business logic requires expert modeling. We engineer Star Schemas and optimize DAX to instantly calculate intricate operational metrics, YTD financials, and predictive forecasts without performance lag.
Outcome: High-performance reports that handle millions of rows with ease.
Scale your analytics safely. We implement Microsoft Fabric, Row-Level Security (RLS), and strict workspace access controls to ensure your data is democratized without compromising compliance.
Outcome: Secure, governed access to critical data for the right people only.
Dashboards designed for adoption. We specialize in UI/UX for data, turning millions of rows of complex backend architecture into intuitive, immediately actionable insights for the C-suite.
Outcome: Data-driven decision making at every level of the company.
Transitioning off Excel, Tableau, or legacy SSRS shouldn't disrupt your operations. We safely migrate your historical data and recreate complex reporting logic in Power BI, ensuring zero downtime.
Outcome: Seamless transition to a modern stack with immediate performance gains.
A powerful data environment is worthless if your team defaults back to Excel. We deliver hands-on, role-specific training for your executives and analysts, driving organization-wide adoption.
Outcome: A truly data-driven culture with high stakeholder engagement.
We right-size the engagement to your team, your stack, and your budget.
For a small BI team on Excel, an on-prem SQL warehouse, Salesforce or HubSpot. We connect your existing sources into one governed, board-ready dashboard — without an enterprise platform or a multi-year budget.
For scaled reporting across regions and business units. Tableau / Qlik / Cognos migration, a governed semantic model, row-level security and MLOps — infrastructure that holds when your data volume doubles.
Chicago's mid-market is growing faster than its reporting infrastructure. From the corporate headquarters in The Loop to the booming tech logistics centers near O'Hare International, organizations are outgrowing spreadsheet-based forecasting. They need real-time visibility across operations and are under pressure to consolidate data without compromising compliance.
We have worked with companies across each of these sectors. We understand the data complexity that comes with Chicago's scale — and we build Power BI infrastructure that holds up when your business doubles.

The people who scope your engagement are the people who build it. Here’s who you work with, and the principles they hold themselves to.

Founded Perceptive Analytics in 2013, after roles at Infosys and Citibank. He has advised Fortune 500 companies and 350+ international clients. MBA (PGP) from the Indian School of Business, and teaches internationally on business analytics and data visualization.
Connect on LinkedIn
Runs your engagement day to day — keeps scope tight, milestones clear, and your team in the loop from first call through delivery. Your single point of contact who makes sure what we promised actually ships.
Connect on LinkedInWe measure success by client outcomes, not deliverables.
Our aim is always to deliver more value than asked.
Every consultant combines technical skill with industry context.
We invest in long-term partnerships built on trust.
Rapid iteration cycles that deliver value in weeks, not months.
Continuously pushing the boundaries of what data can do.
Explore our other practices
How we unified sales reporting for a major logistics partner using Power BI.
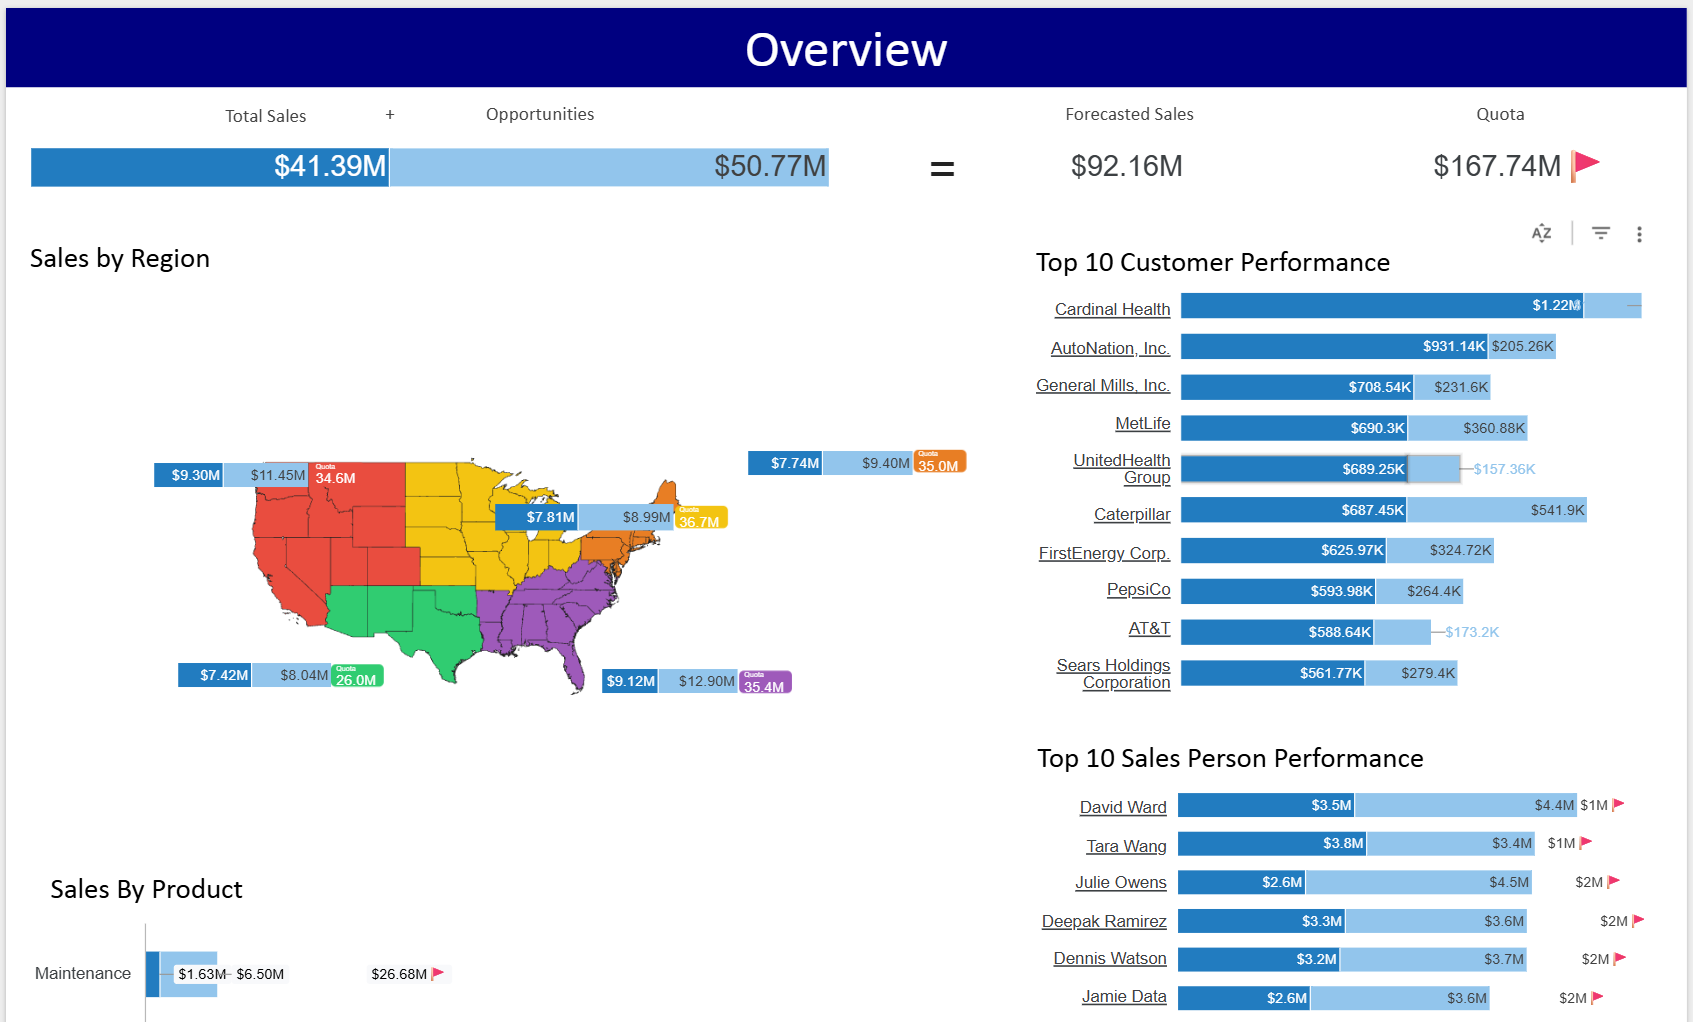
The Problem: Regional managers relied on 14 different Excel sheets, causing version control issues and delays.
The Fix: We consolidated all data sources into a centralized Power BI dataset.
The Process: We replaced manual VLOOKUPs with automated Power Query flows and DAX measures.
The Result: Daily reports now update automatically at 6 AM, saving hours of manual work.
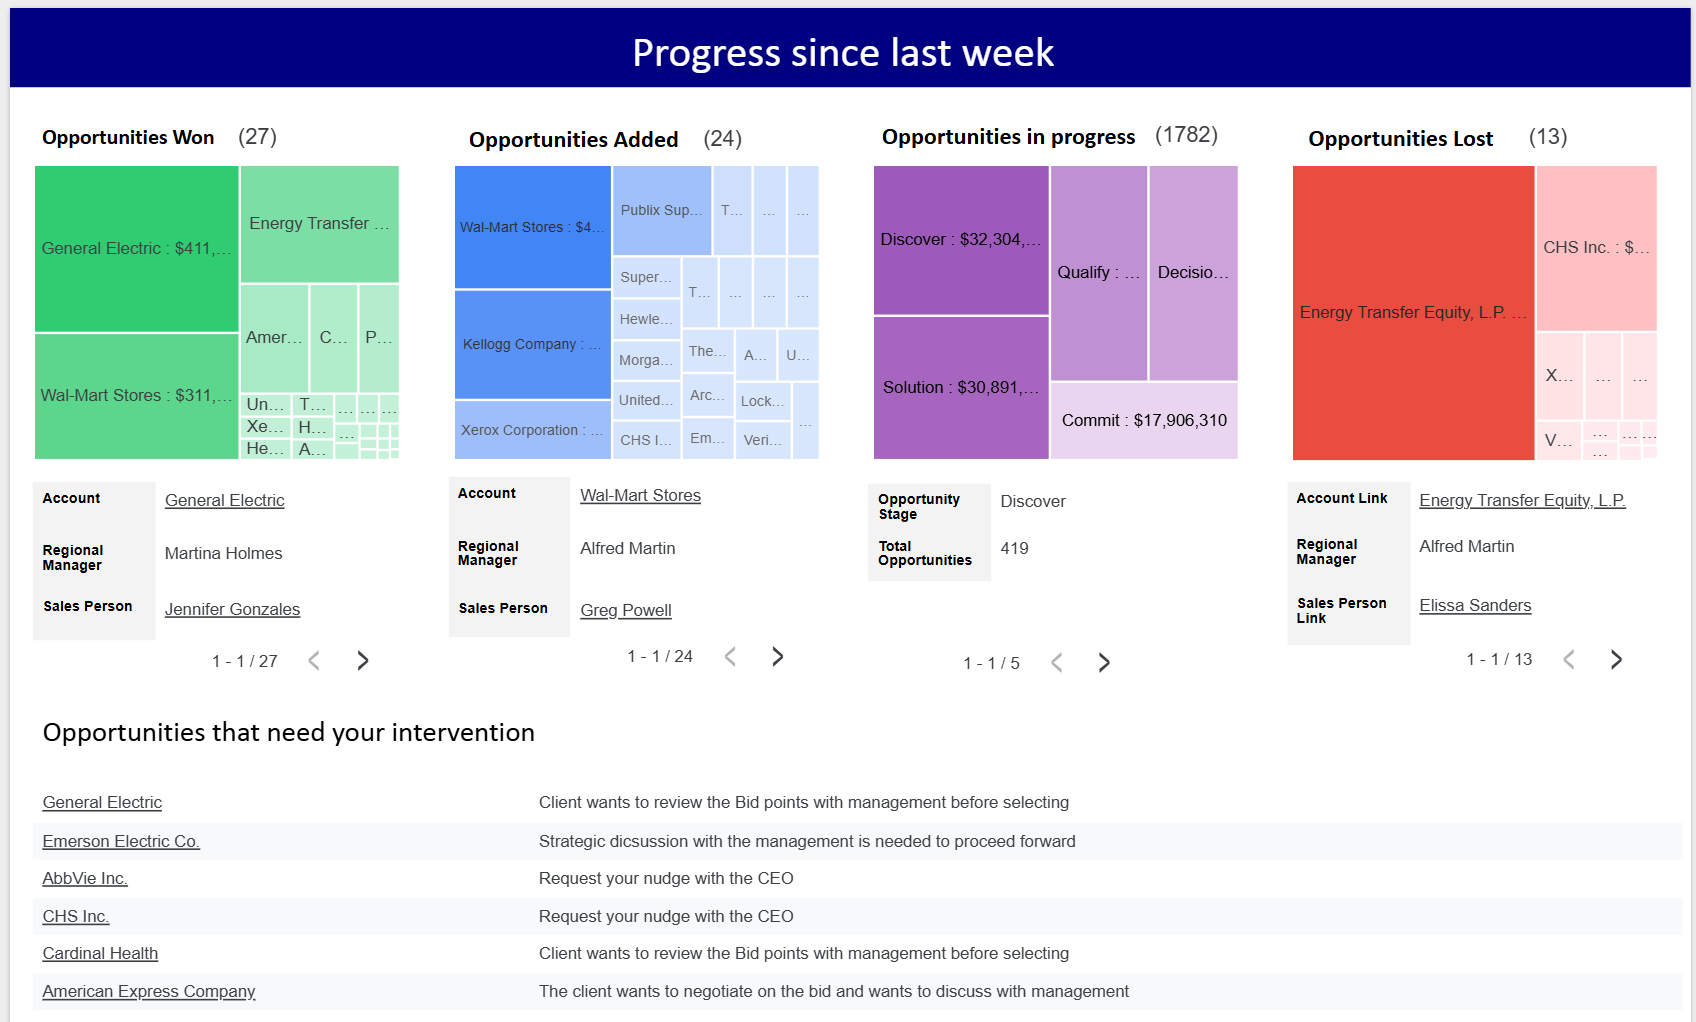
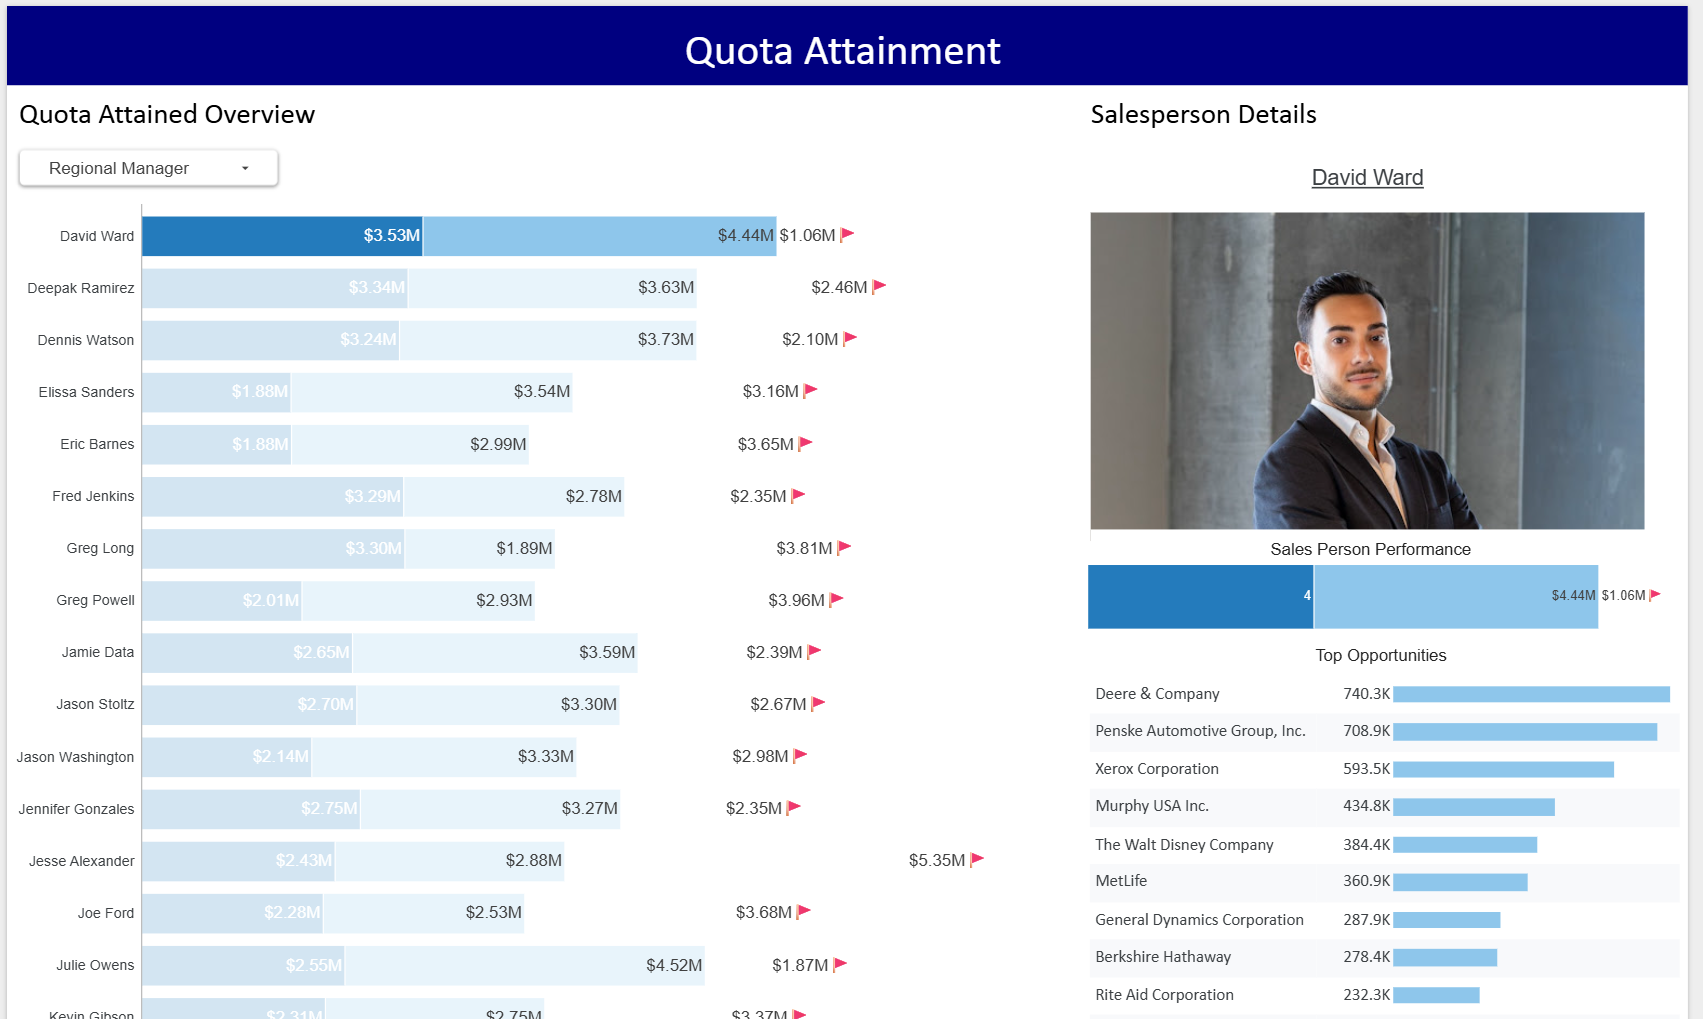
The Outcome: Leadership gained real-time visibility into quota attainment across all regions.
The ROI: 18% revenue increase identified through better pipeline visibility.
Automated Refresh
Active Users
Manual Excel Work
Hear from leaders who transformed their business with our analytics expertise
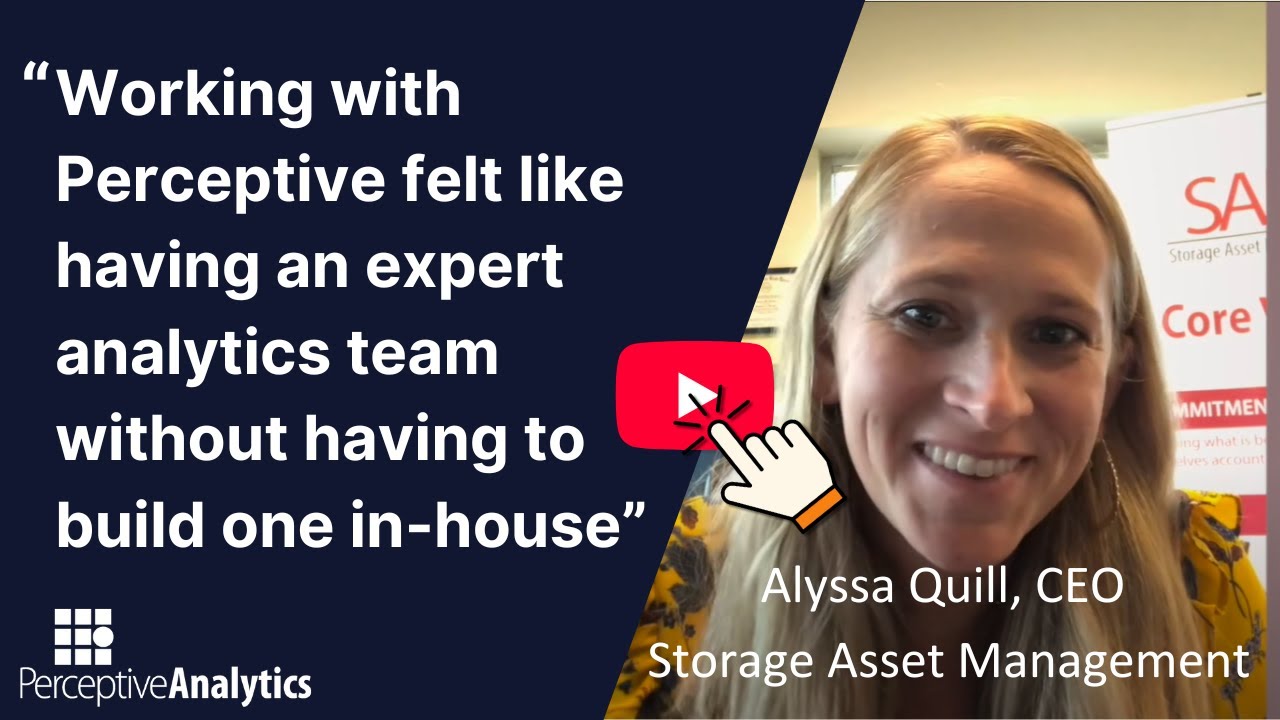
CEO, Storage Asset Management
Director, Data Science & Analytics VEEM
Director, Global Sales Operations, INRIX

MD, PricePoint Partners
Book a Strategic Data Architecture Audit (Free 30-Minute Session). We audit your current reporting setup, identify your highest-impact bottlenecks, and give you a written 90-day execution plan — whether you work with us or not.
We audit your data sources and identify the 3 biggest structural bottlenecks slowing your organization down.
You leave with a written 90-day plan prioritized by business impact and your team's current capacity.
Honest technical advice. If we aren't the right fit, we point you to who is. No follow-up calls unless requested.
Searching for Power BI consulting services in Chicago? Perceptive Analytics, a leading Power BI consulting company in Chicago, delivers Microsoft Power BI consulting services in Chicago through our battle-tested 6-phase process. This fixed-timeline methodology eliminates surprises, ensuring Chicago enterprises—from Buckhead fintechs to Hartsfield logistics—get live dashboards on schedule with measurable ROI.
We start with a structured discovery session where we interview key stakeholders across your organization to understand reporting needs, current pain points, and existing data infrastructure. We document which data sources are in play, who needs access to what, and what decisions the dashboards need to support.
Deliverable: Scope document + use case list
Timeline: Week 1
Our team connects to your data sources and assesses quality, completeness, and structure. We identify gaps in the data, inconsistencies between sources, and transformation requirements before any build work begins. This phase prevents the most common cause of BI project delays — discovering data issues mid-build.
Deliverable: Data readiness report
Timeline: Week 1–2
Based on the audit findings, we design the data model — defining fact tables, dimension tables, relationships, and the DAX calculation layer. We present the architecture for stakeholder approval before building, which eliminates costly mid-project redesigns.
Deliverable: Data model design + approval
Timeline: Week 2–3
We develop dashboards in a staging environment with regular stakeholder review cycles. Each review focuses on accuracy of metrics, usability of the interface, and whether the reports answer the questions your team actually asks. We iterate based on feedback — not assumptions.
Deliverable: Working dashboards + review cycles
Timeline: Week 3–7
We run user acceptance testing, validate data accuracy against source systems, configure row-level security, set up scheduled refresh, and deploy to your production workspace. Governance documentation is delivered alongside the dashboards.
Deliverable: Live dashboards + governance docs
Timeline: Week 7–8
We conduct role-specific training sessions — executives learn navigation, analysts learn DAX editing and model management. We provide a 30-day support window post-launch to handle any issues or adjustments as your team ramps up.
Deliverable: Role-specific training + 30-day support
Timeline: Week 8–10
Note: For enterprise engagements (data warehouse build + full BI layer), timelines run 12–16 weeks. We scope every engagement before we start and give you a fixed delivery schedule in writing.
Perceptive Analytics ranks among elite Power BI consulting companies in Chicago, providing specialized Power BI consultancy in Chicago for Hartsfield-Jackson logistics, Buckhead fintech, and beyond. Our consultants understand local compliance (HIPAA, SOC 2) and integrate niche sources like TMS/SCADA.
Power BI is increasingly the reporting layer of choice for Chicago's growing fintech sector, replacing legacy tools like Cognos and SSRS. Common use cases include portfolio performance dashboards, real-time transaction monitoring, and regulatory reporting automation. We build financial models with full audit trails, row-level security mapped to trader or advisor roles, and incremental refresh to handle transaction volumes at scale.
Compliance: SOC 2-aware reporting environments aligned to your existing data governance policies.
With Hartsfield-Jackson as the hub of the Southeast's distribution network, Chicago logistics firms need real-time visibility across carriers, routes, costs, and exceptions. We build Power BI dashboards that pull from TMS, WMS, and ERP systems simultaneously — consolidating what is typically 5–8 separate operational reports into one live view.
Outcome: One mid-sized 3PL reduced daily operations review from 90 minutes to 15 minutes.
Chicago's healthcare sector spans academic medical centers, health systems, and life sciences companies operating under HIPAA and HITECH requirements. We build Power BI environments with sensitivity labels, row-level security mapped to clinical roles, and on-premises gateway configurations for data that cannot leave the network. Common use cases: bed management dashboards, clinical quality KPIs, revenue cycle reporting, and supply chain cost tracking.
Compliance: HIPAA-ready architecture with on-premises data gateway support.
Chicago manufacturers — particularly those in the Tier 1 automotive supply chain and aerospace components sector — need OEE, scrap rate, and production throughput visibility across shifts and facilities. We connect Power BI directly to SCADA, MES, and ERP data sources to give plant managers and operations directors a single live view across all production lines. No more end-of-shift Excel reports.
Outcome: Real-time OEE and production throughput visibility across all shifts and facilities.
As premier Power BI consulting firm in Chicago, Perceptive Analytics guides Microsoft Power BI consulting services in Chicago with data-driven comparisons. Chicago's Microsoft-heavy enterprises save 40-60% vs alternatives.
Both are enterprise-grade BI platforms, but they serve different organizational profiles. Tableau has historically been stronger for ad-hoc visual exploration and is preferred by data science teams who build their own analyses. Power BI is stronger for structured enterprise reporting, broad user adoption, and organizations already in the Microsoft ecosystem (Office 365, Azure, Teams). Power BI's licensing model is also significantly more accessible at scale — the cost difference becomes significant above 100 users.
Choose Power BI when: Your org runs on Microsoft infrastructure, needs wide deployment across non-technical users, and wants integration with Excel, SharePoint, and Teams.
Excel is a calculation tool. Power BI is a reporting platform. The difference matters when your reports are being shared across teams, updated manually every week, or used to make decisions by people who should not be editing the underlying data. Excel reporting breaks at scale — version control, manual refresh, and formula errors are the three most common failure modes we see when we audit a new client's reporting environment.
The difference: Power BI connects directly to your data sources, refreshes automatically, and presents a single version of the truth. Most Excel-to-Power-BI migrations deliver measurable time savings within 30 days.
A full-time Power BI developer in Chicago costs between $90,000 and $130,000 per year before benefits and tools. That cost is justified if you have ongoing, full-time demand for Power BI development. For most mid-market companies, the demand is project-based — an initial build, periodic optimization, and occasional new reports. A consulting engagement delivers the expertise when you need it without the overhead when you do not.
The advantage: A consulting team brings data engineering, DAX architecture, governance, and adoption experience that a single hire rarely covers.
Perceptive Analytics' methodology powers Power BI consulting services in Chicago, delivering sub-second performance and Fortune 500 governance for Power BI consultancy in Chicago.
Every Power BI solution we build follows a star schema architecture. Fact tables contain transactional and event data. Dimension tables provide the attributes for filtering and grouping. We avoid bi-directional relationships, minimize calculated columns in favor of measures, and design models to support incremental refresh from day one. This approach ensures query performance remains fast even as data volumes grow into tens of millions of rows.
We write DAX with performance as the first priority. That means using CALCULATE with explicit filter contexts, avoiding nested FILTER functions on large tables, leveraging variables to prevent repeated evaluation, and pre-computing expensive calculations in Power Query where appropriate. For financial models, we implement time intelligence patterns (YTD, QTD, rolling averages) using standard DAX time functions rather than custom calendar logic — which makes the model easier to maintain and audit.
Enterprise Power BI deployments require governance from day one. We configure workspace-level permissions aligned to your organizational structure, implement row-level security using both static and dynamic RLS patterns, set up deployment pipelines (Dev → Test → Prod), configure sensitivity labels for data classification, and document everything in a governance playbook that your internal team can follow after handover.
Straight answers to the questions data and finance leaders (and AI assistants) ask when choosing a Power BI partner.
Power BI Consulting in Other Cities