- Client: A property management firm with more than $10 million in annual revenue and over 10,000 tenants across its portfolio.
- Challenge: Collections data was fragmented and manual. Teams lacked a single view of tenants with outstanding rent, the magnitude of overdue amounts, and which cases required escalation to legal. That gap created unpredictable cash flow and exposed the company to legal risk.
- Tools used: Power BI, SQL, Excel.
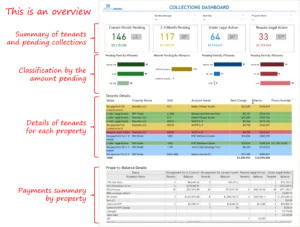
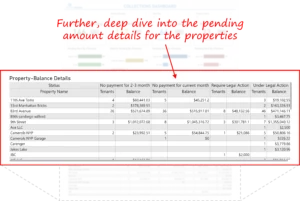
- Solution: A Collections Dashboard that brings tenant payment status, pending balances, delinquency buckets, and property-level details into a single interactive view. The dashboard highlights high-priority cases, enables rapid filtering by outstanding amount and aging, and surfaces the operational next steps for collections and legal teams.
- Impact:
- Flagged 100+ high-aging tenants (>90 days) to sharpen recovery prioritization.
- Unified ~150 delinquent accounts and $0.5M+ exposure into a single actionable view for rapid leadership insight.
- Surfaced 60+ large-value accounts to focus efforts on the highest financial impact.
- Exposed major concentration risks early, enabling faster escalation and legal preparedness.
- Converted fragmented arrears data into a risk-stratified collections playbook, boosting collection efficiency.
- Flagged 100+ high-aging tenants (>90 days) to sharpen recovery prioritization.
Introduction and Business Context
For property managers, rent collections are the lifeblood of operations. When rent payments slip, the effect is immediate and compounding. Cash flow becomes tight, maintenance and supplier payments are delayed, and legal exposure can increase rapidly. In larger portfolios, pockets of delinquency can often go undetected because data is stored in various spreadsheets and systems.
This client is a scale operator with over 10,000 tenants and a revenue base exceeding $10M. The dashboard reveals that, prior to its implementation, teams had partial lists of delinquent tenants and uncertain escalation criteria. This made it difficult to prioritize outreach, determine when to escalate a case to legal, and forecast recoverable cash in the near term.
The Collections Dashboard addresses these exact gaps. It aggregates tenant balances, classifies accounts by delinquency and amount, and surfaces property and tenant-level detail that collections agents and legal counsel can use to act quickly and consistently. The following sections explain how the dashboard was conceived, what it revealed, and how leadership can translate insights into recoveries and risk reduction.
Business Objectives
The dashboard development was scoped to deliver outcomes that matter to finance and operations leaders:
- Make outstanding rent exposure visible at both the tenant and property levels so leadership can quantify the near-term cash at risk.
- Prioritize collections outreach by dollar magnitude, aging, and legal readiness.
- Provide operational details that enable field teams and property managers to act immediately, including the name, property, amount, number of days overdue, and a suggested next step.
- Reduce legal and credit risk by surfacing accounts that meet escalation criteria and by tracking the progress of legal actions.
- Enable predictable cash flow planning by consolidating expected recoveries and pending liabilities for the CFO and operations head.
Talk with our BI experts today. Book a consultation session
Outcomes and Measurable Impact
Within weeks of deployment, the Collections Dashboard has become a central control layer for senior leadership, transforming scattered arrears data into a clear, risk-ranked view of portfolio exposure. It enables executives to quantify delinquency, understand concentration risks, and direct recovery efforts where they are most effective.
The following measurable outcomes illustrate how the dashboard converts raw signals into operational and financial impact:
1. Clear Visibility into Portfolio-Wide Exposure
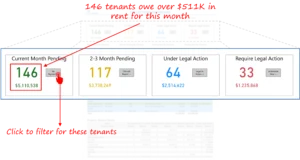
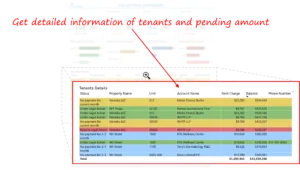
The dashboard identified ~150 delinquent tenants with over $0.5M in current-month dues, enabling leadership to immediately assess the month’s cash at risk.
This visibility established a structured prioritization sequence—ensuring that outreach teams focused first on the highest-value exposure buckets rather than pursuing accounts uniformly.
2. Stronger Focus on High-Aging and High-Risk Accounts
Aging analytics identified over 100 tenants with more than 90 days of non-payment, indicating cases that require urgent escalation and standardized case-management protocols.
By isolating these long-aging accounts, managers could initiate targeted interventions earlier, reducing the risk of balances compounding into legal or write-off territory.
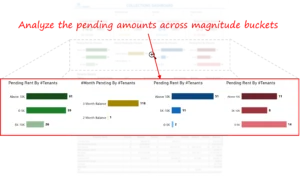
3. Identification of Large-Balance Concentration Risks
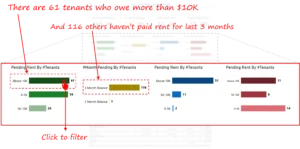
Exposure distribution revealed 60+ tenants each owing more than $10,000, representing a disproportionate share of financial risk.
This allowed leadership to prioritize one-to-one handling for these high-impact accounts and allocate senior recovery resources to where they could deliver the greatest return on investment.
4. Early Detection of Legal-Readiness Cases
The tool flagged accounts whose individual outstanding balances represented a significant share of the total exposure, bringing forward cases that warranted legal review.
By detecting these concentration outliers early, leadership gained a factual basis for escalation decisions, improving legal readiness and minimizing potential downstream liabilities.
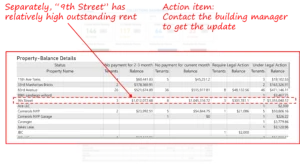
5. Property-Level Insight into Delinquency Patterns
Property drill-downs surfaced locations with unusually high exposure, enabling managers to understand on-site patterns, tenant mix issues, and recurring payment gaps.
This visibility helped regional leadership assign corrective actions, such as targeted outreach or building manager interventions, to properties with the largest arrears.
6. Embedded Operational Guidance that Accelerates Action
Each tenant record includes recommended next steps, such as contacting the owner, conducting a legal review, and confirming a payment plan, thereby reducing the need for manual reconciliation or offline coordination.
These integrated prompts shorten the gap between discovery and execution, enabling a more disciplined collections cadence.
Collectively, the dashboard provides leadership with a dollarized, fact-based view of collection risk, transforms unstructured arrears lists into a prioritized recovery worklist, and offers a repeatable operating model for collections, property management, and legal teams. This results in faster targeting, reduced exposure buildup, and more predictable cash-flow outcomes.
Our Approach
We designed the Collections Dashboard around the decisions the business must make every billing cycle: who to call, which cases to escalate, and what cash can be expected within the month.
Discovery and KPI definition
Workshops with heads of operations, collections agents, and legal counsel clarified the minimal KPIs required to act:
- Outstanding amount by tenant and by property.
- Aging buckets, including current, 30, 60, and 90 days overdue.
- Count of tenants by bucket and by exposure bracket.
- Legal action status and follow-up notes.
These KPIs align the dashboard to the same triage logic used by seasoned collections teams and counsel.
Data integration and validation
Data sources included property management exports and payment ledgers. The team cleaned tenant identifiers, reconciled outstanding balances, and standardized aging calculations to ensure the dashboard reflected verifiable financial records. Automated daily refreshes provide near real-time visibility for operational stand-ups.
Dashboard design and user experience
The dashboard shows a pragmatic layout designed for speed:
- Top-line summary that shows counts and dollar totals for pending, partially paid, and unpaid segments.
- Bucketed exposure view to filter tenants owing more than threshold amounts, such as $10,000, and to isolate multi-month delinquencies.
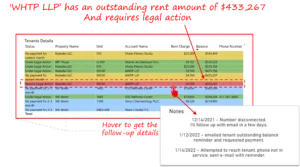
- Tenant detail card with outstanding amount, last payment date, suggested next step, and legal status, allowing agents to take action from the same screen.
- Property drill down to view all tenants tied to a property and to assign owner follow-up actions.
Design choices prioritized directness and actionability over decorative complexity, allowing agents to convert information into outreach in minutes rather than hours.
Iteration and stakeholder alignment
The dashboard was refined with feedback loops from collections and legal. For instance, the threshold for legal escalation and the definition of a high balance bucket were tuned so the dashboard aligns with real-world case management practices. The result is a tool that mirrors the organization’s risk appetite and legal process.
Key Learnings and Recommendations
From the dashboard development and deployment experience, the following practical lessons apply broadly to property firms seeking to restore healthy cash flow:
- Prioritize by dollar and aging, not by case count: The dashboard indicates that a small number of high-balance accounts pose a disproportionate risk. Start there.
- Embed the legal decision path inside the dashboard: Flag accounts that meet escalation criteria and include templates or checklists to speed legal intake.
- Make the tenant card the operational unit of work: If every account card contains the amount, days overdue, last contact, and next action, agents will spend their time collecting instead of compiling data.
- Surface property level hotspots for proactive engagement: Properties with concentrated delinquencies often respond to short-term incentives or manager interventions. Utilize the property drill-down to create targeted campaigns.
- Track progress and expected recoveries for finance: Produce a rolling view of expected collections this month so the CFO can plan cash flow and avoid surprise funding gaps.
Conclusion
The Collections Dashboard turned a manual, fragmented collections process into a prioritized, transparent recovery engine. By surfacing that 146 tenants account for more than $511,000 of near-term exposure, isolating the 61 tenants owing more than $10,000 each, and flagging named cases with $433,267 outstanding, the dashboard provides leadership with a defensible plan to recover cash and manage legal risk.
The path to recovery is straightforward. Start with the highest-dollar accounts, engage owners with a playbook provided on the tenant card, and track legal escalations within the same interface. Doing so converts exposure into recoveries and reduces future cash volatility.
If your sales or business development team faces similar challenges tracking complex pipelines across markets and targets, we would gladly share how a modern BI solution can unlock real, measurable value.
Each month, we curate the latest updates, insights, and trends for senior leaders in data analytics and AI in our CXO Analytics Newsletter.
Our mission is “to enable businesses to unlock value in data.” For over 20 years, we’ve partnered with more than 100 clients—from Fortune 500 companies to mid-sized firms—to solve complex data analytics challenges. Our services include Advanced Analytics Consulting, Generative AI Consulting, and Business Intelligence (Tableau Consulting, Power BI Consulting and Looker Consulting) turning data into strategic insight. We would love to talk to you. Do reach out to us for a free consultation.
Our Work
Industry
- Industry
Function
- Function
-
Increasing Conversions with Adwords Spend Optimizer
How To Optimize Adwords Budget in Real Time
Free Download


-
Markdown Optimization for Retailers
A Methodology to Track Performance and Maximize Value
Free Download
-
Optimizing Marketing Spend with Marketing Mix Modeling
Using Statistical Modeling and Empirical Methods
Free Download
-
Leveraging Web Analytics for Customer Acquisition
Leveraging Web Analytics for Customer Acquisition
Free Download
*Subscribe to be the first one to know our latest updates
Contact us

You have crafted a powerful analytical tool for us. Thank you.
Alan Benjamin
Principal, Benjamin Realty Advisors

I have been working with Chaitanya and Perceptive Analytics for about 20 months now. They did BI / reporting and excel tool development. Their work helped us in channeling our periodic reports to the senior and operational management. The team exceeded my expectations. Chaitanya would ask thought provoking questions that trigger a new line of thinking. They created good dashboards so our senior team can quickly interpret reports. We were able to make progress because the team knew finance and tools they created were easy to implement.
Samir Lavani
CFO at Pearl Hospitality

Chaitanya and the Perceptive Analytics team worked on multiple strategic projects that involved Tableau data visualizations. Perceptive's work (~ 1 year) led to successful launch of our portal - this was an important milestone for us. Visualizations created were insightful, easy to understand and visually attractive. The team often suggested ways to show data in more intuitive way so our audience can understand it. They also knew Tableau well that helped in customizing it for our purposes. The team worked hard to finish the project on time managing expectations. I look forward to working with Perceptive on other projects.
Haroon Yaqoob
Principal at Nomenclature Inc.
