
-
- Client: Global B2B payments platform, 1M+ customers in 100+ countries
- Challenge Faced by Client: Net Promoter Score (NPS) had steadily declined for last quarter, signaling growing dissatisfaction. Leadership lacked visibility into which customer groups were driving detractor responses or what operational issues caused the decline.
- Tools Used: Tableau, SQL, CRM data. These enabled data preprocessing, automated updates, and root-cause exploration through interactive dashboards.
- Solution: We developed a comprehensive NPS Analytics Dashboard that consolidated survey and CRM data into a single, real-time view. By segmenting scores across industry, geography, and customer acquisition channels, the dashboard revealed specific problem areas, which guided targeted operational fixes.
Impact:
- Client: Global B2B payments platform, 1M+ customers in 100+ countries
-
-
- Improved overall NPS by 27% within two quarters.
- Reduced registration-related complaints by 40%.
- Reduced leadership review time by 30% through real-time dashboards replacing static reports.
- Guided targeted operational changes through data, improving response times and decision speed.
- Improved overall NPS by 27% within two quarters.
-
Introduction and Business Context
In the fast-moving world of B2B digital payments, customer loyalty is won or lost through experience. With multiple onboarding steps, transaction verification processes, and compliance checks, even small operational issues can frustrate customers and erode trust.
A global payments leader had built a strong base of over a million customers but began noticing an unsettling pattern: despite product reliability, satisfaction scores were falling. Follow-up feedback mentioned issues like delayed onboarding, failed registration links, and slow response times.
Quarterly NPS summaries painted a worrying picture: detractor percentages had climbed for two quarters straight, but leadership couldn’t isolate why or where. Feedback came through surveys, CRM notes but none tied together in one view. Teams debated causes instead of aligning on solutions.
To regain customer trust, the company needed a clear, data-driven understanding of what was driving dissatisfaction and how to fix it.
Business Objectives
During discovery sessions with the Head of Customer Success, Product Management, and the Analytics team, we defined four measurable goals:
- Create a single source of truth for NPS with automatic weekly updates replacing lagging, quarterly reports.
- Segment NPS results by geography, industry, and account source (inbound vs. outbound) to pinpoint dissatisfaction clusters.
- Integrate qualitative review data to reveal the “why” behind detractor scores.
- Build executive dashboards to monitor performance trends and drive accountability through real-time insights.
These objectives aimed to transform NPS from a retrospective survey score into a forward-looking management tool guiding continuous improvement.
Our Approach
Our solution focused on designing a dashboard that told a clear story of customer experience while allowing unlimited exploration for deeper insights.
1. Discovery and Dashboard Blueprint
Our first step was to work with Customer Success, Product, and Regional leaders to agree on what NPS should measure and how it should be interpreted across the organization. These sessions ensured the final dashboard reflected the actual decision-making needs of the business.
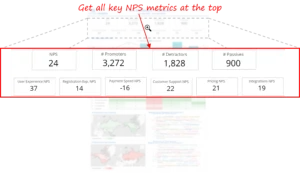
We clarified what leaders need at a glance:
- Overall NPS
- Promoters, passives, detractors
- Category-level NPS (User Experience, Registration, Customer Support, Payment Speed, Pricing, Integrations)
This guided our KPI-section where executives get all the key information to track at the top
We also identified which segments matter most:
- Industry
- Account source (inbound vs. outbound)
- Geography
- Usage/payment groups
- Experience categories
And, which Business questions to answer:
- Where exactly is the NPS decline coming from?
- Are new customers struggling more than existing ones?
- Is dissatisfaction tied to specific industries or regions?
- Does acquisition channel affect experience quality?
- Which parts of the customer journey need improvement?
This blueprint ensured the dashboard was not a collection of charts — but a guided story answering leadership’s real questions.
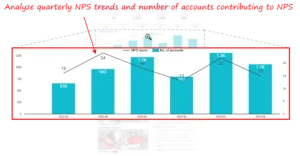
2. Trend Analysis and Insight Validation
We validated patterns using the dashboard’s time-series views:
- Quarterly NPS trend
- Quarterly promoter/detractor volume
- Seasonal shifts in sentiment
This allowed leaders to determine:
- Whether NPS drops were isolated or systemic
- Whether low scores aligned with rising detractor counts
- Whether satisfaction varied with account growth cycles
Outcome:
The dashboard confirmed that most of the decline occurred within a specific segment (new, outbound customers) rather than across the entire customer base.
3. Segmentation and Pattern Identification
Using Tableau, we segmented NPS across multiple business dimensions:
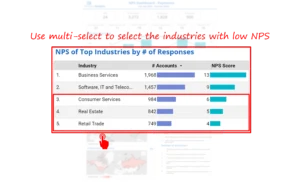
a. NPS by Industry Insight:
Business Services consistently outperformed Real Estate and Retail Trade, indicating experience differences by sector.

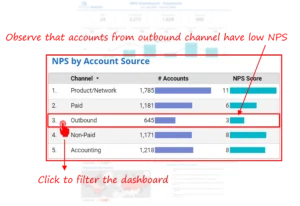
b. NPS by Account Source (Inbound vs. Outbound)
This view immediately highlighted the largest gap: Outbound accounts had significantly lower NPS across multiple quarters.
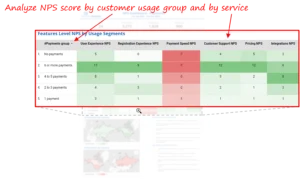
c. NPS by Usage/Payment Group
Heatmaps compared NPS across User Experience, Registration, Customer Support, Payment Speed, and Pricing.
Critical discovery:
New users (“1-payment” group) scored lowest on Registration Experience — pinpointing the first-touch friction.
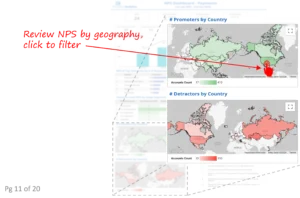
d. NPS by Geography
Geospatial maps highlighted promoter and detractor concentration across countries.
Finding:
Certain APAC markets showed disproportionately high detractor counts tied to onboarding issues.
4. Root-Cause Exploration Using Dashboard Filters
Using the dashboard’s built-in diagnostic capability we were able to extract the relevant granular details for decision making:

a. Reviews Panel
Promoter and detractor comments were displayed side by side. Users could filter comments by:
- Region
- Industry
- Channel
- Payment group
Behavioral pattern emerged:
Detractor comments repeatedly referenced issues like:
- Registration link failures
- Activation delays
- Incorrect or outdated onboarding steps
This way the dashboard allowed teams to connect the dots visually.

b. Multi-Level Filtering for Correlation Discovery
Using Tableau’s multi-select filters, leaders could combine views:
Example:
(Low NPS Industries) + (Outbound Accounts) + (1-payment users)
This instantly revealed where the customer experience was failing most severely.

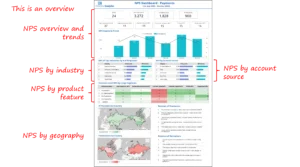
5. Visualization and Communication of Findings
We designed a layered dashboard structure to ensure fast insight consumption:
- Overview Layer – Total NPS, promoter/detractor counts, category-level NPS
- Trend Layer – Quarterly NPS movement
- Industry Layer – Top industries by response volume
- Account Source Layer – Inbound vs. outbound comparison
- Feature/Experience Layer – Heatmap of NPS by user experience category
- Geography Layer – Promoter/detractor world maps
- Review Layer – Comments, contextualized by selected filters
This structure enabled leadership to move seamlessly from:
“What is happening?” → “Where is it happening?” → “Why is it happening?” → “What do we fix first?”
Example: From Insight to Impact
During one quarterly review, the dashboard showed an unexpected dip in NPS in APAC regions, primarily driven by outbound accounts.
Drilling deeper, analysts noticed that “1-payment” users frequently mentioned “registration link failed.” Cross-checking with the technology team confirmed intermittent link outages in specific markets.
Within two weeks, the registration flow was redesigned, support scripts were updated, and onboarding communication templates were revised.
In the next quarter, NPS for outbound APAC accounts improved by 25%, and registration-related support tickets dropped by 40%.
Outcomes and Measurable Impact
Upon deployment, the dashboard replaced fragmented reports with up-to-date, actionable visibility.
Key Results:
- 27% overall NPS improvement within two quarters after implementation.
- 40% reduction in registration-related complaints.
- 20% increase in satisfaction among new users (1-payment group).
- Faster leadership decision cycles due to automated updates and intuitive visualization.
Beyond metrics, the dashboard reshaped culture. Leadership reviews shifted from debating metrics to prioritizing solutions, collaboration on ownership between Product, CX, and Technology teams.
User Testing and Rollout
We conducted two agile sprints to refine usability.After deployment, CX managers reported a 40% reduction in decision making time and a significant rise in adoption by various customer success teams, the dashboard became prominent in weekly reviews.
Executives appreciated that insights were no longer abstract but anchored in customer voices, what customers actually said, not just how they scored.
Key Learnings
- Customer experience is segment-specific, not universal.
NPS only becomes actionable when broken down by channel, geography, industry, and lifecycle stage. Aggregated scores often hide the real drivers of dissatisfaction. - Early-stage customer experience has outsized impact.
A customer’s first interaction, registration, onboarding, activation often determines long-term loyalty. Monitoring NPS at these early touchpoints is essential for preventing downstream churn. - Geographic and operational context matters.
Due to differences in payment infrastructure, partner banks, support responsiveness, and regulatory requirements across regions influence customer sentiment and must be measured carefully. - Simple, structured dashboards drive adoption.
CXO adoption is highest when dashboards are organized logically, starting with global visibility, then enabling deeper exploration into the drivers behind promoter and detractor patterns. - Real-time visibility builds organizational accountability.
When NPS updates automatically and becomes part of recurring leadership rhythms, teams respond to issues faster and align more effectively around customer outcomes.
Recommendations
- Integrate NPS into regular business reviews so that customer sentiment becomes a continuous performance metric rather than a periodic survey result.
- Adopt segmentation-based experience management, using industry, geography, channel, and lifecycle stage to identify where tailored interventions can drive the biggest impact.
- Link NPS to operational indicators such as onboarding completion, ticket volume, and time-to-resolution to uncover the operational levers behind customer sentiment.
- Develop targeted action playbooks for segments with recurring detractor patterns, ensuring consistent responses across teams.
- Anchor CX and operations conversations in dashboards, not static reports, to promote faster diagnosis, clearer storytelling, and data-driven decision-making.
- Establish cross-functional ownership of customer experience, involving Customer Success, Product, Technology, and regional teams in interpreting signals and executing improvements.
Each month, we curate the latest updates, insights, and trends for senior leaders in data analytics and AI in our CXO Analytics Newsletter.
Our mission is “to enable businesses to unlock value in data.” For over 20 years, we’ve partnered with more than 100 clients—from Fortune 500 companies to mid-sized firms—to solve complex data analytics challenges. Our services include Advanced Analytics Consulting, Generative AI Consulting, and Business Intelligence (Tableau Consulting, Power BI Consulting and Looker Consulting) turning data into strategic insight. We would love to talk to you. Do reach out to us for a free consultation.
Our Work
Industry
- Industry
Function
- Function
-
Increasing Conversions with Adwords Spend Optimizer
How To Optimize Adwords Budget in Real Time
Free Download


-
Markdown Optimization for Retailers
A Methodology to Track Performance and Maximize Value
Free Download
-
Optimizing Marketing Spend with Marketing Mix Modeling
Using Statistical Modeling and Empirical Methods
Free Download
-
Leveraging Web Analytics for Customer Acquisition
Leveraging Web Analytics for Customer Acquisition
Free Download
*Subscribe to be the first one to know our latest updates
Contact us

You have crafted a powerful analytical tool for us. Thank you.
Alan Benjamin
Principal, Benjamin Realty Advisors

I have been working with Chaitanya and Perceptive Analytics for about 20 months now. They did BI / reporting and excel tool development. Their work helped us in channeling our periodic reports to the senior and operational management. The team exceeded my expectations. Chaitanya would ask thought provoking questions that trigger a new line of thinking. They created good dashboards so our senior team can quickly interpret reports. We were able to make progress because the team knew finance and tools they created were easy to implement.
Samir Lavani
CFO at Pearl Hospitality

Chaitanya and the Perceptive Analytics team worked on multiple strategic projects that involved Tableau data visualizations. Perceptive's work (~ 1 year) led to successful launch of our portal - this was an important milestone for us. Visualizations created were insightful, easy to understand and visually attractive. The team often suggested ways to show data in more intuitive way so our audience can understand it. They also knew Tableau well that helped in customizing it for our purposes. The team worked hard to finish the project on time managing expectations. I look forward to working with Perceptive on other projects.
Haroon Yaqoob
Principal at Nomenclature Inc.
