


Reactivating Dealer Locations with Targeted Analytics: A Case Study in Multi-Region Distribution
Executive Summary
- Client: A national distributor managing a multi-region network of dealers
- Challenge: Limited visibility into dormant dealer locations and inefficient follow-up strategies
- Tools Used: Tableau, SQL, Excel
- Solution: Built a Dormant Dealer Dashboard to track inactive locations, monitor reactivation trends, and prioritize engagement
- Impact:
- Reengaged 150+ dormant locations within two quarters
- Helped drive over 6% of quarterly revenue through reactivated accounts
- Reduced dealer targeting effort by 65%
- Equipped regional teams with actionable insights at the location level
- Reengaged 150+ dormant locations within two quarters
Introduction and Business Context
Dealer networks are the lifeline of many B2B distributors. But over time, dealer activity is not evenly distributed. Some locations become quiet, with orders being stopped, engagement dropping, and fading from planning conversations. While this may happen gradually, the revenue loss adds up quickly.
Our client, a leading distributor with hundreds of dealer locations nationwide, recognized that dormant accounts represented untapped potential. However, their sales and regional teams struggled with identifying these locations promptly. struggled with identifying these locations promptly. Inactive dealers were often buried in spreadsheets or only flagged after 3–4 months of inactivity, by which time competitor relationships had often already been established.
Multiple systems held parts of the truth. Sales order data was sourced from the ERP, customer engagement history from the CRM, and territory-level planning from Excel trackers. But no consolidated view existed to answer simple, urgent questions:
- Which dealer locations have gone inactive in the past 3–6 months?
- Which of those have resumed activity recently?
- Are reactivated dealers maintaining volume, or going dormant again?
- Which regions have the highest dormant dealer concentration?
To answer these questions and turn missed opportunities into measurable growth, the client partnered with us to build a Dormant Dealer Dashboard, an interactive, scalable solution to track, reactivate, and manage dealer health by location.
Business Objectives
The dashboard was designed with five clear business objectives:
- Identify dormant dealer locations quickly
Detect which locations had stopped placing orders in a defined window. - Track dealer reactivation trends
Monitor which previously dormant dealers resumed ordering, and how their sales evolved. - Analyze post-reactivation performance
Understand which product categories drove reorders and whether reactivated locations sustained volume. - Accelerate targeted dealer outreach
Make it easy for sales reps to focus on high-priority reactivation targets using ready-to-export lists. - Improve regional sales strategy
Provide regional leaders with actionable insights on dealer status, reactivation impact, and territory gaps.
Key Features of the Dashboard and Their Benefits
To solve these challenges, we designed a streamlined Dormant Dealer Dashboard in Tableau, specifically for daily use by sales reps, territory managers, and commercial leaders. Each section of the dashboard directly supported one or more business objectives, reducing manual effort, improving targeting, and driving measurable results.
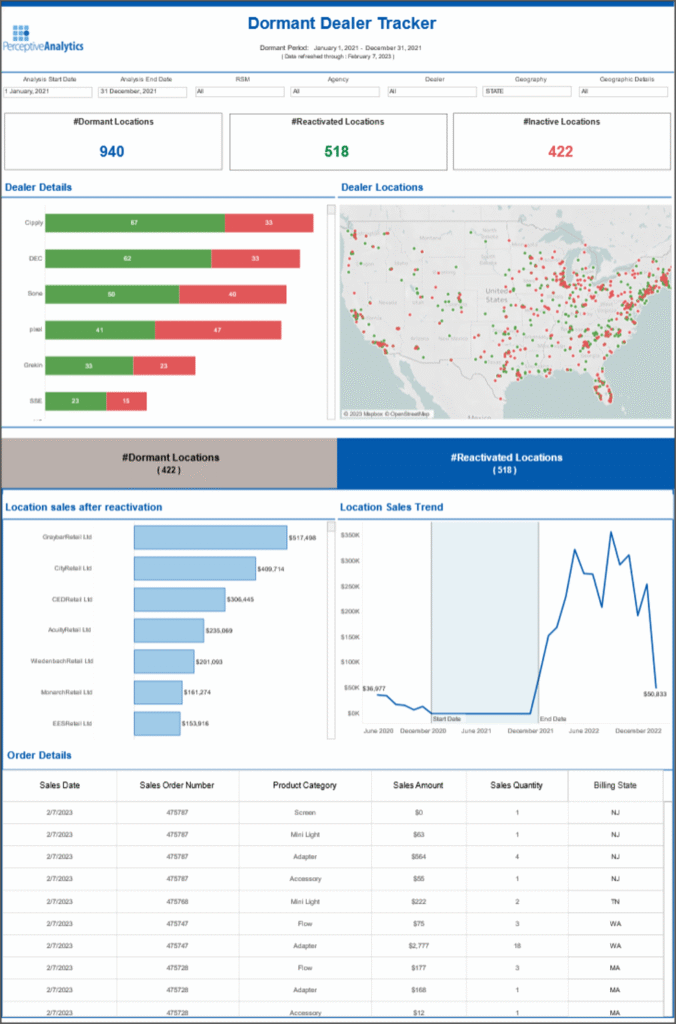
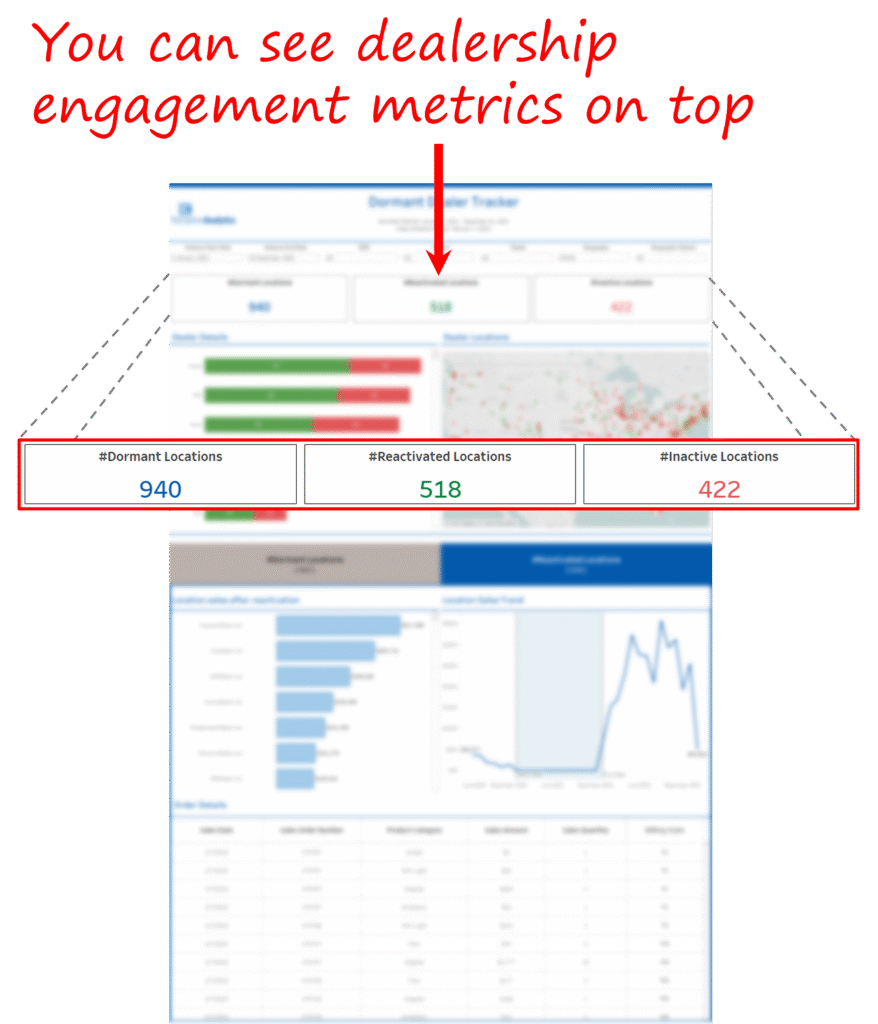
- Dealer Status Overview Panel
Objective: Identify Dormant Dealers
What it did:
Summarized total counts of active, dormant, and reactivated locations for the current time window.
Why it helped:
Provided a real-time pulse of dealer engagement, refreshing daily, and allowed reps and managers to assess changes in dealer health within days instead of quarterly reviews, enabling earlier intervention in underperforming locations and faster support for high-growth ones.
Business Benefit:
- Became a staple in weekly performance reviews
- Helped sales teams act before revenue loss became irreversible
- Triggered follow-up in regions where dormancy was creeping up
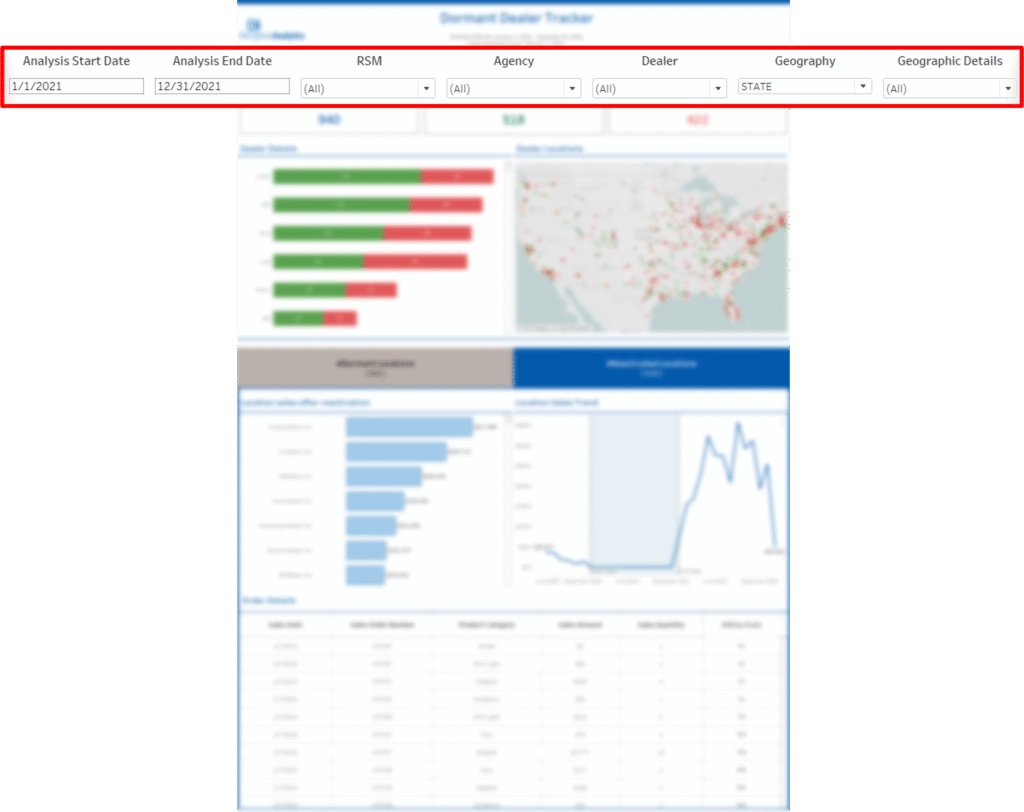
- Dormant Dealer List with One-Click Filters
Objective: Targeted Outreach
What it did:
Users could filter and export lists of dormant dealers by dealer group, region, or RSM in under a minute. These exports were formatted for direct upload into the CRM, allowing sales reps to trigger targeted outreach campaigns immediately after the list was pulled.
Why it helped:
Previously, reps spent 4–6 hours a week identifying dormant locations from multiple spreadsheets. This tool reduced the task to minutes.
Business Benefit:
- 65% reduction in time spent identifying accounts
- Consistent reactivation lists shared across sales and support
- Made dormant account targeting part of the standard operating rhythm
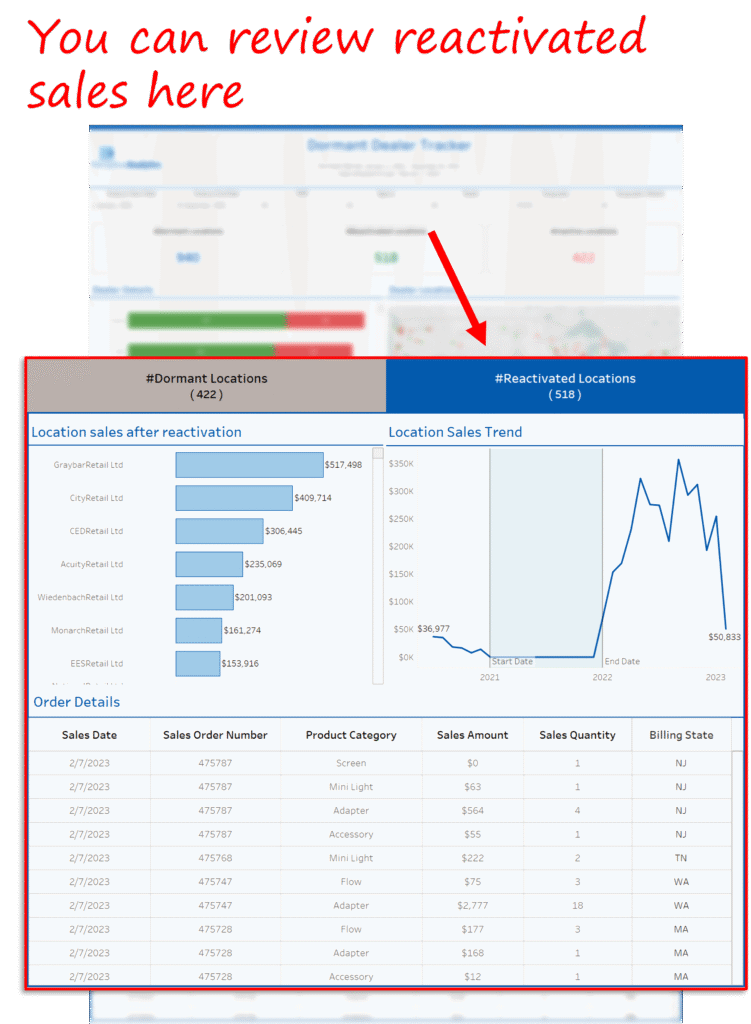
- Dealer Reactivation Tracker
Objective: Track Reactivation Trends
What it did:
Flagged dealers who had resumed orders after dormancy, showing timing, volume, and whether activity was sustained.
Why it helped:
Sales teams could see what outreach worked, and when dealers dropped back into inactivity, helping them refine timing and follow-up cadence.
Business Benefit:
- Reactivated 150+ dealer locations in two quarters
- 6.3% of quarterly revenue attributed to reactivated accounts
- Enabled programmatic tracking of retention and dormancy
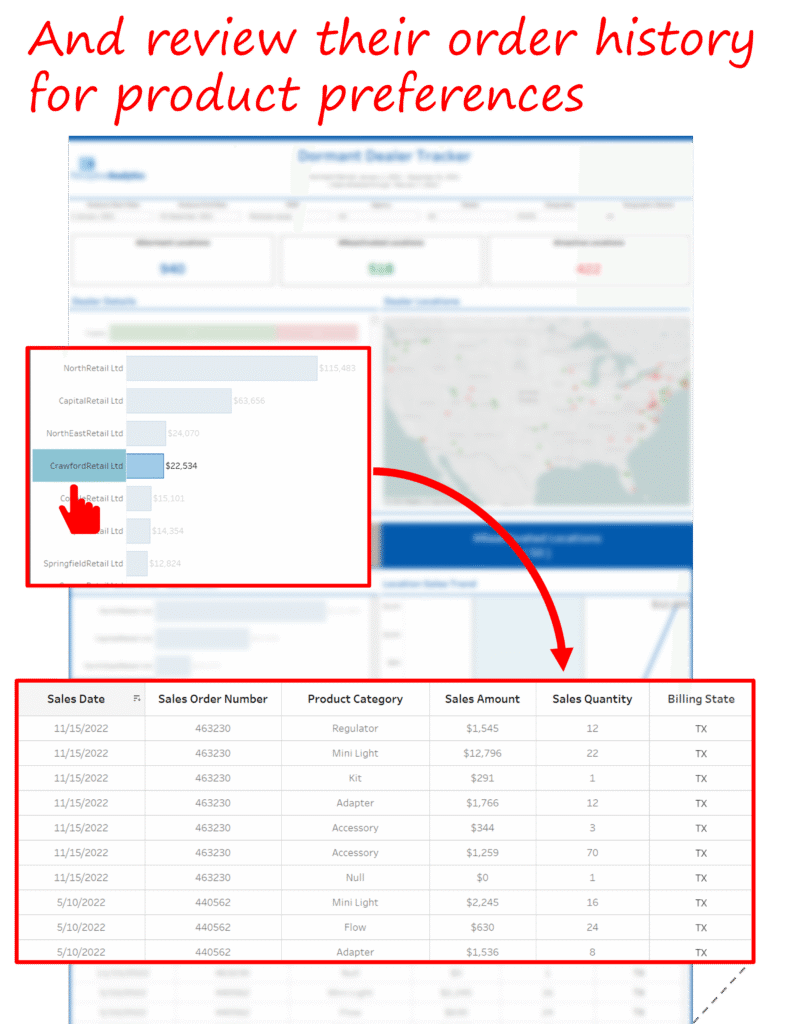
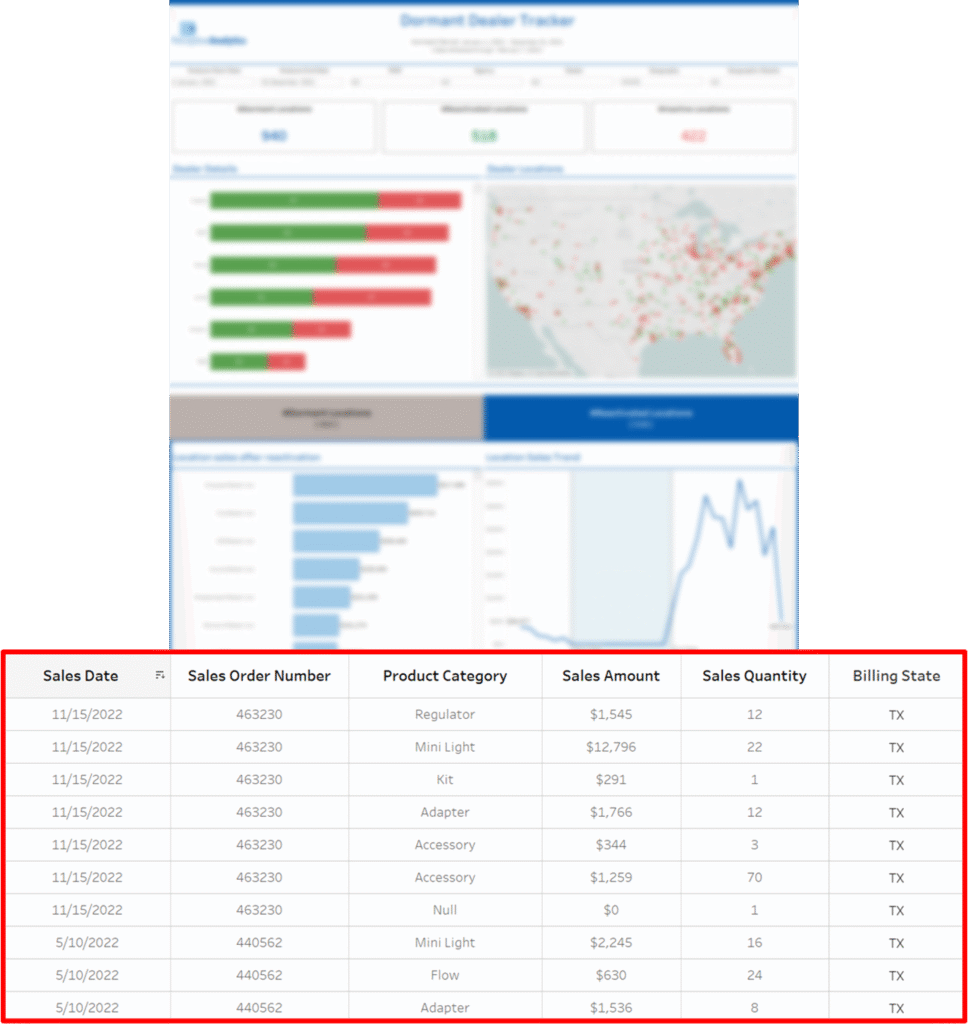
- Product-Level Reorder Insight
Objective: Post-Reactivation Sales Analysis
What it did:
Broke down sales by category for reactivated accounts—identifying which SKUs were leading recovery.
Why it helped:
Helped reps understand which product lines were gaining traction and tailor upsell/cross-sell offers accordingly.
Business Benefit:
- Triggered focused offers based on recent reorder behavior
- Supported smart bundling of related products
- Enabled category-level recovery tracking
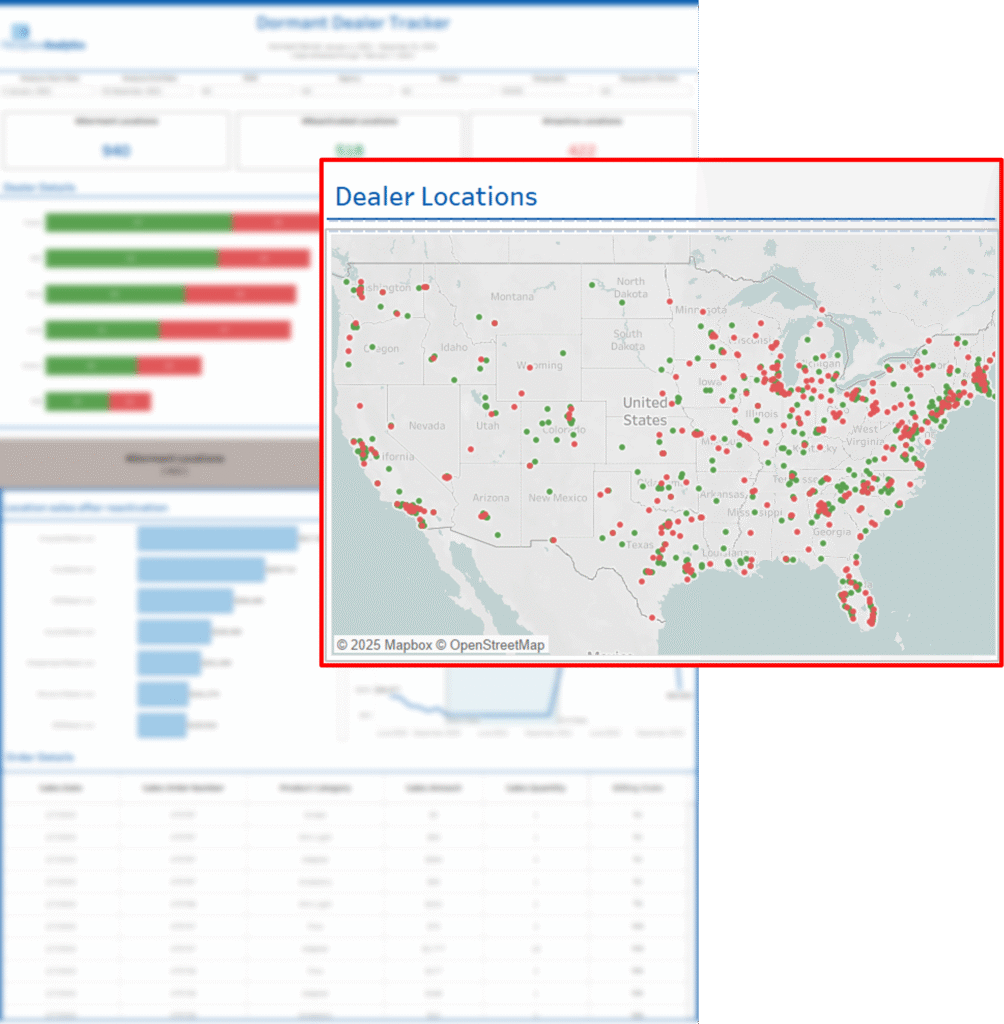
- Regional Engagement Map
Objective: Regional Strategy & Planning
What it did:
An interactive map visualized dormant and reactivated dealers by region, color-coded to show status distribution.
Why it helped:
Regional heads quickly saw where engagement was dropping off and which territories had the highest reactivation success.
Business Benefit:
- Helped prioritize field rep deployment
- Revealed dormant dealer clusters in overlooked regions
- Led to a 9–12% improvement in dealer activity in Southeast and Central zones
- Dealer Deep Dive View
Objective: Efficient Account Planning
What it did:
Provided a 360-degree view of any dealer location: order history, status, recent activity, and segment classification.
Why it helped:
Reps preparing for calls no longer had to dig through ERP or CRM; everything they needed was in one place.
Business Benefit:
- Reduced pre-call prep time by 40–50%
- Helped tailor outreach messaging with better timing and relevance
- Increased reactivation conversion with more informed follow-up
Business Impact and Measurable Outcomes
The dashboard was not just a reporting tool—it became a catalyst for reactivating value within the dealer base. Quantifiable results followed quickly:
- Dealer Reactivation at Scale
- 150+ dormant dealer locations reactivated within two quarters
- Accounted for 6.3% of quarterly revenue, previously at risk
- Time Savings for Sales Teams
- Dormant targeting time dropped by 4–5 hours/week per rep
- Less time in spreadsheets = more time in customer conversations
- Territory-Level Improvement
- Regional leaders used dashboard insights to plan interventions
- Southeast and Central regions improved dealer engagement by 9–12%, measured by increased order placements and higher response rates to sales outreach.
- Smarter Leadership Reporting
- Dormancy, reactivation, and post-order health became standard KPIs
- Dashboards are used in monthly commercial reviews by the Chief Revenue Officer (CRO), territory heads, regional sales managers, and national account leaders, ensuring that strategic decisions are driven by consistent, data-backed insights across all leadership levels.
Our Approach
Though the dashboard is what delivered the outcomes, it was shaped by careful collaboration and focused design.
- Discovery and KPI Alignment
We ran scoping sessions with sales reps, BI teams, and territory leaders to define:
- What made a dealer “dormant”
- What success looked like post-reactivation
- What data users used, and what was ignored in planning
Pain points included:
- Time-consuming list generation
- No way to track whether reactivation sustained
- Lack of territory-level trend data
This formed the foundation for every feature we built.
- Data Preparation and Validation
We consolidated and cleaned data from multiple systems:
- Merged ERP (orders), CRM (dealer info), and Excel (mapping)
- Created dormancy flags and reactivation timelines
- Validated all outputs with live dealer cases and sales reports
- Testing and Rollout
After the initial build, we ran a pilot with regional sales leads. Their feedback improved filter logic, added user-defined time windows.
Key Insights and Recommendations
- Dormancy Is a Silent Risk, Make It Visible
Unnoticed dormant dealers cause slow revenue leaks. Dashboards like this make the problem measurable and solvable.
- Design Around Frontline Needs
The dashboard succeeded because it helped reps act, not just observe. Every feature reduces friction in their workflow.
- Segment by Location, Not Just Account
Many dealers operate multiple branches. Tracking at the location level gave the business sharper visibility into engagement.
- Reactivation Is More Than Outreach
Tracking post-reactivation performance is key to sustaining growth. This dashboard helped monitor outcomes, not just actions.
Conclusion
The Dormant Dealer Dashboard helped the client move from fragmented insight to focused action. By identifying dormant locations earlier, supporting outreach with data, and tracking post-reengagement sales trends, the business unlocked a new layer of growth, right within its existing network.
This case reinforces a simple truth: Retaining and reactivating the right accounts can be as powerful as acquiring new ones—if you have the visibility to act on time.
Each month, we curate the latest updates, insights, and trends for senior leaders in data analytics and AI in our CXO Analytics Newsletter.
Our mission is “to enable businesses to unlock value in data.” For over 20 years, we’ve partnered with more than 100 clients—from Fortune 500 companies to mid-sized firms—to solve complex data analytics challenges. Our services include Advanced Analytics Consulting, Generative AI Consulting, and Business Intelligence (Tableau Consultants, Power BI Consultants and Looker Consultants) turning data into strategic insight. We would love to talk to you. Do reach out to us for a free consultation.
Our Work
Industry
- Industry
Function
- Function
-
Increasing Conversions with Adwords Spend Optimizer
How To Optimize Adwords Budget in Real Time
Free Download
-
Markdown Optimization for Retailers
A Methodology to Track Performance and Maximize Value
Free Download
-
Optimizing Marketing Spend with Marketing Mix Modeling
Using Statistical Modeling and Empirical Methods
Free Download
-
Leveraging Web Analytics for Customer Acquisition
Leveraging Web Analytics for Customer Acquisition
Free Download
*Subscribe to be the first one to know our latest updates
Contact us

You have crafted a powerful analytical tool for us. Thank you.
Alan Benjamin
Principal, Benjamin Realty Advisors

I have been working with Chaitanya and Perceptive Analytics for about 20 months now. They did BI / reporting and excel tool development. Their work helped us in channeling our periodic reports to the senior and operational management. The team exceeded my expectations. Chaitanya would ask thought provoking questions that trigger a new line of thinking. They created good dashboards so our senior team can quickly interpret reports. We were able to make progress because the team knew finance and tools they created were easy to implement.
Samir Lavani
CFO at Pearl Hospitality

Chaitanya and the Perceptive Analytics team worked on multiple strategic projects that involved Tableau data visualizations. Perceptive's work (~ 1 year) led to successful launch of our portal - this was an important milestone for us. Visualizations created were insightful, easy to understand and visually attractive. The team often suggested ways to show data in more intuitive way so our audience can understand it. They also knew Tableau well that helped in customizing it for our purposes. The team worked hard to finish the project on time managing expectations. I look forward to working with Perceptive on other projects.
Haroon Yaqoob
Principal at Nomenclature Inc.
