


How We Delivered Real-Time Sales Pipeline Visibility for a Leading Construction Firm Using Advanced Power BI Analytics
Executive Summary
- Client: Mid-sized US construction firm with 700–1000 employees
- Challenge Faced by Client: Limited, fragmented pipeline tracking and no centralized analytics
- Tools Used: Power BI, CRM integration, DAX, Power Query
- Solution: We meticulously designed a robust, interactive Pipeline Dashboard with advanced data modeling and dynamic drill-through functionality, ensuring it met the specific needs of the client’s sales team.
- Impact: Faster bid planning, better win/loss insights, actionable sales decisions.
Introduction & Business Context
Managing a healthy pipeline is the backbone for sustainable growth in the construction industry. For mid-sized and large firms, sales teams handle dozens of bids simultaneously, each with tight deadlines, multiple stakeholders, and shifting priorities.
Our client, a well-established US-based construction firm with nearly 1,000 employees, faced this familiar but critical challenge. The manual and complex task of tracking the status of all active bids was a significant burden, often costing each sales manager 5 to 7 hours every week just to gather updates scattered across spreadsheets and emails. Multiple spreadsheets, static reports, and emails made it hard for the Head of Sales and their team to know exactly:
- Which opportunities were actively in play, which were lost, and which were yet to be submitted?
- What bids required immediate action to meet submission deadlines?
- How did won/lost bids vary by market, target sector, or opportunity size?
The team depended on calls and email follow-ups for basic status checks without a reliable source. This constant back-and-forth slowed down planning and sometimes caused them to miss submission deadlines for high-value bids.
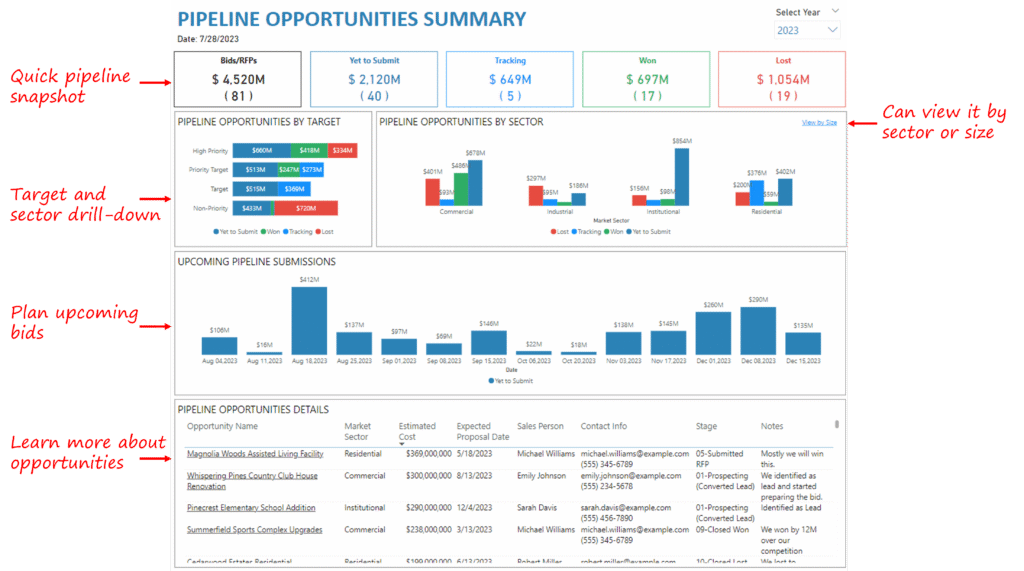
Recognizing the need to modernize, the firm engaged us to design a unique, centralized, real-time Pipeline Opportunities Dashboard using Power BI — bringing together their CRM data and custom bid tracking in one clear, interactive view with features like cross-filtering and dynamic drill-down.
Business Objectives
To align the sales team and leadership, we defined five clear goals for this engagement:
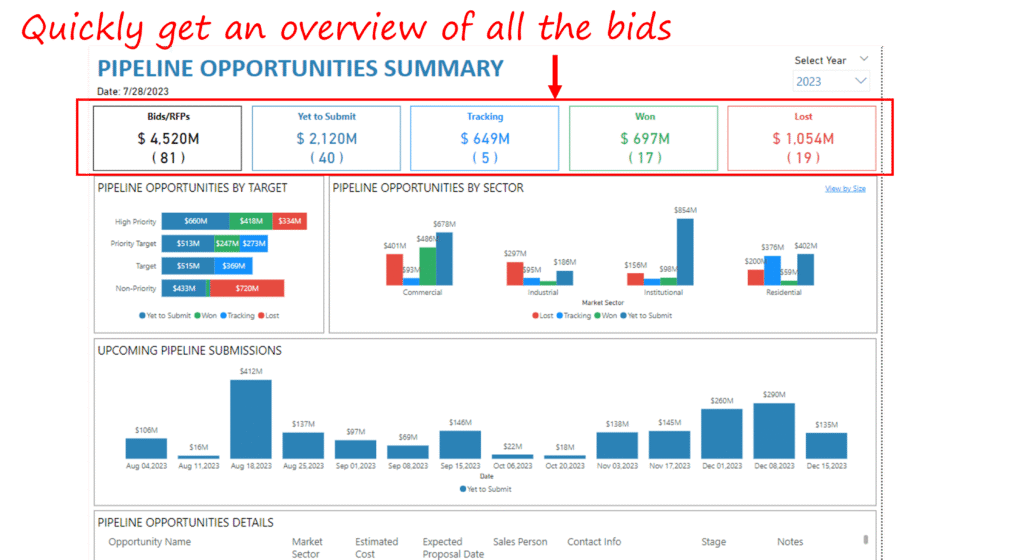
- Provide a real-time, unified view of the entire bid pipeline, covering won, lost, not yet submitted, and those currently in progress.
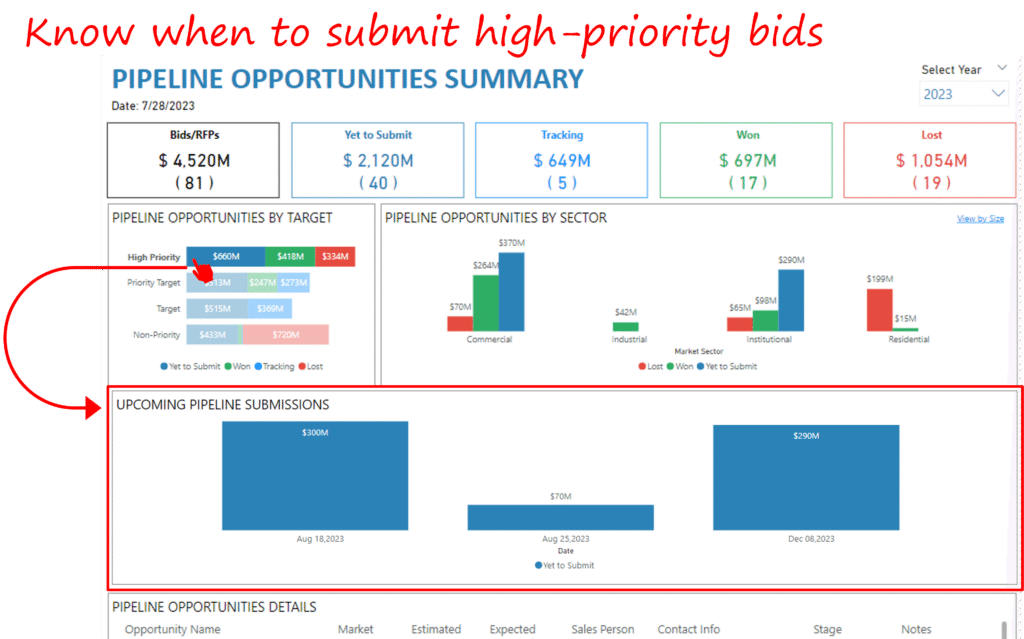
- Enable quick planning and prioritization for high-value or urgent bids.
- Allow deep drill-down by sector, market, or bid size for strategic targeting.
- Support cross-filtering so sales leaders can answer ad-hoc questions without extra work.
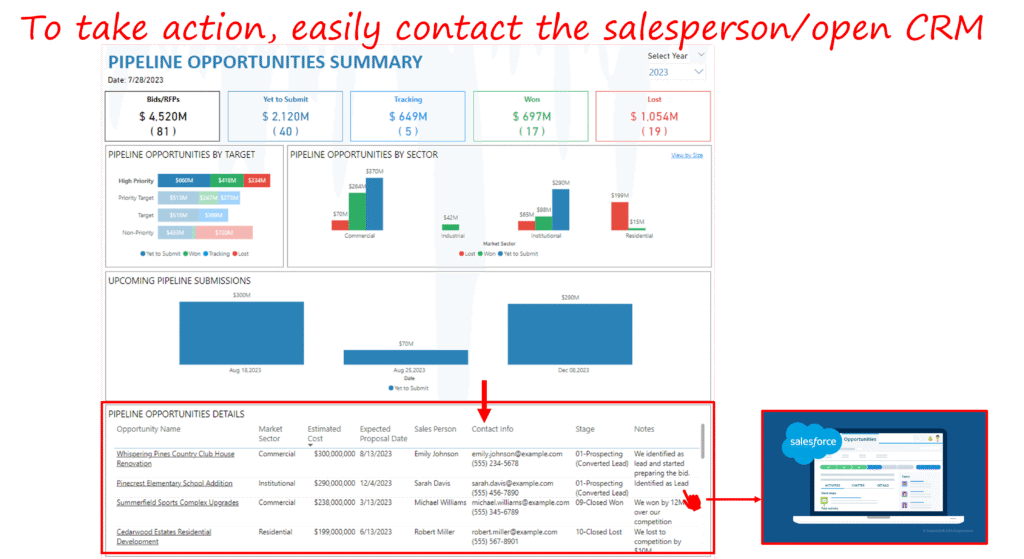
- Help the team act faster with immediate access to bid details and CRM contact info.
Outcomes & Measurable Impact
Our developed Pipeline Opportunities Dashboard quickly became a go-to resource for the sales team and leadership. Within weeks, the firm saw tangible improvements:
- Faster pipeline planning: Sales leaders can now see high-priority bids at risk of missing deadlines and take action days sooner.
- Better Win/Loss tracking: The team clarified why certain bids were lost, driving more intelligent decisions.
- Time saved: What used to take multiple spreadsheets and manual updates now runs automatically, freeing up almost 60% of the time previously spent on status tracking. This significant time saving has allowed the sales team to focus on more strategic tasks, increasing productivity.
- Higher Conversion Potential: Sales managers report better focus on must-win bids, thus helping protect revenue targets in competitive markets. This increased focus and control over their bids has instilled a new level of confidence in their decision-making.
- Embedded action buttons to open CRM records directly, thus preventing the need to hunt for contact details in separate tools.
Our Approach
We knew success hinged on more than just visuals. We had to design a robust and clean data model, and an intuitive front-end dashboard that even non-technical sales team members could adopt quickly.
Discovery & KPI Definition
We began with discovery sessions with the Head of Sales and senior business developers. We mapped the full bid lifecycle from initial identification to submission, negotiation, win/loss, and closure.
Key questions guided our KPI blueprint:
- Which pipeline stages matter most for real-time tracking?
- What metrics influence bid prioritization?
- How should bid status data link with market or sector breakdowns?
- What CRM fields should be visible for quick action?
By answering these, we ensured the final dashboard focused on the information the sales team uses to make faster daily decisions.
By the end of discovery, we had a defined list of critical KPIs:
- Total bids by status (yet to submit, tracking, won, lost)
- Priority level and submission deadlines
- Bid size and market segment
- Responsible salesperson and CRM details
- Win rate % by target market.
Data Architecture & Integration
The technical backbone integrates data from the firm’s CRM and bid tracker spreadsheets. We used Power Query to:
- Connect to multiple data sources
- Perform ETL (Extract, Transform, Load) steps, including removing duplicates, correcting inconsistencies in bid status or sector naming, and standardizing date formats.
- Merge related tables, for example, salesperson contact info tied to each bid.
We set up a scheduled refresh through Power BI’s data gateway to maintain up-to-date numbers, ensuring the dashboard always reflected the latest bid changes without manual updates.
Data Modeling & DAX
One major technical success factor was building a clean, scalable data model in Power BI. We designed clear relationships between fact tables (bids) and dimension tables (markets, sectors, sales teams).
Key technical highlights:
- Created calculated columns to flag high-priority bids based on custom thresholds (e.g., bid size + deadline).
- Developed DAX measures to calculate dynamic win rates, average bid size by sector, and bid deadlines.
- Added dynamic measures for lost bid reasons, giving leaders insights into repeat patterns.
We added row-level security so only authorized sales managers could view or slice sensitive pipeline details for their regions.
Dashboard UX Design & Visual Analytics
Designing the visual layer was equally critical. We aimed to make it as intuitive and straightforward as possible, while still powerful for deep ad-hoc exploration.
Key design decisions:
- Used cards and KPI tiles for a quick snapshot of total bids by status.
- Added stacked bar and funnel charts to visualize pipeline progression from submitted to won/lost.
- Enabled cross-filtering so selecting a market instantly updates every visual on the page.
- Added drill-through pages, for example, clicking a lost bid opens its full details, lost reasons, and contact info.
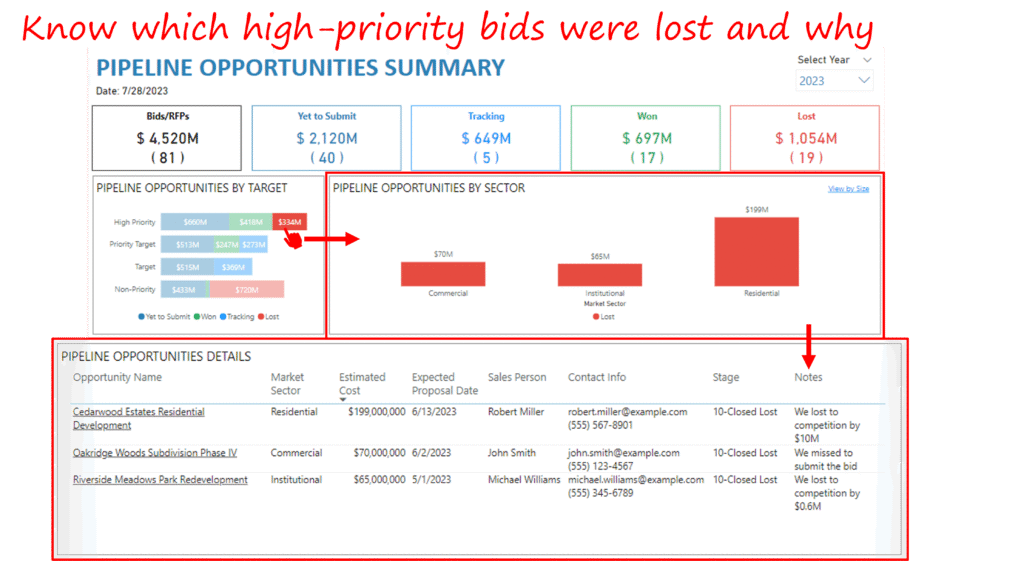
- To encourage adoption, we stuck to a clear, familiar color scheme: green for won bids, red for lost, and blue for pending. Sales managers appreciated this during leadership reviews because it made status updates easier to read and eliminated any second-guessing during quick meetings.
Testing & Stakeholder Review
Before the final rollout, we conducted agile sprints of stakeholder demos:
- Validated all filter combinations and drill-through pages worked smoothly.
- Fine-tuned visuals to avoid clutter and ensure fast load times.
- Minor UX tweaks were added based on direct feedback from field sales managers.
Performance was optimized for real-time use: data refreshes run daily with a 30-minute buffer before morning sales stand-ups.
Key Technical Learnings & Recommendations
A few key lessons stand out from this engagement:
- Robust Data Modeling pays off: Upfront investment in clean relationships and relevant measures keeps analysis fast and trustworthy.
- Design for self-service: The best dashboards empower non-technical users to explore freely. Cross-filtering, drill-throughs, and transparent tooltips become essential here.
- Keep data fresh: Real-time or near-real-time refreshes mean leaders trust the numbers and rely less on gut feel.
- Close the loop: Showing lost bid reasons inside the dashboard immediately sparked new conversations about improving proposals and timelines.
Each month, we curate the latest updates, insights, and trends for senior leaders in data analytics and AI in our CXO Analytics Newsletter.
Our mission is “to enable businesses to unlock value in data.” For over 20 years, we’ve partnered with more than 100 clients—from Fortune 500 companies to mid-sized firms—to solve complex data analytics challenges. Our services include Advanced Analytics Consulting, Generative AI Consulting, and Business Intelligence (Tableau Consultants, Power BI Consultants and Looker Consultants) turning data into strategic insight. We would love to talk to you. Do reach out to us for a free consultation.
Our Work
Industry
- Industry
Function
- Function
-
Increasing Conversions with Adwords Spend Optimizer
How To Optimize Adwords Budget in Real Time
Free Download
-
Markdown Optimization for Retailers
A Methodology to Track Performance and Maximize Value
Free Download
-
Optimizing Marketing Spend with Marketing Mix Modeling
Using Statistical Modeling and Empirical Methods
Free Download
-
Leveraging Web Analytics for Customer Acquisition
Leveraging Web Analytics for Customer Acquisition
Free Download
*Subscribe to be the first one to know our latest updates
Contact us

You have crafted a powerful analytical tool for us. Thank you.
Alan Benjamin
Principal, Benjamin Realty Advisors

I have been working with Chaitanya and Perceptive Analytics for about 20 months now. They did BI / reporting and excel tool development. Their work helped us in channeling our periodic reports to the senior and operational management. The team exceeded my expectations. Chaitanya would ask thought provoking questions that trigger a new line of thinking. They created good dashboards so our senior team can quickly interpret reports. We were able to make progress because the team knew finance and tools they created were easy to implement.
Samir Lavani
CFO at Pearl Hospitality

Chaitanya and the Perceptive Analytics team worked on multiple strategic projects that involved Tableau data visualizations. Perceptive's work (~ 1 year) led to successful launch of our portal - this was an important milestone for us. Visualizations created were insightful, easy to understand and visually attractive. The team often suggested ways to show data in more intuitive way so our audience can understand it. They also knew Tableau well that helped in customizing it for our purposes. The team worked hard to finish the project on time managing expectations. I look forward to working with Perceptive on other projects.
Haroon Yaqoob
Principal at Nomenclature Inc.
