Executive Summary
- Client: A leading food manufacturing company with $600M annual revenue and 500 employees.
- Challenge: Rising IT vendor spend lacked transparency and root cause visibility, creating inefficiencies and potential budget leakages.
- Tools Used: Tableau, SQL, and invoice-level integration.
- Solution: Built an IT Vendor Spend Analytics Dashboard that delivered real-time spend visibility across categories, vendors, and services.
- Impact:
- Identified excessive spending contributing to nearly 12% of the total IT budget.
- Reduced vendor-related inefficiencies, driving an estimated 8–10% savings annually.
- Enabled proactive budget decisions, cutting reporting time by 70%.
- Improved CXO-level clarity with invoice-level drilldowns, reducing dependency on IT managers.
- Identified excessive spending contributing to nearly 12% of the total IT budget.
Introduction and Business Context
The client, a fast-growing food manufacturing company with more than $600M in annual revenue, faced escalating IT costs. With over 500 employees relying on digital infrastructure, IT vendor contracts and service costs represented one of the largest overheads.
The challenge was not the spending itself but the opacity in understanding where the money was going. While invoices existed, there was no consolidated, visual way for CXOs to pinpoint waste, identify expensive vendors, or analyze month-to-month surges.
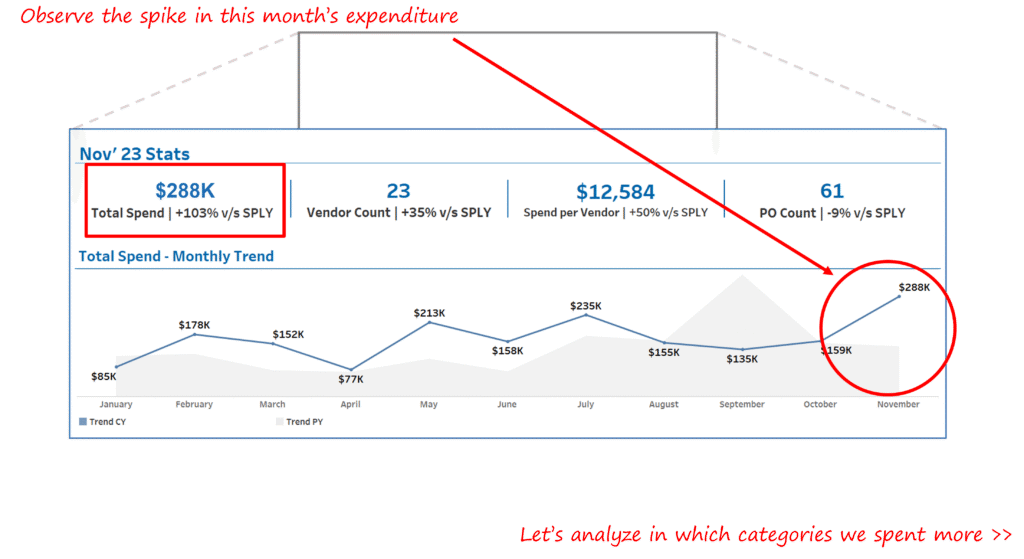
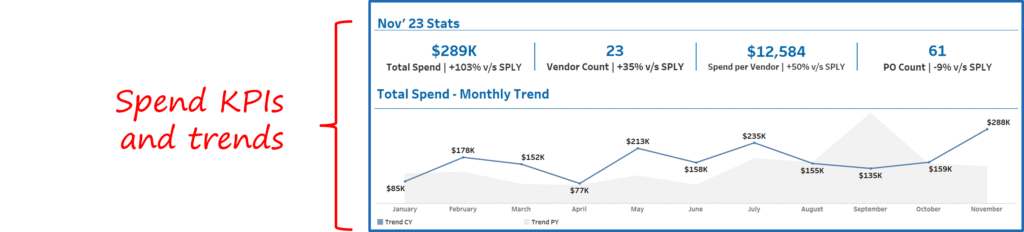
For example, a sudden spike of $288K in a single month went unnoticed until quarterly reviews. By the time finance leaders realized the overrun, the opportunity to negotiate terms or curtail usage had passed. Without transparency, budget decisions were reactive, not proactive.
Business Objectives
The dashboard initiative was anchored around five business goals:
- Pinpoint Excessive Spend: Detect overspending across vendors, categories, and services in real time.
- Enable Root Cause Analysis: Identify drivers behind monthly surges to support data-backed decisions.
- Improve Vendor Negotiations: Provide vendor-level spend intelligence to strengthen bargaining power.
- Support Proactive Budget Adjustments: Move from retrospective reporting to predictive, forward-looking monitoring.
- Streamline Executive Oversight: Deliver intuitive, self-service dashboards that allow CXOs to act without deep IT intervention.
Outcomes and Measurable Impact
The rollout of the Vendor Spend Analytics Dashboard yielded measurable results within the first six months:
- Cost Avoidance and Savings: The system flagged nearly $2.5M of discretionary spend annually, much of which could be optimized or reallocated.
- Vendor Rationalization: Vendor count was reduced by 15%, focusing on high-value relationships and eliminating duplicate services.
- Faster Decision Cycles: CXOs and IT managers reduced reporting preparation from 10–12 hours per week to under 3 hours, a 70% efficiency gain.
- Budget Predictability: Monthly spend variance dropped from ±18% swings to a controlled ±5% range, improving financial stability.
- Improved Accountability: Department heads could directly trace their IT consumption back to invoices, improving spend discipline.
Our Approach
The project was executed in four deliberate stages to ensure maximum adoption and impact.
1. Data Discovery and KPI Definition
We began by consolidating IT spend data from invoices, ERP entries, and vendor contracts. Working with finance and IT stakeholders, we defined critical KPIs:
- Monthly spend trend and variance percentage
- Spend by category (infrastructure, applications, consulting, support)
- Vendor-level aggregation and ranking
- Service and product spend contributions
- Invoice drill-down capability for validation
This ensured that KPIs aligned with executive-level decision-making needs rather than operational minutiae.
2. Dashboard Design and Visualization
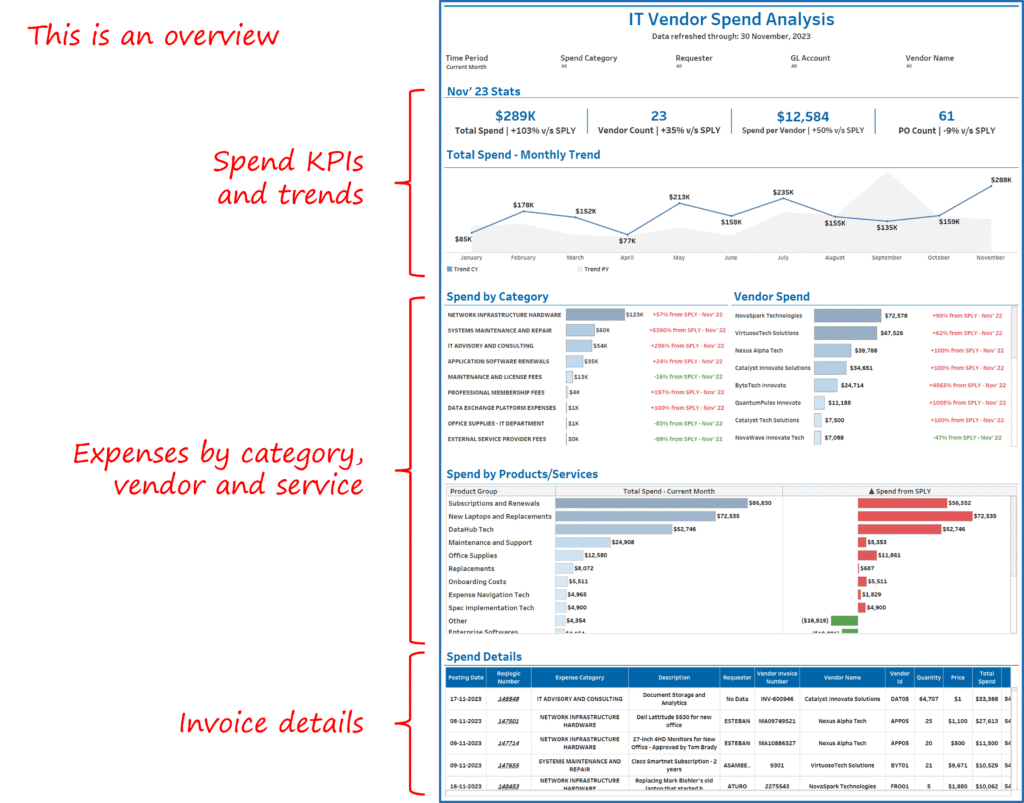
Using Tableau, we structured the dashboard into an intuitive storyline:
- Spend Overview Panel: Quick snapshot of total IT spend, variance, and surges.
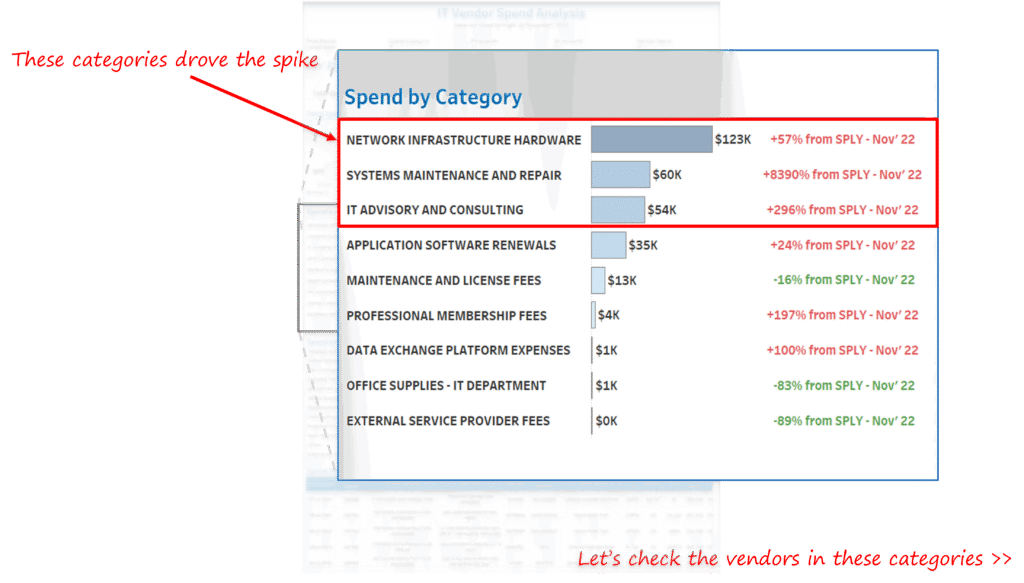
- Category Breakdown: Identified which categories drove spend changes, e.g., software licenses vs. consulting services.
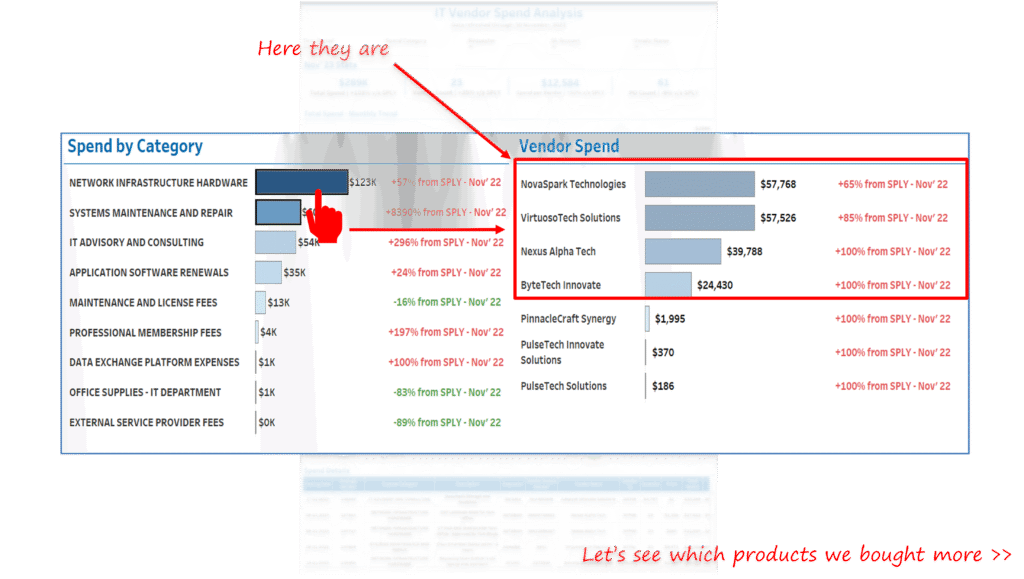
- Vendor Analysis: Ranked vendors by spend, enabling vendor consolidation strategies.
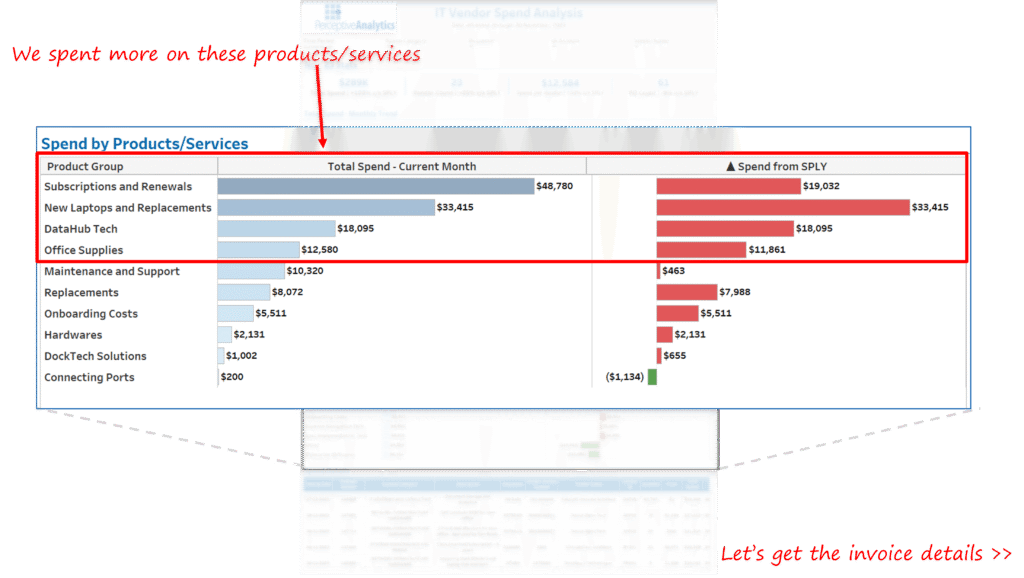
- Product and Service Drilldowns: Highlighted specific purchases contributing to spikes.
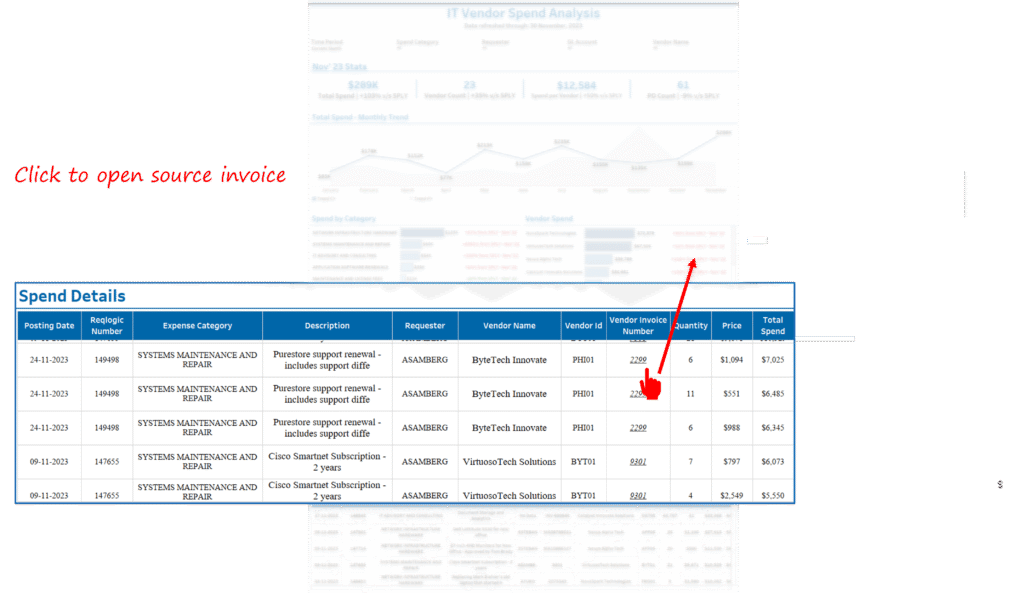
- Invoice Validation: Linked to source documents for executive confidence in data accuracy.
We prioritized storytelling with data, so executives could ask “what happened” and “why” without navigating complex data layers.
3. Root Cause Analysis and Drilldowns
The dashboard was built not just to show data but to enable investigation. When a spike was detected, leaders could drill down by:
- Category → Vendor → Product/Service → Invoice
This layered approach allowed, for example, the CFO to trace a $288K spike directly to a handful of consulting service invoices and initiate renegotiation.
4. Iteration and Executive Alignment
Adoption was ensured by engaging CXOs early in the design process. The dashboard was refined over multiple iterations to include:
- Color-coded spend alerts (red for “excessive,” amber for “review,” green for “OK”).
- Export-friendly views for board reporting.
- Invoice traceability, increasing trust, and usability.
This iterative feedback loop was critical to shifting from a finance/IT tool to a strategic CXO dashboard.
Key Learnings and Recommendations
- Transparency Builds Trust: Linking spend directly to invoices was a game-changer. Executives trusted the dashboard not just because of visualizations but because every data point had traceability.
- Focus on Variance, Not Just Totals: Monthly totals are meaningless without context. Monitoring the variance percentage provided actionable insight into unexpected surges.
- Vendor Consolidation Delivers Quick Wins: Rationalizing vendors by 15% freed up millions in discretionary budget.
- Design for CXO Usage: Simplicity, drill-down capability, and variance flags proved essential for adoption.
- Adopt Proactive Monitoring: Instead of waiting for quarterly reports, weekly spend monitoring enabled early corrective actions.
Conclusion
The IT Vendor Spend Analytics Dashboard enabled the client, a $600M food manufacturer, to transform IT spending from an opaque cost center into a controllable, strategic resource.
Within months, leaders gained clarity on surges, negotiated better vendor terms, and enforced accountability across departments. More importantly, the company achieved annualized savings of nearly 10% of its IT budget while cutting reporting time by 70%.
For CXOs, this case demonstrates the strategic power of well-designed analytics dashboards: it is not about more data, but about surfacing the right insights at the right time to control costs and drive efficiency.
Each month, we curate the latest updates, insights, and trends for senior leaders in data analytics and AI in our CXO Analytics Newsletter.
Our mission is “to enable businesses to unlock value in data.” For over 20 years, we’ve partnered with more than 100 clients—from Fortune 500 companies to mid-sized firms—to solve complex data analytics challenges. Our services include Advanced Analytics, Generative AI, and Business Intelligence (Tableau, Power BI and Looker) turning data into strategic insight. We would love to talk to you. Do reach out to us for a free consultation.
Our Work
Industry
- Industry
Function
- Function
-
Increasing Conversions with Adwords Spend Optimizer
How To Optimize Adwords Budget in Real Time
Free Download


-
Markdown Optimization for Retailers
A Methodology to Track Performance and Maximize Value
Free Download
-
Optimizing Marketing Spend with Marketing Mix Modeling
Using Statistical Modeling and Empirical Methods
Free Download
-
Leveraging Web Analytics for Customer Acquisition
Leveraging Web Analytics for Customer Acquisition
Free Download
*Subscribe to be the first one to know our latest updates
Contact us

You have crafted a powerful analytical tool for us. Thank you.
Alan Benjamin
Principal, Benjamin Realty Advisors

I have been working with Chaitanya and Perceptive Analytics for about 20 months now. They did BI / reporting and excel tool development. Their work helped us in channeling our periodic reports to the senior and operational management. The team exceeded my expectations. Chaitanya would ask thought provoking questions that trigger a new line of thinking. They created good dashboards so our senior team can quickly interpret reports. We were able to make progress because the team knew finance and tools they created were easy to implement.
Samir Lavani
CFO at Pearl Hospitality

Chaitanya and the Perceptive Analytics team worked on multiple strategic projects that involved Tableau data visualizations. Perceptive's work (~ 1 year) led to successful launch of our portal - this was an important milestone for us. Visualizations created were insightful, easy to understand and visually attractive. The team often suggested ways to show data in more intuitive way so our audience can understand it. They also knew Tableau well that helped in customizing it for our purposes. The team worked hard to finish the project on time managing expectations. I look forward to working with Perceptive on other projects.
Haroon Yaqoob
Principal at Nomenclature Inc.
