How Analytics Reduces Claims Fraud and Leakage in Insurance
Insurance | May 10, 2026


Perceptive Analytics’ Perspective — The Problem With Fraud Is Not Scale. It Is Invisibility.
Insurance fraud has always been expensive. What has changed in 2024 and 2025 is its mechanism. Generative AI now produces claim documents, medical invoices, and accident photographs indistinguishable from genuine originals. Synthetic voice attacks surged 475% in 2024 alone. And soft fraud — the inflation of legitimate claims rather than their wholesale fabrication — accounts for 60% of all incidents yet carries a detection rate between just 20% and 40%.
At Perceptive Analytics, we work with claims and SIU leaders who are simultaneously managing investigator capacity, false positive rates from legacy rules engines, and mounting pressure to improve loss ratios without harming customer experience. The answer to all three pressures is the same: better data, better models, and better integration of analytics into the workflow where decisions are actually made.
This guide provides a practical framework for claims and SIU leaders evaluating analytics investment for fraud and leakage reduction — grounded in current research and industry practice, not technology marketing.
Quick Overview
Insurance fraud costs the US economy $308.6B annually, but traditional rules engines fail against modern threats like GenAI-altered documents, synthetic voice attacks, and organized fraud rings. Moving to a layered analytics approach—combining supervised machine learning, natural language processing, graph analytics, and AI document authentication—reduces false positives from 70% down to 10%, cuts fraud losses by up to 40%, and delivers an ROI of 200%–1,000% with a payback period under seven months.
Table of Contents
- From Rules to Advanced Analytics: How Fraud Detection Is Changing
The Three-Stage Evolution of Insurance Fraud Detection
- Analytics Tools That Actually Catch Fraudulent Claims
Supervised Machine Learning for Claim Scoring
Unsupervised Anomaly Detection for Emerging Fraud
NLP for Unstructured Claims Text
Graph Analytics for Organised Fraud Rings
GenAI Document Authentication
- Making Analytics Work With Existing Claims Systems
Integration Architecture Patterns
- Cost and ROI of Analytics-Driven Fraud Detection
Investment Components
ROI Levers
- Real-World Results: Insurers Reducing Claims Leakage With Analytics
- The Fraud Analytics Maturity Model
- Key Takeaways For Claims And SIU Leaders
- Action Checklist for the Next 6–12 Months
Insurance fraud costs the US economy $308.6 billion annually — a figure that stood at $80 billion in 1995 and has grown at nearly twice the rate of inflation across three decades [Coalition Against Insurance Fraud / Talli.ai, 2025]. On the claims side specifically, roughly 10% of all P&C losses and loss adjustment expenses are attributable to fraud, with property and casualty lines alone accounting for approximately $45 billion in annual fraud losses. These numbers almost certainly understate the true exposure: most fraud is never detected, and industry-wide losses are climbing at 10–15% annually [Shift Technology, 2025].
Claims leakage — the broader category that includes undetected fraud, overpayment on legitimate claims, adjuster error, and process failures — is equally pervasive. AI-powered risk models are now reducing claims leakage by over $17.4 billion annually across the industry, directly increasing insurer profitability [Coinlaw AI Statistics, 2025]. But 71% of that opportunity remains untapped at carriers that have not modernised their detection infrastructure.
The case for analytics-driven fraud and leakage reduction is no longer aspirational. It is quantified, replicable, and available to any carrier willing to invest in the right sequence. Our data-driven blueprint for insurance growth and advanced analytics consulting practice provide the strategic foundation for this investment.
Talk with our consultants today. Is claims fraud quietly eroding your loss ratio? Perceptive Analytics helps carriers build the analytics infrastructure to detect, investigate, and prevent fraud at scale. Book a session with our experts now.
| $308.6B Annual insurance fraud cost across all lines — up from $80B in 1995 Coalition Against Insurance Fraud / Talli.ai, 2025 | 475% Surge in synthetic voice fraud attacks against insurers in 2024 alone Coinlaw / Perceptive Analytics, 2025 |
|---|
From Rules to Advanced Analytics: How Fraud Detection Is Changing
The dominant fraud detection approach at most carriers remains the rules engine: a set of configurable Boolean conditions — if claim amount exceeds threshold X AND claimant has prior claim within 12 months AND provider appears on watch list, escalate to SIU. Rules engines have three genuine strengths: they are fast, auditable, and easy for adjusters to understand. They have one structural weakness that compounds over time: fraud patterns evolve faster than rules can be rewritten.
The Three-Stage Evolution of Insurance Fraud Detection
Stage 1 — Rules-only detection. Binary flag logic applied at claim intake. High false positive rates (typically 60–70% of referrals prove to be legitimate). Fraud patterns that do not match pre-defined rules are invisible to the system. Rules require manual maintenance; when they fall out of date, detection rates decline without any visible signal.
Stage 2 — Hybrid: Rules plus supervised ML. Supervised machine learning models — trained on historical confirmed fraud cases — augment rules by assigning a probability score to each claim rather than a binary flag. The score reflects how closely the claim resembles past fraud across hundreds of variables simultaneously. Insurers utilising predictive analytics for fraud detection have reported fraud identification success rates increasing from 50% to over 80% [Coalition Against Insurance Fraud / Decerto, 2024].
Stage 3 — Advanced AI: Unsupervised anomaly detection, NLP, graph analytics, and GenAI document authentication. Unsupervised models detect anomalies without requiring pre-labelled historical fraud cases — critical for emerging fraud types that have no prior history in the training data. NLP processes adjuster notes, medical reports, and claimant statements to extract inconsistency signals. Graph analytics maps relationships between claimants, providers, attorneys, and vehicles to identify organised fraud rings. GenAI document authentication tools detect pixel-level manipulation, metadata mismatches, and AI-generated imagery in submitted claim evidence.
Perceptive Analytics’ AI consulting team implements all three layers for insurance clients — treating each as complementary coverage rather than sequential replacements. See our reducing claims leakage with proactive fraud analytics guide for the full detection architecture.
| Approach | Detection coverage | False positive rate | Adapts to new fraud? | Explainability |
|---|---|---|---|---|
| Rules engine only | Known patterns only | High (60–70%) | No — manual update required | Full — logic is explicit |
| Rules + supervised ML | Known + variant patterns | Moderate (30–45%) | Partially — requires retraining | Moderate — scores explainable |
| Advanced AI (full stack) | Known + novel + organised rings | Low (10–20%) | Yes — continuous learning | Requires XAI layer for compliance |
The most effective fraud detection architectures are not single-layer — they are stacked. Rules provide the first filter and the audit trail. ML provides the risk score. Unsupervised models catch what supervised models miss. Graph analytics catches organised rings that evade all model-based detection. Each layer adds detection coverage without replacing the layer below it.
Analytics Tools That Actually Catch Fraudulent Claims
The analytics techniques that consistently move the needle on fraud and leakage share a common characteristic: they detect signals that trained investigators would not see without assistance, either because the signal is buried in unstructured text, visible only across a network of relationships, or present only in the pixel-level properties of a submitted image.
1. Supervised Machine Learning for Claim Scoring
Gradient boosting models (XGBoost, LightGBM) and random forests trained on confirmed fraud cases produce claim-level risk scores that reflect hundreds of variables simultaneously: claim timing relative to policy inception, provider billing patterns, geographic clustering, injury type relative to accident description, claimant claim history, and dozens more. Predictive scoring alone reduces fraud losses by up to 40% [Appinventiv, 2025]. The score is surfaced to the adjuster alongside the claim at intake — not as a black-box decision, but as a prioritisation signal that directs investigative capacity toward the highest-risk cases.
Our AI consulting and advanced analytics consulting teams build and govern these claim scoring models for insurance clients, including the explainability layer that makes scores defensible to regulators and usable by adjusters.
2. Unsupervised Anomaly Detection for Emerging Fraud
Unsupervised models identify statistical anomalies without requiring pre-labelled training data — making them particularly valuable for detecting emerging fraud typologies that have no prior history in the carrier’s records. Isolation forests, autoencoders, and DBSCAN clustering flag claims that are statistically unusual relative to the broader population across multiple dimensions simultaneously. These are the models that catch the first instances of a new fraud scheme, before enough confirmed cases exist to train a supervised model.
3. NLP for Unstructured Claims Text
Adjuster notes, medical records, claimant statements, and legal correspondence contain fraud signals that no structured data field captures. NLP models extract sentiment inconsistencies (claimant descriptions that do not match injury severity), provider billing language characteristic of upcoding, and narrative patterns correlated with staged accident schemes. Leading firms report reductions in manual claims processing effort of up to 80% through NLP automation [Coinlaw AI Statistics, 2025]. Beyond efficiency, NLP surfaces the interpretive signals — the claimant who describes a ‘minor fender bender’ but claims $45,000 in medical treatment — that experienced adjusters catch when they have time, but miss when they are managing 200 open claims.
Our chatbot consulting services practice deploys conversational AI and NLP pipelines that surface these unstructured text signals at claim intake, before payment decisions are made.
4. Graph Analytics for Organised Fraud Rings
Organised fraud — staged accidents, provider billing schemes, attorney-driven claim inflation rings — is invisible to model-based detection because each individual claim may appear legitimate in isolation. Graph analytics maps the network of relationships: the same attorney appearing in 60 bodily injury claims, the same body shop appearing in 80 collision claims from the same ZIP code, the same medical provider billing identical treatment sequences across 120 claimants. Research published in the European Actuarial Journal confirms that network analytics detects fraud patterns that are entirely different from those identified by standard claim-level models — the two approaches are complementary, not substitutes [Deprez et al., European Actuarial Journal, 2024].
5. GenAI Document Authentication
As of 2025, this is the fastest-growing threat and the fastest-growing detection category. Studies now suggest that 25–30% of claims involve some form of GenAI-altered evidence [Perceptive Analytics / Industry Research, 2025]. Purpose-built authentication tools analyse submitted images, videos, and documents for signs of AI generation or manipulation: pixel inconsistencies, metadata mismatches, compression artefacts, and audio patterns characteristic of synthetic voice. A 2025 Deloitte survey found that 35% of insurance executives now rank fraud detection among their top five priorities for generative AI investment [Deloitte / Claims Journal, 2025].
Perceptive’s POV — On Tool Selection
At Perceptive Analytics, the question we hear most often from SIU leaders is: which of these tools should we start with? The honest answer is that it depends entirely on where your leakage is concentrated. A personal auto carrier with high bodily injury claim frequency should prioritise NLP and supervised scoring. A commercial property carrier with organised contractor fraud should start with graph analytics. A high-volume health insurer should lead with unsupervised anomaly detection on provider billing patterns.
Starting with the tool rather than the leakage problem is the most common reason analytics investments in fraud detection underperform expectations. Diagnose first. The tool selection follows from the diagnosis.
Making Analytics Work With Existing Claims Systems
Integration is where most analytics investments in fraud detection either succeed or stall. A fraud model that produces accurate scores but is not visible to the adjuster at the point of claim intake is an analytics capability that exists outside the workflow — generating reports that inform the next training session rather than decisions that protect the next payment.
Integration Architecture Patterns
API-first real-time scoring at FNOL. The fraud model is called via API at first notice of loss, returns a risk score within milliseconds, and that score is surfaced in the claims management system alongside the claim record. The adjuster sees the score before any coverage verification or reserve decision is made. This is the integration pattern that makes fraud detection proactive rather than reactive.
Claims data lake as the analytical foundation. A unified analytical environment — built on cloud platforms such as Snowflake or Databricks — consolidates policy data, claims history, billing records, telematics, and external reference databases (ISO ClaimSearch, NICB, license plate recognition networks) into a single governed layer. The fraud model trains and scores against this unified dataset, not against the partial view available from any single source system. Our Snowflake consulting and Talend consulting teams build and govern these unified data layers for insurance clients. See our modern BI integration on AWS with Snowflake and Power BI framework for the architecture we deploy in production.
Feedback loops from investigation outcomes. When an SIU investigation confirms fraud — or clears a flagged claim — that outcome feeds back into the model as a labelled training example. Without this feedback loop, the model’s accuracy degrades over time as fraud patterns evolve. With it, the model continuously improves. Our data observability as foundational infrastructure practice builds the monitoring layer that makes these feedback loops visible and auditable.
SIU case management integration. Graph analytics outputs and high-risk score referrals should route directly into the SIU case management system, pre-populated with the evidence trail the model used to generate the flag. An investigator who receives a referral with documented network connections, historical pattern matches, and supporting evidence can begin investigating immediately. One who receives a referral with only a score must reconstruct the evidence manually — erasing much of the efficiency gain.
BI dashboard for portfolio-level pattern monitoring. Fraud is a portfolio phenomenon as well as an individual claim phenomenon. A BI dashboard — built on Power BI or Tableau against the claims data lake — gives claims leaders and SIU management a real-time view of fraud concentration by geography, line of business, provider, attorney, and claim type. This is where emerging organised schemes become visible before they reach actuarial materiality. Our insurance sales dashboard and answering strategic questions through high-impact dashboards work demonstrates how this portfolio-level visibility is designed and governed.
The integration sequence that consistently delivers the fastest ROI: real-time scoring at FNOL first (immediate claims protection), claims data lake consolidation second (model accuracy), SIU case management integration third (investigator efficiency), and portfolio dashboard fourth (strategic pattern monitoring). Carriers that attempt all four simultaneously typically achieve partial success across all of them rather than full success in any.
Cost and ROI of Analytics-Driven Fraud Detection
The ROI of fraud analytics is better documented than almost any other insurance technology investment — because the return is directly measurable: claims paid that should not have been paid, versus claims appropriately investigated and denied. The challenge is that the costs are consolidated (platform, data, talent, integration) while the benefits are distributed across thousands of individual claim decisions.
Investment Components
Platform and infrastructure: Cloud data platform licensing, streaming ingestion tools, and ML environment. Typically $300,000–$800,000 annually for mid-tier carriers, scaling with claims volume and data complexity.
Model development and tuning: Initial model build and validation for a single line of business typically requires 3–6 months of data science effort. $150,000–$400,000 for initial build; ongoing model monitoring and retraining is approximately 20–30% of initial build cost annually.
Integration with claims systems: API development and testing against the existing claims management platform. $200,000–$500,000 depending on legacy system complexity and API availability.
SIU team training and change management: Adjusters and investigators must understand what the score means, how to use it, and when to override it. Consistently underbudgeted; typically requires 10–15% of total programme cost.
External data feeds: ISO ClaimSearch, NICB databases, telematics feeds, identity verification, and legal/verdict data. $50,000–$200,000 annually depending on volume and coverage.
ROI Levers
Fraud losses prevented: Deloitte projects that AI-driven fraud detection could save the P&C industry $80–160 billion by 2032 [Deloitte / Claims Journal, 2025]. Carriers implementing multimodal AI analytics could generate savings of 20–40% on fraudulent claims payments, depending on implementation sophistication.
Claims leakage recovery: AI-powered risk models are reducing claims leakage by over $17.4 billion annually across the industry [Coinlaw AI Statistics, 2025]. For individual carriers, the return from leakage recovery alone typically generates ROI of 200–1,000% with payback periods under seven months for well-implemented programmes [Perceptive Analytics, 2025].
Loss adjustment expense reduction: Fewer false positive referrals means SIU teams spend time on cases with genuine fraud signals rather than clearing noise. An analyst who receives 80 high-quality referrals monthly is more effective — and less burned out — than one receiving 500 with a 12% hit rate.
Claims processing efficiency: AI-powered claims automation reduces processing times by 50–70% [Accenture, 2024], which accelerates legitimate claim resolution while maintaining the detection gate for suspicious claims. Faster legitimate settlement improves customer experience; this is the balance that rules-only systems cannot achieve.
Our Power BI implementation services and Tableau implementation services build the measurement infrastructure that makes this ROI visible and auditable from day one.
| Investment component | Typical range (mid-tier carrier) | Notes |
|---|---|---|
| Cloud data platform | $300K–$800K / year | Scales with claims volume |
| Model development (initial) | $150K–$400K | Per line of business |
| Claims system integration | $200K–$500K | Higher for legacy platforms |
| External data feeds | $50K–$200K / year | ISO, NICB, telematics |
| SIU training and change management | 10–15% of total spend | Consistently underbudgeted |
| Typical payback period | Under 7 months | For well-scoped programmes |
| Typical ROI range | 200–1,000% | Source: Perceptive Analytics, 2025 |
Perceptive’s POV — On Framing the Business Case
Fraud analytics investment committees frequently evaluate the cost as a technology expenditure and the benefit as speculative. At Perceptive Analytics, we reframe the business case: this is a claims cost offset with a technology label. The $3 million in platform spend is the mechanism through which $10 million or more in annual leakage recovery becomes possible. Framed correctly, the question is not whether the carrier can afford the investment. It is whether it can afford the continued leakage.
We build fraud analytics business cases by quantifying the current-state baseline first: existing leakage rate by line, confirmed fraud as a percentage of investigated claims, SIU referral-to-confirmation rate, and investigator time spent per case. When those numbers are honest, the ROI case almost always closes itself.
Real-World Results: Insurers Reducing Claims Leakage With Analytics
Case Snapshot: Personal Auto Carrier — Bodily Injury Fraud Ring Detection
A personal lines carrier writing high-volume auto in urban markets was experiencing loss ratio deterioration in its bodily injury coverage — claims average was rising faster than medical inflation, and SIU referral rates from the rules engine were generating a 68% false positive rate that was overwhelming investigator capacity. After implementing a graph analytics layer that mapped relationships between claimants, attorneys, and medical providers, the carrier identified a network of 14 interconnected attorneys and 6 medical clinics generating a disproportionate share of claims with identical treatment sequences and billing codes. The network had been invisible to the rules engine because each individual claim fell within standard parameters. The graph revealed the pattern. The combined claims volume from the identified network represented approximately $8.2 million in annual exposure. Targeted investigation and referral to law enforcement produced recoveries and future exposure elimination worth a projected $6.4 million annually. False positive rates on the revised referral workflow fell from 68% to 22% within six months.
Case Snapshot: European Health Insurer — Reducing False Positives and Leakage Simultaneously
A European health insurer deploying an AI-based fraud detection system experienced an immediate tension: the ML model flagged significantly more claims than the rules engine, but a substantial proportion of those flags were clearing on investigation. Working with an analytics partner to retune the model’s threshold and incorporate NLP signals from medical record text, the carrier reduced false positives by 28% within six months, while maintaining the higher detection rate that the ML model had achieved relative to the previous rules-only approach. Claim leakage attributable to billing errors and upcoding — rather than intentional fraud — fell by approximately 18% in the first year, as the NLP layer surfaced systematic billing pattern discrepancies that adjusters were not identifying through manual review. The case demonstrates a consistent finding: the primary ROI of analytics in fraud detection is not always in catching intentional fraud. It is frequently in surfacing the soft leakage that has been passing through undetected.
Case Snapshot: Commercial Lines Carrier — GenAI Document Fraud Detection
A commercial lines carrier processing property damage claims began observing a pattern in 2024: submitted repair estimates and contractor invoices that cleared manual review were generating anomalous settlement costs relative to independently assessed damage valuations. After deploying a GenAI document authentication tool, the carrier identified that a subset of contractor invoices were AI-generated documents — not authentic business records — with metadata inconsistencies and pixel-level rendering patterns characteristic of large language model output. The discovery led to a systematic review of the prior 18 months of commercial property claims in the affected segment, identifying approximately $4.3 million in claims settled against AI-generated documentation. The authentication tool is now integrated at intake for all commercial property claims above a specified threshold, with a review workflow for flagged documents that adds approximately 90 seconds to the intake process while providing a documented evidence trail.
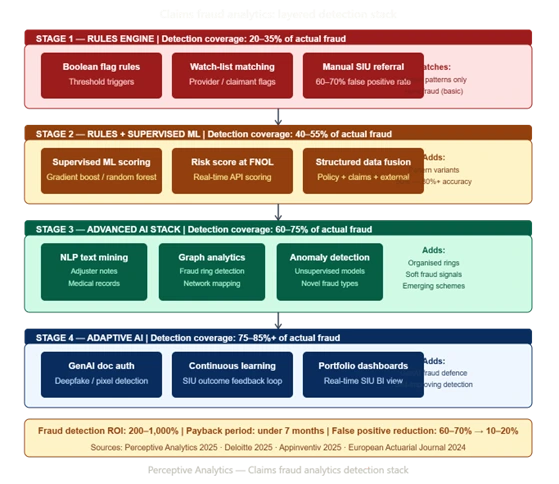
The Fraud Analytics Maturity Model
A practical framework for assessing where your current detection capability sits — and what the realistic next step looks like:
| Stage | Label | Characteristics | Typical fraud detection rate |
|---|---|---|---|
| 1 | Rules-only | Boolean rules engine, high false positives, manual SIU referral | 20–35% of actual fraud |
| 2 | Hybrid | Rules + supervised ML score, structured data only, batch scoring | 40–55% of actual fraud |
| 3 | Advanced | NLP + graph + unsupervised + real-time API scoring at FNOL | 60–75% of actual fraud |
| 4 | Adaptive AI | GenAI doc auth + continuous model learning + portfolio dashboards | 75–85%+ of actual fraud |
Most mid-tier carriers operate at Stage 1 or Stage 2. Moving from Stage 2 to Stage 3 — adding NLP, graph analytics, and real-time API scoring — represents the highest-ROI transition available without a full core claims system replacement. Our automated data quality monitoring and data transformation maturity framework practices provide the data governance foundation that makes this maturity progression sustainable.
Key Takeaways For Claims And SIU Leaders
The evidence base for analytics-driven fraud and leakage reduction is no longer circumstantial. Fraud detection success rates that improve from 50% to 80%+ with predictive analytics, false positive rates that fall from 60–70% to 10–20% with full-stack AI, and ROI ranges of 200–1,000% with payback periods under seven months are documented outcomes at carriers across lines of business and geographies. The question for claims and SIU leaders is not whether the investment is justified, it is how to sequence it correctly.
Perceptive’s POV — On the Right Sequence
The carriers that achieve the most from fraud analytics investment are not those with the largest budgets or the most sophisticated technology roadmaps. They are the ones that start with an honest diagnosis of where leakage is concentrated, sequence their analytics investment to address the highest-value exposure first, and build the data governance and feedback loop infrastructure that makes the model improve over time.
At Perceptive Analytics, our claims fraud engagements begin with a leakage assessment — quantifying current fraud detection rates, SIU referral quality, false positive rates, and the distribution of leakage by claim type and line. That baseline is what makes the business case credible, the tool selection defensible, and the ROI measurement possible. If your organisation does not have that baseline today, building it is the right first step.
Action Checklist for the Next 6–12 Months
| Diagnose | Conduct a claims leakage assessment: quantify fraud detection rates, SIU referral-to-confirmation rates, false positive rates, and leakage distribution by claim type and line. |
|---|---|
| Baseline | Establish the current-state data quality baseline across policy, claims, billing, and external reference sources before selecting any analytics platform. |
| Prioritise | Identify the one or two claim types or lines where fraud and leakage exposure is highest — and focus the initial analytics investment there, not across the entire book simultaneously. |
| Pilot | Select one analytics technique appropriate to the identified leakage type (supervised scoring, NLP, or graph analytics) and build it end-to-end: data ingestion, model, API integration into the claims workflow, SIU referral routing. |
| Measure | Define the KPIs before the pilot goes live: referral volume, confirmation rate, false positive rate, average claim cost on flagged versus unflagged claims, and SIU case closure time. |
| Govern | Assign a business owner — a senior claims or SIU leader — for the fraud analytics data domain. Ensure model outputs carry the documentation trail required for regulatory compliance and litigation support. |
| Feedback | Build the model feedback loop from day one: confirmed fraud outcomes and cleared referrals must re-enter the training dataset on a defined cycle to maintain model accuracy as fraud patterns evolve. |
| Scale | After the pilot demonstrates ROI, extend to additional lines and techniques. Add NLP if you started with scoring. Add graph analytics if you started with NLP. Each layer adds complementary detection coverage. |
Talk with our consultants today. Ready to build fraud analytics your SIU team will actually trust and use? Perceptive Analytics is here to help. Book a session with our experts now.
Frequently Asked Questions (FAQs)
1. Why are legacy rules engines no longer enough for insurance fraud detection?
Boolean rules engines are fast and easy to understand, but they rely on static logic (e.g., specific thresholds or simple match criteria). Modern fraud schemes—such as AI-generated invoices, synthetic voice spoofs, and organized fraud rings—evolve faster than rules can be updated manually. Rules engines also generate high false-positive rates (typically 60–70%), which swamps investigator capacity with legitimate claims.
2. How do machine learning models reduce false positive rates in claims referrals?
Supervised machine learning models evaluate hundreds of variables simultaneously to assign a risk score rather than a binary “yes/no” flag. By assessing overall pattern risk and integrating natural language processing (NLP) to read unstructured notes, advanced analytics cuts false-positive referral rates down to 10–20%, allowing Special Investigation Units (SIU) to focus on genuine threats.
3. What is the difference between supervised ML and graph analytics in fraud detection?
Supervised machine learning focuses on individual claim scoring by looking for characteristics similar to past confirmed fraud cases. Graph analytics, on the other hand, maps network relationships across claimants, attorneys, medical providers, and auto body shops. It identifies organized fraud rings where each individual claim looks normal on its own, but the interconnected network reveals systemic inflation or staged schemes.
4. How does generative AI impact insurance fraud detection?
Generative AI is a dual-edged sword. Fraudsters now use GenAI to create hyper-realistic medical invoices, altered damage photos, and synthetic voice recordings. To combat this, modern fraud architectures deploy specialized GenAI document authentication tools that analyze pixel-level manipulations, metadata mismatches, and synthetic audio patterns before claims are approved for payment.
5. Where should an insurer start when investing in fraud analytics?
Insurers should start with a thorough claims leakage assessment to identify where losses are concentrated—whether in bodily injury claims, commercial property, or provider billing errors. Once the primary leakage area is diagnosed, carriers should implement real-time API risk scoring at First Notice of Loss (FNOL) for that specific line of business before expanding into broader tools like graph analytics or automated case management.