
Executive Summary
In September, a B2B payments platform introduced an additional platform fee with the primary objective of boosting revenue. The change was applied across payment types, including foreign exchange (FX) and domestic transactions, and affected both new and existing users. The analysis shows that while the fee delivered an immediate 36% jump in total revenue, the uplift was short-lived. Within weeks, revenue growth declined, FX transaction volumes contracted significantly, and new account creation slowed particularly among individual users. The most severe impact was observed in FX usage, where a sharp rise in cost per transaction coincided with elevated churn rates in specific customer segments. Based on these findings, we recommend avoiding blanket pricing rollouts. Instead, leadership should pursue segmented and pilot-based pricing, actively monitor leading indicators such as cost-per-transaction and short-term retention, and validate changes through controlled experiments before committing to permanent pricing decisions.Why This Analysis Matters
Pricing is one of the highest-leverage and highest-risk decisions a payments platform can make. Research from Harvard Business Review and leading strategy firms consistently shows that even small pricing changes can produce outsized effects on demand, acquisition, and lifetime value. Unlike feature launches, pricing directly alters customer economics on every transaction. For payments platforms in particular, fees are highly salient. They increase the effective cost per transaction and can influence not only how often customers transact, but which products they choose—for example, whether they continue using FX services or shift to alternatives. Industry guidance from payment leaders such as Stripe highlights a strong link between abrupt pricing changes, customer perception of value, and churn risk. In this context, understanding whether a fee change produces sustainable revenue growth or merely a temporary accounting gain followed by behavioral fallout is critical for long-term platform health.Business Objectives
This analysis was designed to answer a focused set of decision-oriented questions:- Did the platform fee increase total revenue sustainably, or was the impact limited to a short-term spike?
- Which products (FX, domestic, wallet) experienced the greatest change in usage and revenue?
- Which customer segments—new vs. existing, individual vs. business—were most sensitive to the fee?
- How did acquisition channels perform following the pricing change?
- Did increases in cost per transaction correlate with higher churn?
- What pricing or product mitigations could preserve revenue while minimizing customer attrition?
Data Sources and Preparation
The analysis combined multiple data sources to create a unified, transaction-level view of customer behavior before and after the pricing change:- Transaction data: timestamps, payment type, gross revenue, platform fee, net revenue, account ID, account type, channel, and geography.
- Customer metadata: account creation date, cohort assignment, activity history, and churn indicators.
- Relevant Data Platform Data Mart extracts utilized Snowflake-based analytical tables to ensure a single source of truth.
Methods and Analytical Approach
The investigation followed a structured, narrative-driven analytical flow—moving from high-level signals to causal inference and micro-level diagnosis.Step 1: Pre–Post Trend Analysis to Detect Immediate Impact
The first step was to establish whether the platform fee introduction created any visible change in outcomes. We plotted weekly trends before and after September for:- Total revenue
- Transaction volume
- Active users
- New account creation
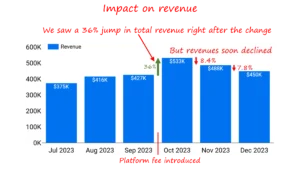 This revealed a clear, immediate revenue spike (36%) in the week of introduction, followed by a decline in subsequent weeks. This pattern established two critical facts early:
- The fee did change behavior.
- The impact was unlikely to be purely positive or sustained.
Step 2: Revenue Decomposition by Product Line
To understand where the change was occurring, total revenue was decomposed by payment type:- Foreign Exchange (FX)
- Domestic
- Wallet
- Other payment types
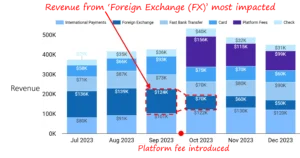 This breakdown showed that FX revenue was disproportionately affected relative to other streams after the fee introduction. While some products showed modest resilience, FX displayed both volume contraction and revenue volatility. This finding narrowed the focus of the analysis from “platform-wide impact” to FX-specific dynamics.
Step 3: User Base Analysis — New vs. Existing Accounts
Next, we examined who was driving the FX decline by splitting users into:- Existing FX users
- Newly created FX accounts
 This analysis showed that:
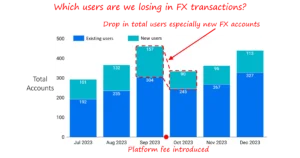
- New FX account creation dropped sharply post-fee.
- Existing users also reduced activity, but at a slower rate.
Step 4: Channel-Level Performance Review
To assess whether acquisition issues were channel-driven or systemic, new accounts were analyzed by sales and acquisition channels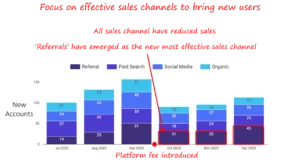 Results showed:
- Declines across almost all channels post-fee
- Referrals emerged as the most resilient channel, outperforming others despite overall slowdown
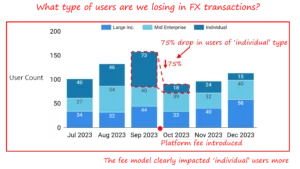
Step 5: Account-Type Segmentation (Individual vs. Business)
With FX identified as the most impacted product, the analysis then segmented FX users by account type:- Individual users
- Large Enterprises
- Mid-level Enterprises
 This revealed one of the most decisive findings of the study:
- ~75% drop in FX users came from individual accounts
- Business users were materially more resilient
Step 6: Payment Volume Analysis Within Individual Users
To understand the behavioral mechanism behind individual user churn, payment volumes were analyzed across:- Domestic
- International
- Exchange (FX)
- Wallet transactions
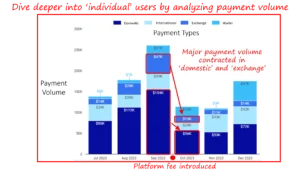 Among individual users, domestic and FX volumes contracted the most, indicating that the platform fee altered day-to-day transactional behavior—not just account status. This showed that users were not merely leaving the platform, but actively transacting less even before churning.
Step 7: Volume-Based Segmentation Within Impacted Payment Types
To isolate the most vulnerable users, FX and domestic payments were further segmented by transaction volume:- High volume (top 20%)
- Mid volume (20–50%)
- Lower volume (50–80%)
 This produced six critical segments (e.g., FX-high, FX-mid, FX-low, domestic-high, etc.) and allowed direct comparison of behavior across economic profiles.
Step 8: Retention and Churn Analysis by Segment
Retention was then analyzed for each segment to identify where churn concentrated.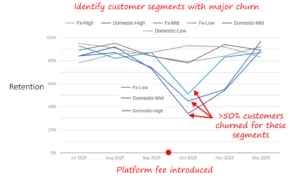 The results were stark:
- More than 50% of customers churned in multiple FX and domestic segments
- Churn was especially severe in mid and low volume individual segments
Step 9: Cost-Per-Transaction Diagnosis
Finally, to explain why churn spiked in these segments, we analyzed the percentage increase in cost per transaction post-fee.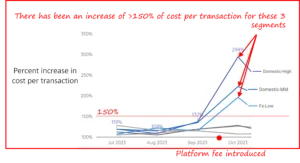 Key finding:
- The highest-churn segments experienced cost-per-transaction increases exceeding 150%
Key Findings
What the data clearly showed- Short-term revenue gain, not sustained The platform fee delivered an immediate 36% revenue increase, but this uplift declined within weeks, indicating a one-time pricing effect rather than durable growth.
- FX was the most impacted revenue stream FX transactions saw the sharpest post-fee decline compared to other payment types, driving the overall revenue drop.
- New FX account creation slowed materially Post-fee, fewer new users entered FX, signaling reduced acquisition effectiveness and future revenue risk.
- Individual users drove most of the decline FX usage among individual accounts fell by ~75%, while business users were relatively resilient.
- Severe churn in specific segments Several FX and domestic segments experienced >50% churn, concentrated in mid- and lower-volume users.
- Cost-per-transaction explains churn The highest-churn segments experienced >150% increases in cost per transaction, directly linking the fee to customer attrition.
- Channel performance shifted Most acquisition channels weakened, while referrals emerged as the most resilient channel post-fee.
Interpretation
What these findings mean for the business The immediate revenue spike confirms that the fee increased monetization per transaction. However, the subsequent decline shows that customers behavior changed by transacting less, avoiding FX, or leaving altogether. Individual users proved far more price-sensitive than businesses, especially in FX and domestic payments where alternatives are easily available. Where cost per transaction rose sharply, customers experienced immediate economic friction, which translated into reduced usage and accelerated churn. In short, the fee shifted revenue forward in time while eroding the customer base that sustains long-term growth.Actionable Recommendations
What leadership should do next- Avoid uniform pricing changes Blanket fees disproportionately harm price-sensitive segments. Pricing should be segmented by user type and volume.
- Protect high-risk cohorts Consider waivers, rebates, or grandfathering for individual and mid-volume FX users to prevent further churn.
- Pilot before scaling Any pricing change should be tested via limited pilots or A/B experiments to observe real customer response.
- Double down on resilient channels Increase focus on referrals, which showed stronger performance despite pricing pressure.
- Monitor leading risk signals Track cost-per-transaction spikes, FX usage drops, and short-term cohort retention as early warning indicators.
Metrics to Operationalize Pricing Decisions
What to track going forward- Weekly revenue by payment type
- New FX account creation (WoW)
- Active users by account type
- 30/60/90-day retention by cohort
- Cost per transaction by segment (flag >50% and >150% increases)
- Churn rate by FX/domestic segment
- Channel-level conversion trends
Conclusion
Pricing can drive rapid revenue gains—but without visibility into customer behavior, it can just as quickly erode adoption and retention. This analysis shows that while the platform fee increased short-term revenue, it also reduced FX usage and accelerated churn in price-sensitive segments. The implication is clear: pricing decisions must be tested, segmented, and continuously monitored, not rolled out uniformly. If your organization is reassessing pricing or planning fee changes, we would be glad to share how a data-led pricing impact analysis can help protect customer value while delivering sustainable revenue growth. Each month, we curate the latest updates, insights, and trends for senior leaders in data analytics and AI in our CXO Analytics Newsletter. Our mission is “to enable businesses to unlock value in data.” For over 20 years, we’ve partnered with more than 100 clients—from Fortune 500 companies to mid-sized firms—to solve complex data analytics challenges. Our services include Advanced Analytics, Generative AI, and Business Intelligence (Tableau, Power BI and Looker) turning data into strategic insight. We would love to talk to you. Do reach out to us for a free consultation.Our Work
Industry
- Industry
Function
- Function
-
Increasing Conversions with Adwords Spend Optimizer
How To Optimize Adwords Budget in Real Time
Free Download


-
Markdown Optimization for Retailers
A Methodology to Track Performance and Maximize Value
Free Download
-
Optimizing Marketing Spend with Marketing Mix Modeling
Using Statistical Modeling and Empirical Methods
Free Download
-
Leveraging Web Analytics for Customer Acquisition
Leveraging Web Analytics for Customer Acquisition
Free Download
*Subscribe to be the first one to know our latest updates
Contact us

You have crafted a powerful analytical tool for us. Thank you.
Alan Benjamin
Principal, Benjamin Realty Advisors

I have been working with Chaitanya and Perceptive Analytics for about 20 months now. They did BI / reporting and excel tool development. Their work helped us in channeling our periodic reports to the senior and operational management. The team exceeded my expectations. Chaitanya would ask thought provoking questions that trigger a new line of thinking. They created good dashboards so our senior team can quickly interpret reports. We were able to make progress because the team knew finance and tools they created were easy to implement.
Samir Lavani
CFO at Pearl Hospitality

Chaitanya and the Perceptive Analytics team worked on multiple strategic projects that involved Tableau data visualizations. Perceptive's work (~ 1 year) led to successful launch of our portal - this was an important milestone for us. Visualizations created were insightful, easy to understand and visually attractive. The team often suggested ways to show data in more intuitive way so our audience can understand it. They also knew Tableau well that helped in customizing it for our purposes. The team worked hard to finish the project on time managing expectations. I look forward to working with Perceptive on other projects.
Haroon Yaqoob
Principal at Nomenclature Inc.
