


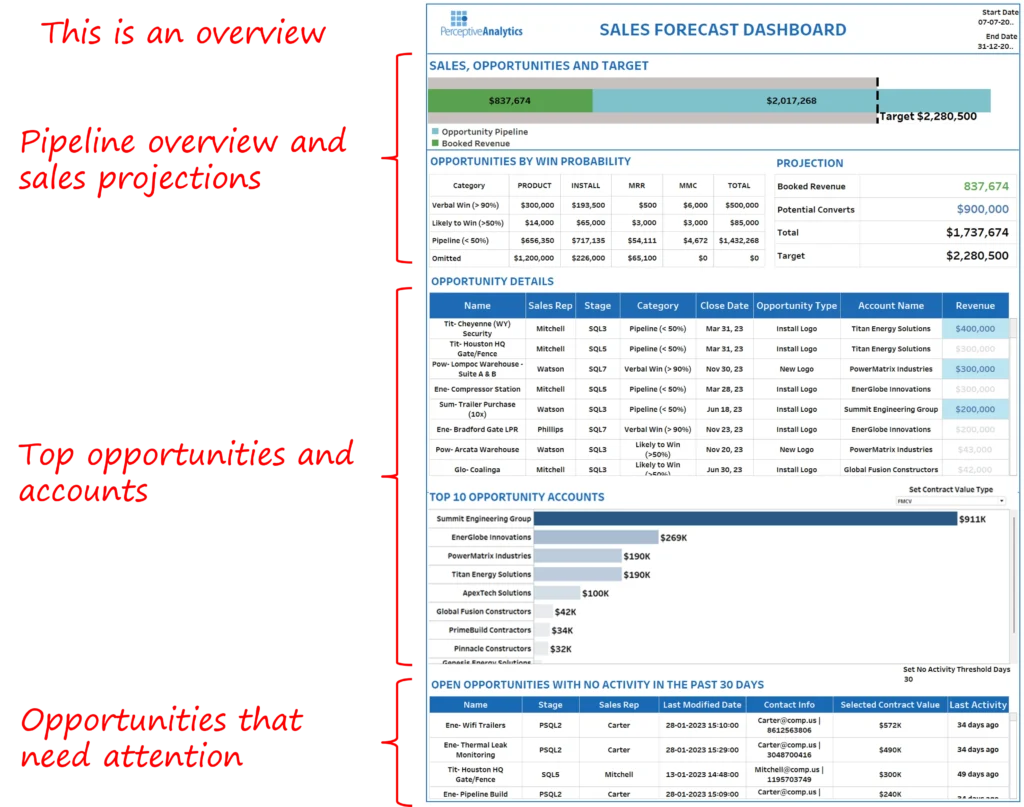
Sales Forecasting Dashboard for a Consumer Services Firm : Driving Predictable Growth with Tableau
Executive Summary
- Client: A mid-sized AI-based surveillance and automation solutions company (~$400M revenue, 500+ employees).
- Challenge: Forecasting sales was reactive and error-prone, with variance between forecast and actuals often exceeding 20%. Reports were manual, fragmented, and offered little forward-looking visibility.
- Tools Used: Tableau, Excel, Salesforce CRM.
- Solution: Designed and implemented a Sales Forecasting Dashboard in Tableau that provided real-time visibility into sales targets, pipeline performance, and forecast accuracy.
- Impact:
- Improved forecast reliability, cutting variance between forecast and actuals by more than 15%, and reducing ambiguity in leadership reviews.
- Shortened sales review preparation time by an estimated 60–70%, as executives no longer needed to reconcile fragmented spreadsheets.
- Transformed quarterly forecast meetings into proactive planning sessions, supported by scenario modeling that highlighted $500K in high-confidence opportunities and prevented potential revenue leakage.
- Strengthened accountability and focus across the sales organization, with more than 85% of managers adopting the dashboard for weekly pipeline reviews.
Introduction and Business Context
Forecasting is the backbone of executive planning. It determines how much revenue can be confidently expected, informs boardroom discussions, and drives resource allocation. Yet, for many organizations, forecast conversations often end in debate rather than clarity.
This was the case for our client, a $400 million revenue company in the AI technology services sector. The CEO and Head of Sales repeatedly found that their reviews lacked the transparency needed for confident decision-making. Forecasts, presented through static spreadsheets, looked inflated on the surface but failed to capture the true probability of conversion. This led to overestimation, missed targets, and reactive firefighting at the end of quarters.
The need was clear: a reliable, real-time sales forecast dashboard that not only tracked progress against targets but also quantified the gap, identified which opportunities could close it, and provided a data-backed path to achieving the company’s sales goals.
Business Objectives
The engagement was designed around four key business objectives:
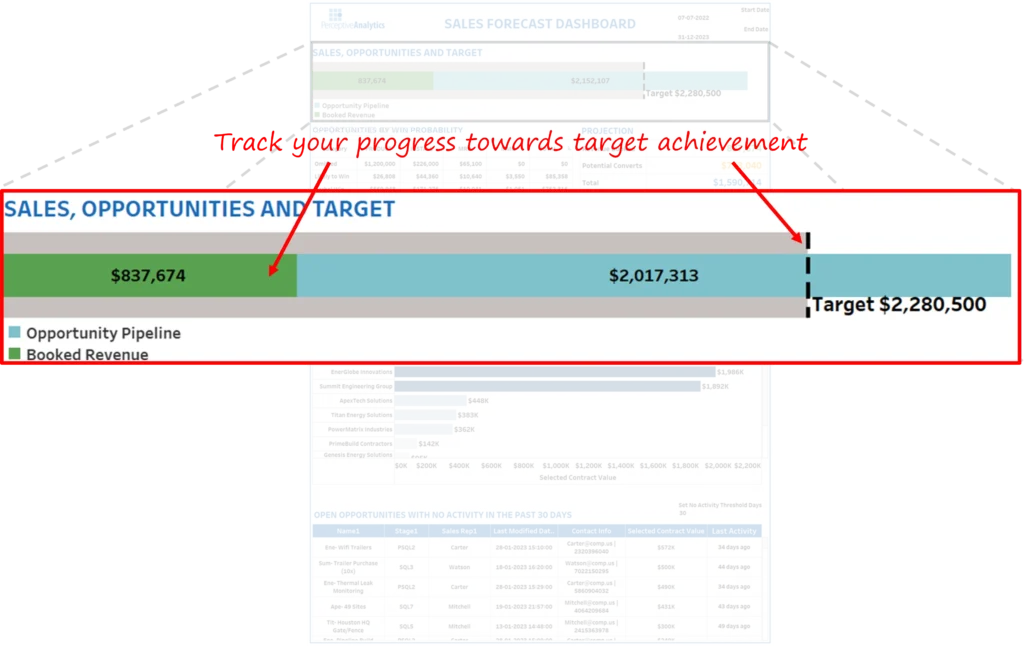
- Track progress against targets with absolute clarity. Executives needed to know exactly how much of the sales target had been achieved, the remaining gap, and whether the active pipeline could realistically bridge it.
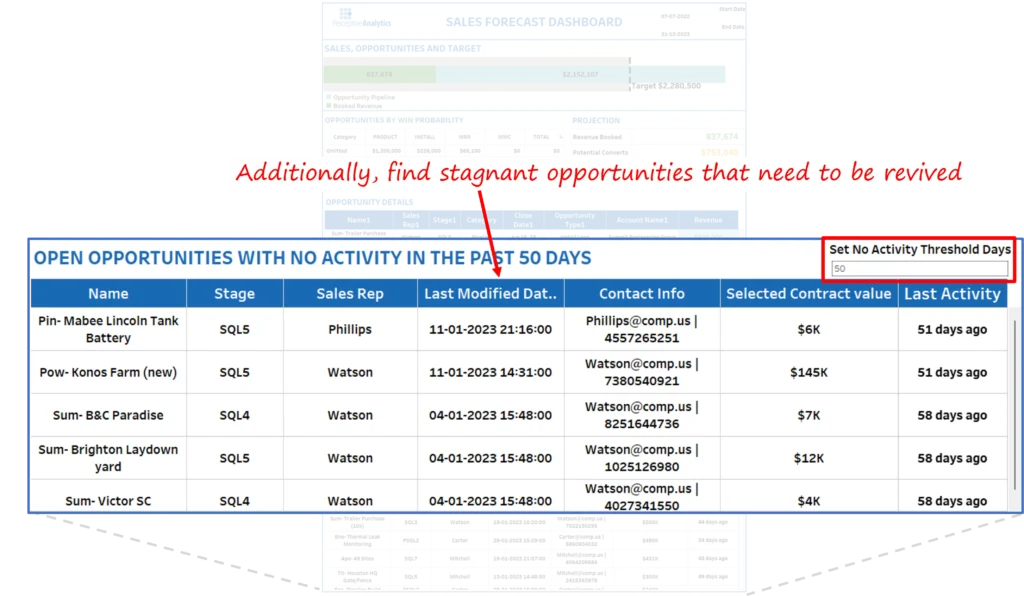
- Identify stagnant opportunities early. Sales managers needed a way to quickly spot deals that had stalled, avoiding false optimism in the pipeline and preventing over-reliance on unlikely conversions.
- Highlight high-value accounts. Leadership required a focused view of accounts that could deliver significant revenue impact, ensuring resources were directed toward strategic opportunities.
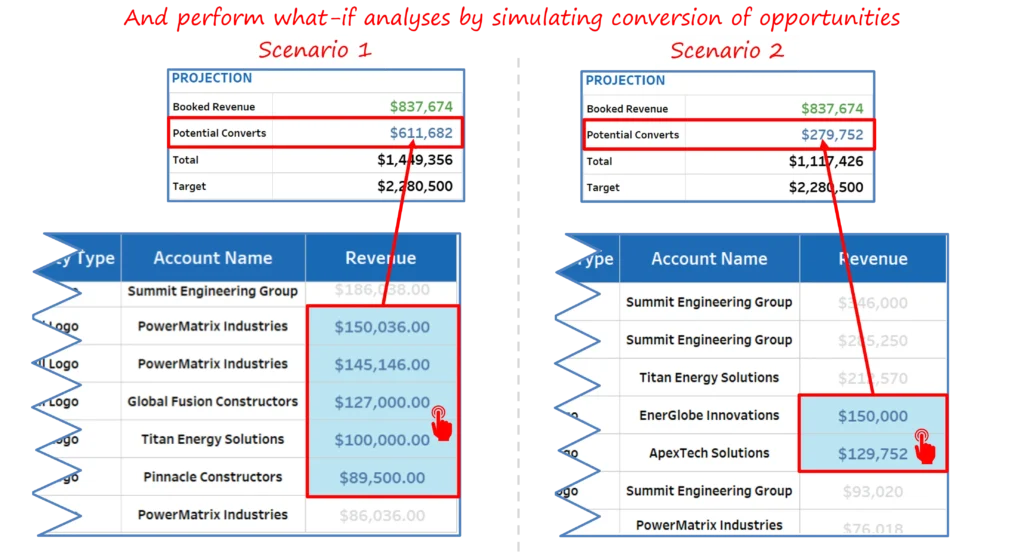
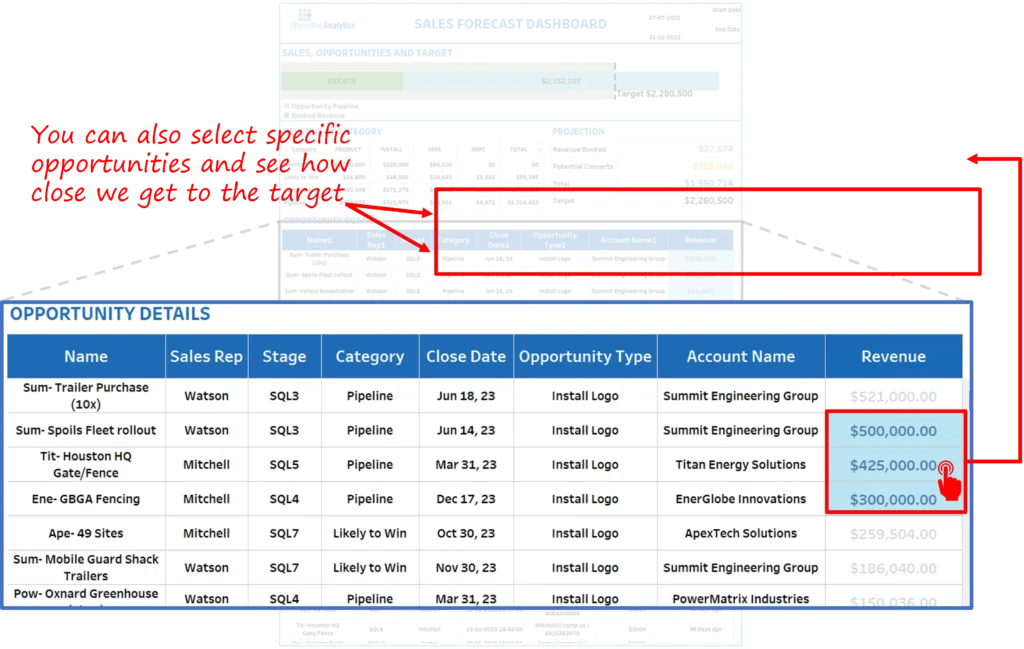
- Improve forecast accuracy and decision-making. The dashboard had to align projected revenue with official sales targets, while enabling “what-if” scenarios to test conversion strategies and drive proactive planning.
Outcomes and Measurable Impact
The Sales Forecast Dashboard delivered measurable results that reshaped sales planning and executive discussions.
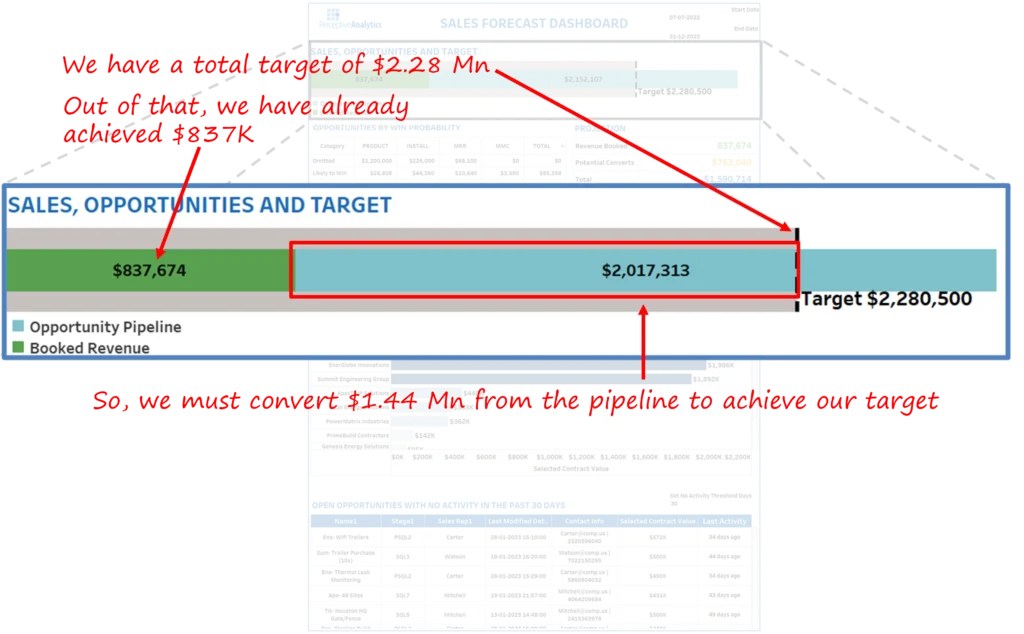
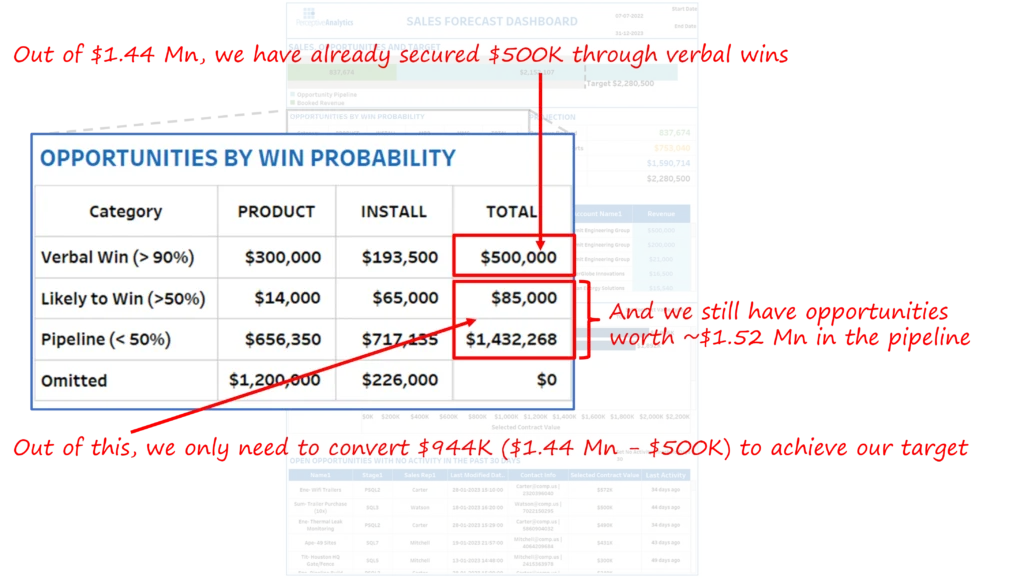
- Quantified the sales gap with precision. Against the $2.28 million annual target, $837,000 had been achieved. A gap of $1.44 million remained, of which $500,000 was already secured as verbal wins. The remaining $944,000 was required from the pipeline, which contained $1.52 million of opportunities—sufficient if managed effectively.
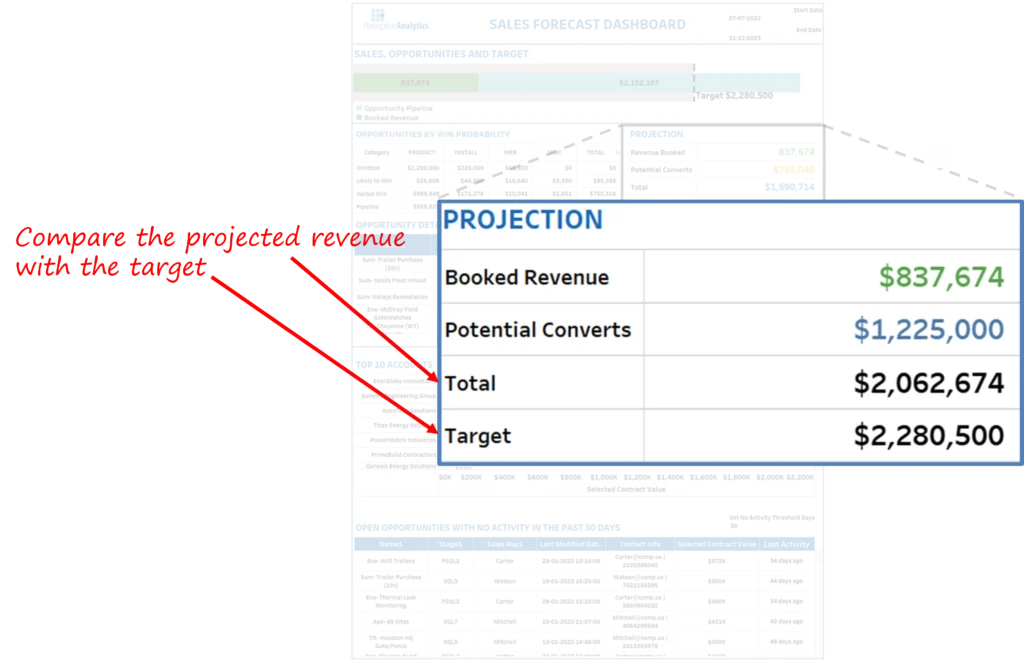
- Improved forecast accuracy. Executives gained a side-by-side view of projected revenue versus targets, eliminating debates over inflated pipeline figures and grounding conversations in evidence.
- Enabled scenario-based planning. Leadership could test different “what-if” pathways to bridge the gap, transforming meetings from post-mortems into proactive strategy sessions.
- Created action-oriented opportunity management. The dashboard flagged high-value accounts for immediate attention and highlighted stagnant opportunities for revival, giving managers actionable account-level tasks.
Our Approach
Data Discovery and KPI Definition
The project began with executive workshops to identify the KPIs that mattered most in boardroom discussions. Instead of overwhelming users with granular metrics, we focused on:
- Progress against the target
- Gap quantification
- Probability-weighted revenue
- Pipeline coverage by opportunity stage
- Lists of high-value and stagnant accounts
This KPI blueprint ensured the dashboard directly answered leadership questions without requiring translation from analysts.
Dashboard Design and Visualization
The design mirrored the way executives think: starting with the big picture, moving into pipeline validation, and finishing with actionable accounts. Key design elements included:
- A headline summary of target vs. actuals for immediate clarity
- Comparative panels showing projected revenue versus goals
- Interactive “select opportunities” and “scenario modeling” sections for leadership discussions
- Priority lists of high-value and stagnant accounts to close the loop with action
- The visual language was simple and intuitive, with clear labeling and logical flow.
Iteration and Executive Alignment
Because the primary users were the CEO and Head of Sales, we refined the dashboard over multiple iterations, focusing on clarity, usability, and actionability. Early prototypes were tested for executive readability, ensuring that visuals spoke directly to leadership without analyst interpretation. The final version emphasized crisp KPI panels, scenario modeling, and actionable lists, aligning directly with CXO priorities.
Data Integration and Validation
We integrated CRM opportunity data with official sales targets and reconciled them into a single source of truth. The reconciliation process showed that $1.44 million needed to be closed, $500,000 of which was already committed, leaving $944,000 to be secured from the $1.52 million pipeline. This math gave executives immediate confidence in the numbers, removing doubt about forecast credibility.
Key Learnings and Recommendations
- Anchor forecasts in a clear target-gap calculation. This creates alignment between leadership and managers from the very beginning of review discussions.
- Use scenario modeling to move from reactive to proactive planning. Testing different pathways provides leaders with options, not just reports.
- Balance attention between high-value accounts and stagnant opportunities. Both require action: one drives growth, the other prevents slippage.
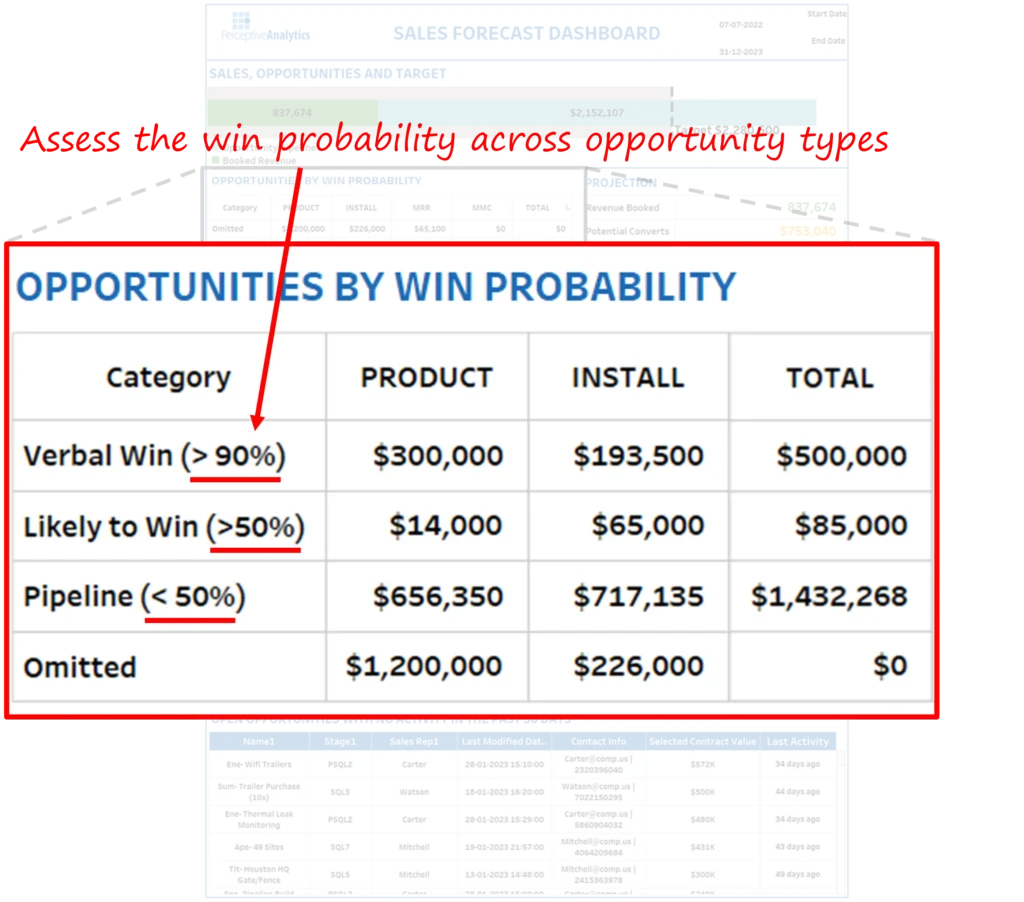
- Integrate win probability to counter optimism bias. Forecasts grounded in probability are more realistic and credible.
- Adopt a single source of truth. When executives trust the dashboard, conversations shift from questioning numbers to deciding actions.
The Sales Forecast Dashboard transformed how the client approached revenue planning. What was once a reactive process riddled with uncertainty became a proactive exercise backed by data, probability, and scenario analysis. Executives gained transparency, managers gained accountability, and the sales team gained focus. For the first time, leadership had a clear, data-backed answer to the most important question: Are we on track to hit our targets, and if not, what must we do to close the gap?
Each month, we curate the latest updates, insights, and trends for senior leaders in data analytics and AI in our CXO Analytics Newsletter.
Our mission is “to enable businesses to unlock value in data.” For over 20 years, we’ve partnered with more than 100 clients—from Fortune 500 companies to mid-sized firms—to solve complex data analytics challenges. Our services include Advanced Analytics Consulting, Generative AI Consulting, and Business Intelligence (Tableau Consultants, Power BI Consultants and Looker Consultants) turning data into strategic insight. We would love to talk to you. Do reach out to us for a free consultation.
Our Work
Industry
- Industry
Function
- Function
-
Increasing Conversions with Adwords Spend Optimizer
How To Optimize Adwords Budget in Real Time
Free Download
-
Markdown Optimization for Retailers
A Methodology to Track Performance and Maximize Value
Free Download
-
Optimizing Marketing Spend with Marketing Mix Modeling
Using Statistical Modeling and Empirical Methods
Free Download
-
Leveraging Web Analytics for Customer Acquisition
Leveraging Web Analytics for Customer Acquisition
Free Download
*Subscribe to be the first one to know our latest updates
Contact us

You have crafted a powerful analytical tool for us. Thank you.
Alan Benjamin
Principal, Benjamin Realty Advisors

I have been working with Chaitanya and Perceptive Analytics for about 20 months now. They did BI / reporting and excel tool development. Their work helped us in channeling our periodic reports to the senior and operational management. The team exceeded my expectations. Chaitanya would ask thought provoking questions that trigger a new line of thinking. They created good dashboards so our senior team can quickly interpret reports. We were able to make progress because the team knew finance and tools they created were easy to implement.
Samir Lavani
CFO at Pearl Hospitality

Chaitanya and the Perceptive Analytics team worked on multiple strategic projects that involved Tableau data visualizations. Perceptive's work (~ 1 year) led to successful launch of our portal - this was an important milestone for us. Visualizations created were insightful, easy to understand and visually attractive. The team often suggested ways to show data in more intuitive way so our audience can understand it. They also knew Tableau well that helped in customizing it for our purposes. The team worked hard to finish the project on time managing expectations. I look forward to working with Perceptive on other projects.
Haroon Yaqoob
Principal at Nomenclature Inc.
