


A CXO Briefing for Life Sciences Leadership
Data platform migrations have become one of the largest infrastructure investment decisions facing Life Sciences organizations. The transition from legacy on-premises warehouses to cloud-native platforms such as Snowflake and Databricks is frequently justified through TCO reduction metrics, processing speed improvements, and operational efficiency gains sourced from vendor case studies. Yet the economics of platform migration in regulated industries carry dimensions that vendor marketing consistently omits: GxP revalidation costs,
dual-running infrastructure during transition, organizational change management, compliance documentation, and long-term platform dependency. This briefing examines how those omitted dimensions change the commercial calculus, and what a rigorous migration business case should actually contain.
EXECUTIVE SUMMARY
Commercial AI is not reaching its limits because algorithms have stopped improving. It is reaching its limits because the infrastructure investment decisions behind those algorithms are being evaluated with incomplete economics.
When Pfizer reported a 57% reduction in total cost of ownership after migrating its analytics infrastructure to Snowflake, the figure became a benchmark. The implementation also delivered 4x faster data processing and approximately 19,000 annual hours saved in analytics workflows. Pfizer consolidated fragmented data sources across Oracle, Teradata, Amazon S3, and desktop spreadsheets into a single platform serving commercial operations, manufacturing, and global supply chain. These are genuine, documented improvements.
The issue is not accuracy. The issue is completeness. Vendor case studies report what the platform delivered after migration. They do not report what the organization invested to arrive there. In Life Sciences, that gap is wider than in any other industry. Regulated enterprises absorb migration costs that simply do not exist in unregulated sectors: Computer System Validation protocols under FDA 21 CFR Part 11, dual-infrastructure operating periods measured in months or years, data integrity verification across GxP-critical systems, and the organizational effort of retraining thousands of analysts and commercial operators on entirely new tooling.
The gap between vendor-reported TCO and the full economic burden of regulated migration is not a data quality problem. It is a structural feature of how platform vendors construct their business cases. Closing that gap requires a fundamentally different approach to evaluating infrastructure investments.
“The next competitive advantage will not come from which platform you selected. It will come from how honestly you accounted for what the migration actually cost, and how effectively you executed against a realistic plan.”
What Pfizer Actually Did, and What the Numbers Actually Show
1.1 – The Migration Was Real, and the Results Were Measurable
Pfizer’s migration addressed a problem familiar to every pharmaceutical company that has grown through acquisition. Data was distributed across Oracle databases, Amazon S3 storage, Teradata warehouses, and individual desktop spreadsheets. The company’s stated objective of ‘One Pfizer’ required consolidating this landscape into a unified platform capable of serving commercial operations, sales and marketing, manufacturing, and global supply chain simultaneously.
The published results are substantial. Moving away from proprietary data warehouses initially cut data processing costs by approximately 40%, with a further 28% reduction in compute costs. Additional optimization measures – including usage dashboards recommended by Snowflake’s advisory team – brought the total TCO reduction to 57%. Field representatives who previously waited up to an hour for reports could access them in roughly 40 seconds. Analytics teams using Snowpark reduced a 37-minute processing cycle to approximately eight minutes, contributing to the 19,000 annual hours saved.
These improvements reflect genuine advantages of cloud migration done well: elastic compute, separation of storage and processing, reduced database administration overhead, and dramatically improved concurrent access across a global workforce.
1.2 – The Denominator Problem in Vendor TCO Claims
The 57% figure compares Snowflake’s ongoing platform costs against the legacy infrastructure it replaced. This is a legitimate comparison for what it measures. The issue is what it excludes.
TCO as calculated in vendor case studies typically encompasses licensing, compute, storage, and basic administration. For a company employing 80,000 people across six continents, the costs falling outside that calculation are substantial: migration engineering and data pipeline reconstruction, dual infrastructure costs during the transition period where both systems must operate simultaneously, retraining and organizational change management across thousands of users, integration development connecting the new platform to existing CRM, ERP, and regulatory systems, and ongoing cost optimization effort. Notably, the final 17 percentage points of Pfizer’s savings came from post-migration optimization, not from the migration itself.
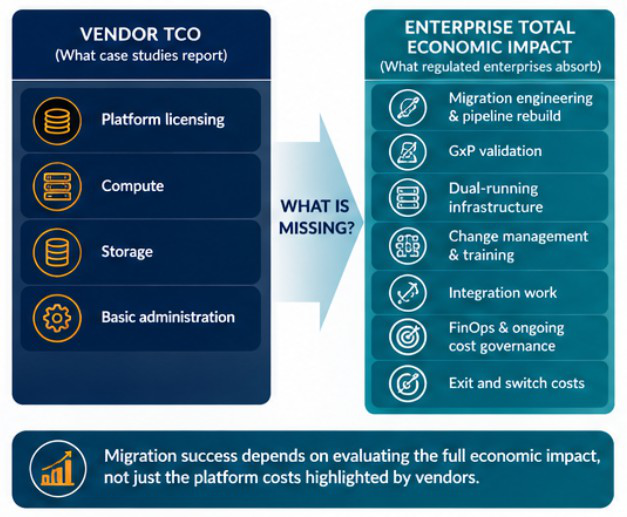
Figure 1: Vendor TCO Vs Enterprise total economic impact
Another pharmaceutical company reading ‘57% TCO reduction’ and applying that figure to its own business case without adjusting for these dimensions is almost certainly underestimating the total investment required. The number is real. The denominator it uses is incomplete.
1.3 – Cloud Economics Introduce a Different Category of Financial Risk
Legacy data warehouses offered cost predictability. Annual licensing, hardware refresh cycles, and staffing requirements were relatively stable. Cloud platforms operate on
consumption-based pricing models that introduce financial variability most pharmaceutical finance teams have not previously managed.
Snowflake’s credit-based billing charges per second of virtual warehouse activity with a
60-second minimum whenever a warehouse wakes from suspension. For workloads with frequent short queries – common in commercial BI environments – this minimum can mean paying for 60 seconds of compute for a query that executes in three. Cross-region data transfer carries egress charges of $90 to $155 per terabyte. Serverless features such as automatic clustering and materialized views accrue credits proportional to data volume and change frequency, often without direct user visibility. Compute typically represents 60 to 80% of total Snowflake spending, and without active governance, cloud costs can grow 20 to 30% monthly simply because provisioning resources is far easier than deprovisioning them.
A migration that reduces Year 1 costs by 57% can quietly erode those savings in subsequent years without mature FinOps capabilities. This is not a flaw in cloud architecture. It is a consequence of moving from fixed-cost to variable-cost infrastructure without adapting financial governance accordingly.
Organizations seeking to control these variable cloud costs should also consider the governance practices required after migration. Our article on Pharma Commercial Data Engineering for AI Readiness explores how modern data engineering improves platform efficiency, governance, and long-term AI readiness.
PERCEPTIVE ANALYTICS PERSPECTIVE
Vendor TCO claims measure what the platform costs after migration. They do not measure what the migration costs. At Perceptive Analytics, we recommend that commercial leaders evaluate platform migration economics using a Total Economic Impact framework that captures transition costs, dual-running periods, organizational disruption, and five-year consumption projections. The question should never be ‘How much will we save?’ It should be ‘How long before cumulative savings exceed cumulative transition costs, and how confident are we in the consumption trajectory?’
The Hidden Cost Structure of Regulated Migration
2.1 – GxP Validation Transforms a Technology Project into a Compliance Event
In unregulated industries, a data platform migration is a technology project. In Life Sciences, it is simultaneously a technology project and a regulatory event. Any system touching data governed under FDA 21 CFR Part 11, EU GMP Annex 11, or related GxP frameworks must be validated before production use. Migration triggers complete revalidation of all GxP-relevant functions, comprehensive data migration verification, updated validation documentation, and regulatory impact assessments for every affected business process.
Industry analysis indicates that validation workstreams typically consume 30 to 40% of the total migration effort in pharmaceutical environments. The average remediation cost from a single FDA data-integrity warning letter – the kind of consequence that results from inadequate migration validation exceeds 2.5 million. Vendor case studies never report these costs, because they are incurred entirely by the customer.
2.2 – Organizational Complexity Multiplies Transition Timelines
Platform migrations require thousands of employees to change how they access, analyze, and act on data. csvIn pharmaceutical environments, where established workflows carry implicit compliance significance, this resistance is both more intense and more justified. Changing a validated process is not merely inconvenient. It can create regulatory exposure.
Pfizer’s case illustrates the scale involved. Each legacy source – Oracle, Teradata, Amazon S3, desktop spreadsheets – had its own query patterns, reporting tools, and institutional knowledge. Creating the ‘Virtual Analytics Workspace’ on Snowpark required analysts to adopt entirely new code libraries. These transitions demand structured training programmes, parallel operating periods, new standard operating procedures, and sustained leadership sponsorship over months of change management activity.
2.3 – The Cost Valley Is Where Migration Business Cases Fail
No enterprise migrates its data infrastructure overnight. During the transition period – typically 12 to 24 months for large pharmaceutical organizations – both legacy and target platforms must operate simultaneously. Legacy licensing does not stop the day the new platform goes live.
Industry practitioners report that this dual-running phase can temporarily double IT infrastructure budgets. Migration projects often incur $200,000 to $500,000 in data transfer costs alone, with legacy contracts frequently including minimum commitment periods or early termination penalties.
This creates a cost valley: a period of elevated total spending that must be traversed before savings materialize. The most common failure mode in migration programmes is not that projected savings never arrive. It is that interim costs exceed expectations, causing executive leadership to lose confidence in the programme before the valley has been crossed.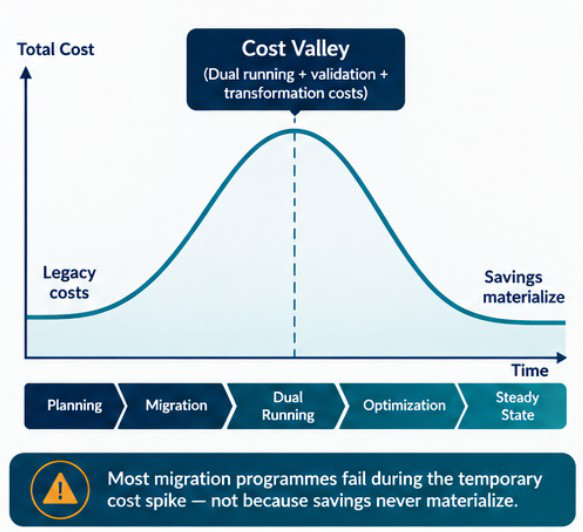
Figure 2: The migration cost valley graph
PERCEPTIVE ANALYTICS PERSPECTIVE
The distinction between vendor TCO and enterprise Total Economic Impact determines whether a migration business case survives its first board review. At Perceptive Analytics, we have observed that the strongest migration outcomes come from organizations that presented realistic cost valleys to their leadership upfront, secured dedicated transition budgets separate from ongoing infrastructure spending, and measured success against capability milestones rather than Day 1 savings claims. Credibility in the business case is what protects the programme when complications arise.
Platform Selection Is a Decade-Long Infrastructure Commitment
3.1 – Workload Characteristics Should Drive Platform Choice, Not Vendor Benchmarks
Life Sciences data infrastructure needs are unusually heterogeneous. Commercial analytics, real-world evidence generation, clinical trial data management, genomic research, supply chain optimization, and regulatory reporting each carry different computational profiles, compliance requirements, and user populations. No single platform excels equally across all of these workloads.
Organizations evaluating cloud platforms should first establish a workload-driven data strategy rather than comparing vendor benchmarks in isolation. Learn how Perceptive Analytics helps Life Sciences organizations modernize commercial data platforms through our Pharma Commercial Analytics & Business Intelligence solutions.
Snowflake’s architecture delivers genuine advantages for SQL-intensive analytics, concurrent BI reporting, and governed data sharing across organizational boundaries – precisely the workloads that dominated Pfizer’s migration scope. Databricks provides superior capabilities for machine learning pipelines, large-scale genomic processing, and complex data engineering. Regeneron’s deployment illustrates this distinction clearly: the company built biobank-scale genomic pipelines processing data from over 400,000 sequenced exomes, achieving a 600x improvement in query runtime on its full dataset. That workload profile is fundamentally different from the SQL analytics and concurrent reporting that drove Pfizer’s business case.
Benchmarking one platform’s TCO against another without first mapping which workloads will run, produces misleading comparisons. A 57% reduction achieved on commercial analytics workloads does not predict what the same organization would experience migrating genomics or clinical trial infrastructure. Platform selection requires workload mapping before vendor evaluation.
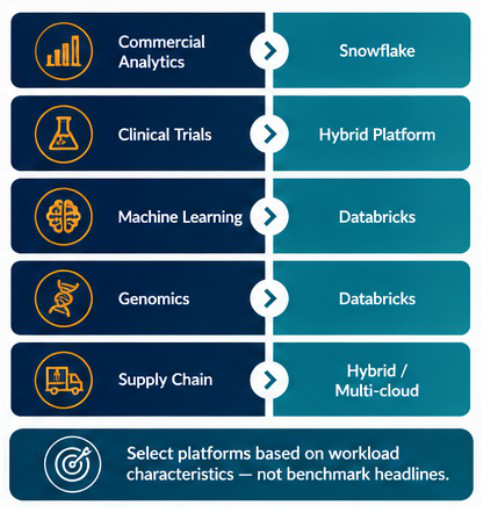
Figure 3: Platform selection for different workloads
3.2 – Regulatory Validation Creates Structural Lock-In That Exceeds Commercial Contracts
Platform dependency concerns exist in every industry, but Life Sciences amplifies them through regulatory mechanics. Once a pharmaceutical company has validated a data platform under GxP protocols, switching platforms triggers complete revalidation – not merely of the platform itself, but of every downstream system, workflow, and report that depends on it. This structural
lock-n extends well beyond standard commercial contract terms and creates switching costs that compound over time as more systems become dependent on the validated environment.
As of 2026, more than 150 AI vendors operate in the pharmaceutical market, with M&A activity expected to consolidate the landscape further. This creates a second-order risk: organizations may commit to specialist vendors that are subsequently acquired, changing product direction, pricing, or support terms in ways the original contract did not anticipate. Data portability rights, API access guarantees, and migration support provisions should be negotiated
before signing initial contracts, when leverage is highest. These provisions cost relatively little to secure upfront but become extraordinarily expensive to obtain after operational dependency is established.
3.3 – Multi-Platform Architectures Are Replacing Single-Vendor Consolidation
Rather than selecting a single platform, sophisticated pharmaceutical organizations are deploying multiple platforms optimized for different workload categories. Novartis operates a technology stack spanning SAP S/4HANA, Snowflake, AWS, Microsoft Azure, Veeva Systems, Oracle, and Tableau, with different platforms serving different functional domains. This approach trades operational simplicity for workload optimization and risk diversification.
The trade-off demands stronger data governance, more sophisticated integration architecture, and clear ownership of which workloads belong on which platform. But it reduces dependency on any single vendor and allows the organization to adopt best-of-breed capabilities for each domain. The organizations currently deriving the most value from their cloud investments are not those that consolidate everything onto one platform. They are those that match platforms to workloads with disciplined architecture and governed data flow across environments.
PERCEPTIVE ANALYTICS PERSPECTIVE
Platform selection in Life Sciences is a ten-year infrastructure commitment. The validation costs, organizational dependencies, and integration architectures created during migration constrain the organization’s technology options for the duration of the platform lifecycle. At Perceptive Analytics, we advise commercial leaders to evaluate platform decisions through three lenses simultaneously: workload fit, total economic impact over the platform’s expected life, and exit cost if circumstances require a change. Organizations that evaluate only the first lens consistently underestimate the second and discover the third too late.
Constructing a Migration Business Case for Regulated Enterprises
4.1 – Replace Vendor TCO with a Five-Year Total Economic Impact Model
A rigorous migration business case should capture every material cost category across a
five-year horizon. At minimum, this includes platform licensing and consumption projections (modelled under optimistic, expected, and pessimistic usage scenarios), migration engineering including data pipeline reconstruction and ETL redesign, GxP validation and Computer System Validation for every affected system, dual-running infrastructure costs during the transition period, organizational change management including training and workflow documentation, integration development, ongoing FinOps staffing, and projected exit costs if the platform must later be replaced.
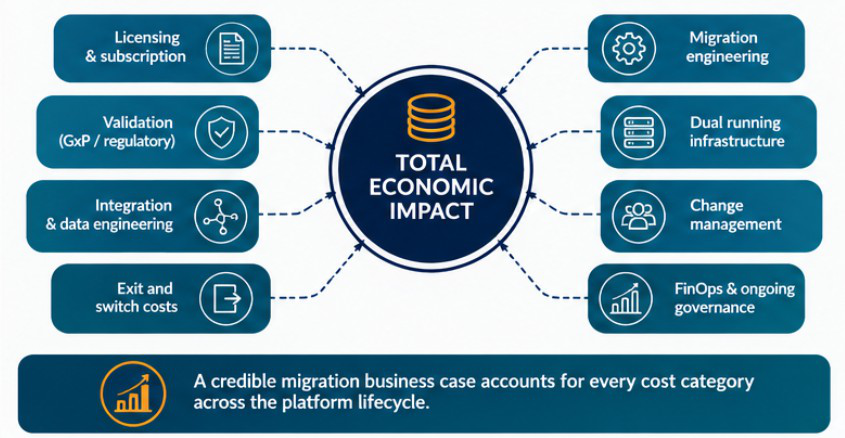
Figure 4: Five-Year business case framework
When these categories are populated honestly, the payback period for most enterprise-scale migrations extends well beyond the first year. That does not make the migration inadvisable. It often remains the correct strategic decision. It does mean that business cases built on vendor comparisons alone set expectations that the first two years of actual spending will consistently violate.
4.2 – Frame Success Around Capability Milestones, Not Financial Returns
Pfizer’s most valuable migration outcomes were not the cost savings. They were capabilities that cost metrics cannot capture: enterprise-wide data sharing that eliminated cumbersome ETL processes, concurrent access that removed reporting bottlenecks for 80,000 employees,
cross-region collaboration supporting global supply chain visibility, and a unified data foundation positioned for AI and advanced analytics initiatives.
A more defensible approach to migration ROI defines success through capability milestones: the date at which all commercial users operate from a single data environment, the date at which field reporting latency drops below a target threshold, the date at which new data sources can be onboarded within a defined timeframe. These milestones are measurable, meaningful to commercial leadership, and less susceptible to the accounting ambiguities that surround TCO comparisons.
4.3 – Establish FinOps Governance Before Cutover, Not After
The final 17 percentage points of Pfizer’s TCO reduction came from post-migration cost optimization – not from the migration itself. This detail, easily overlooked in the headline figure, reveals that cloud economics require continuous management in ways that legacy infrastructure did not.
Industry data indicates that 27% of global cloud spending represents waste. At 2025 spending levels, that figure translates to roughly $182 billion annually in unused or poorly optimized resources. Without dedicated FinOps capability established before migration, cloud spending drifts upward as teams provision resources without deprovisioning them, as data volumes grow without storage optimization, and as new features introduce incremental credit consumption that compounds over time. Initial TCO improvements can erode within 18 to 24 months if consumption governance is treated as an afterthought rather than a prerequisite.
PERCEPTIVE ANALYTICS PERSPECTIVE
The strongest migration business cases we have reviewed at Perceptive Analytics share a common characteristic: conservative financial projections alongside ambitious capability objectives. Savings that arrive ahead of conservative projections build leadership confidence. Capability milestones demonstrate strategic value even during periods of elevated transition spending. Organizations that reverse this – aggressive financial projections with vague capability definitions – consistently face budget scrutiny before the migration has had time to deliver its full value.
Why the Quality of Migration Execution Will Define the Next Decade of Commercial Performance
5.1 – Platform Infrastructure Is Becoming the Rate Limiter for Commercial AI
Cloud adoption in pharmaceutical organizations has reached near-universal levels. Approximately 83% of pharmaceutical companies now leverage cloud solutions in some form, with 40% reporting fully cloud-enabled operations. Global pharmaceutical investment in AI is estimated at $2.51 billion in 2026, growing to $16.49 billion by 2034. Every dollar of that AI investment depends on data infrastructure capable of serving models with clean, timely, well-governed inputs.
This dependency creates an underappreciated risk. An organization that rushes migration to capture TCO savings may arrive at a platform that serves BI workloads adequately but lacks the architectural flexibility for the ML pipelines, real-world evidence platforms, and generative AI applications that will define commercial capability over the next five to ten years. The platform decisions being made now are not simply about reducing today’s costs. They are about whether the data foundation will support or constrain tomorrow’s commercial strategy.
5.2 – Migration Execution Quality Compounds Over Time
Pfizer’s migration delivered more than cost savings. It created a unified governance model across business domains, enabled cross-regional data collaboration that previously required manual file transfer, and built a foundation flexible enough to support future use cases that did not exist at the time of migration. These compounding benefits – improved AI readiness, faster onboarding of new data sources, reduced friction in M&A integration – represent returns that grow larger with each year the platform operates.
A poorly executed migration creates the opposite dynamic. Technical debt from rushed data pipeline reconstruction, incomplete validation documentation that creates ongoing compliance risk, undertrained users who revert to shadow analytics in spreadsheets, and an architecture that was optimized for the vendor’s benchmark workload rather than the organization’s actual needs all generate costs that compound rather than diminish over time.
5.3 – The Capability-First Frame Changes Everything About the Business Case
Platform migration should be evaluated not as a cost optimization exercise that may also enable new capabilities, but as a capability transformation that will also change cost structures. When the strategic frame is capability-first, the business case naturally incorporates the full investment required, because capability milestones demand adequate resourcing. When the frame is cost-first, the business case naturally minimizes investment to protect projected savings, which increases the probability that capability objectives are compromised during execution.
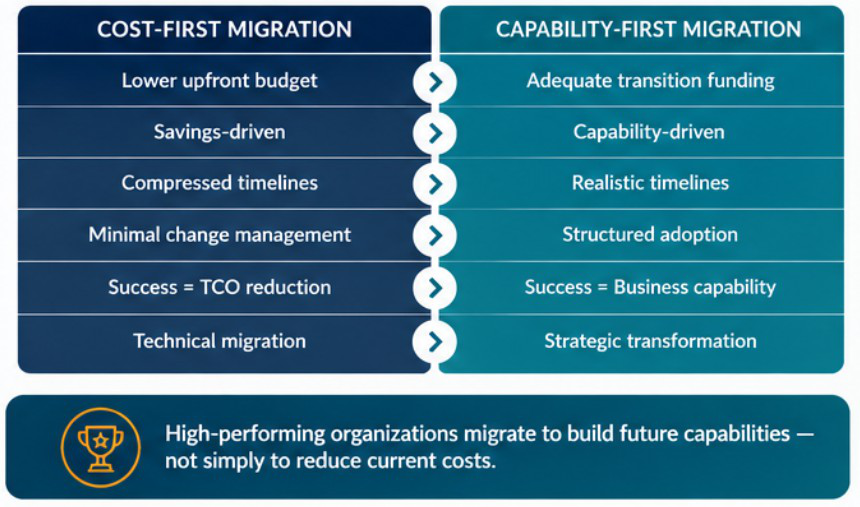
Figure 5: A tabular comparison of cost-first vs capability-first migration
This distinction is not semantic. It determines budget allocation, timeline expectations, executive sponsorship, and ultimately whether the organization emerges from migration with infrastructure that accelerates innovation or infrastructure that requires remediation before innovation can begin.
PERCEPTIVE ANALYTICS PERSPECTIVE
Data platform infrastructure decisions made during this period will compound for years. The question confronting Life Sciences leadership is not ‘Which platform offers the best TCO?’ It is ‘Which investment approach evaluated across the full spectrum of transition costs, capability requirements, and long-term platform economics, positions this organization to compete effectively in an AI-enabled commercial environment?’ At Perceptive Analytics, we believe the commercial leaders of the next decade will be distinguished not by which platform they selected, but by how rigorously they evaluated the full cost and capability implications of that decision.
Conclusion
Pfizer’s 57% TCO reduction is a real number attached to a real implementation. It should be studied and respected. It should not be transplanted into another organization’s business case without accounting for the dimensions it does not capture: validation costs, organizational change, dual-running infrastructure, platform-workload matching, and the ongoing investment required to sustain cloud economics over time.
Life Sciences is in the midst of the largest data infrastructure investment cycle in its history. The platforms selected and the migrations executed now will define commercial infrastructure for the next decade. The organizations that build the strongest foundations will not be those that quoted the most impressive vendor statistics in their board presentations. They will be those that modelled the full economic reality, secured adequate transition budgets, matched platforms to workloads with discipline, and measured success through capability milestones rather than headline cost comparisons.
The platform migration paradox is this: the very organizations with the most to gain from modernizing their data infrastructure – large, regulated, globally distributed pharmaceutical companies – are also the organizations for which migration costs most significantly exceed vendor projections. Acknowledging that paradox honestly is not a reason to delay migration. It is the prerequisite for executing it successfully.
At Perceptive Analytics, we help Life Sciences organizations evaluate cloud platform investments beyond vendor TCO claims by incorporating migration economics, regulatory considerations, commercial analytics requirements, and long-term AI readiness into a comprehensive business case. Organizations looking for expert guidance can explore our Commercial Analytics consulting services.
“The next competitive advantage will not come from which platform you selected. It will come from how honestly you accounted for what the migration actually cost, and how effectively you executed against a realistic plan.”
References
Sources and Methodology
All statistics in this briefing are drawn from the following primary research, surveys, regulatory publications, consulting reports and enterprise case studies, verified at the time of writing. Sources marked with an asterisk (*) have been independently cross-verified against at least one secondary source for figures cited in this document.
Primary Sources
- SnowflakeCustomer Case Study: Pfizer *
- SnowflakePricing and Cost Optimization Documentation
- DatabricksCustomer Case Study: Regeneron *
- Accenture/ Novartis Life Sciences Digital Transformation Case Study
- Novartis/ AWS Clinical Trial Data Platform Implementation
Peer-reviewed and Industry Analysis
- IntuitionLabs,Databricks Snowflake for Life Sciences: A Comparison, February 2026 *
- IntuitionLabs,Pharma Data Engineering: GxP-Compliant AI Pipelines, June 2026 *
- IntuitionLabs,State-of-the-Art Data Warehousing in Life Sciences, May 2026
- SakaraDigital, SAP S/4HANA Migration for Pharma, April 2026
- SakaraDigital, The Hidden Cost of AI Vendor Lock-In in Regulated Life Sciences, June 2026
Regulatory and Consulting Research
- Gartner,Worldwide IT Spending Forecast, April 2026 *
- Gartner,Worldwide Public Cloud End-User Spending Forecast, November 2024
- FlexeraState of the Cloud Report, 2025 *
- RedressCompliance, Pharmaceutical Software Licensing and GxP Compliance, 2024
- McKinseyand Company, Transformation Failure Rates Research
- Gartner,Worldwide IT Spending Forecast, April 2026 *
- Gartner,Worldwide Public Cloud End-User Spending Forecast, November 2024
- MasterControl,The Cost of FDA Warning Letters and Data Integrity Failures, 2023
- PrecedenceResearch, Artificial Intelligence in Drug Discovery Market Size, Share and Trends Forecast, 2025–2034
- PwC,Cloud Business Survey, 2023
Enterprise Case Studies
- PfizerSnowflake Migration (published Snowflake customer story)
- NovartisMulti-Cloud Analytics Platform (published Accenture case study)
- RegeneronGenetics Center Databricks Deployment (published Databricks customer story)
- ChiesiFarmaceutici SAP S/4HANA Cloud Migration (published SAP case study)
Methodology Notes
This briefing was developed using a structured research methodology combining vendor-published case studies, enterprise implementation documentation, industry analyst research, regulatory compliance literature, and cloud pricing analysis. Evidence was prioritized based on source credibility, publication recency, and relevance to Life Sciences platform migration economics. Vendor-reported metrics were contextualized against independently published analyses of migration costs in regulated industries. Key findings were cross-verified across multiple independent sources wherever possible, while areas with limited public evidence were identified accordingly.