


Driving Profitability Insights with Tableau: Sales and Margin Summary for a $600M Food Manufacturer
Executive Summary
- Client: Mid-sized food manufacturing company with ~$600M annual revenue and ~500 employees
- Challenge: Limited visibility into profitable vs. unprofitable products, categories, and customers; executives relied on static Excel sheets updated monthly, leading to late detection of revenue leakage
- Tools Used: Tableau, Excel, SQL
- Solution: Developed an interactive Sales & Margin Summary Dashboard in Tableau with drill-down from executive KPIs to category, product, and customer transaction-level detail
- Impact:
- Identified declining categories earlier, saving millions in potential lost revenue
- Reduced sales variance investigation time by 60%
- Enabled early detection of margin leakage in unprofitable accounts
- Equipped sales teams with customer-level insights, cutting pre-meeting prep time by ~50%
- Shifted leadership reviews from static reporting to data-driven strategic discussions
- Identified declining categories earlier, saving millions in potential lost revenue
Introduction and Business Context
In the highly competitive food and beverage industry, where margins are thin and customer loyalty is volatile, executives need more than just top-line revenue reports. They require timely insights into what drives profitability, where revenue leaks, and which customer groups deliver the highest returns.
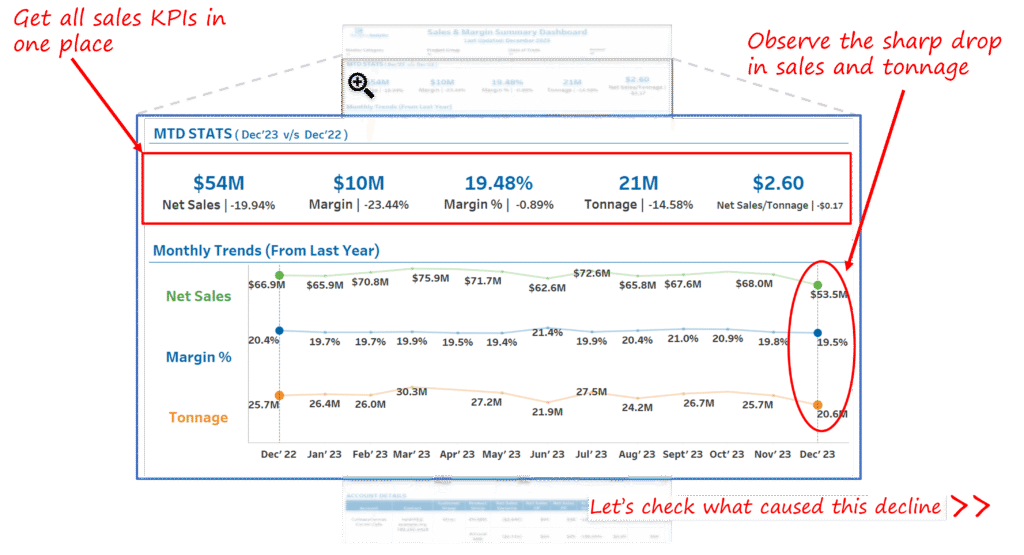
Our client, a food manufacturer with annual revenues of ~$600M, had strong sales but lacked clarity into what truly made the business profitable. While their finance and sales teams had access to Excel-based reports, these were updated only monthly or quarterly. This delay meant that crucial signals — like a sharp drop in sales for a profitable beverage line — were often detected too late.
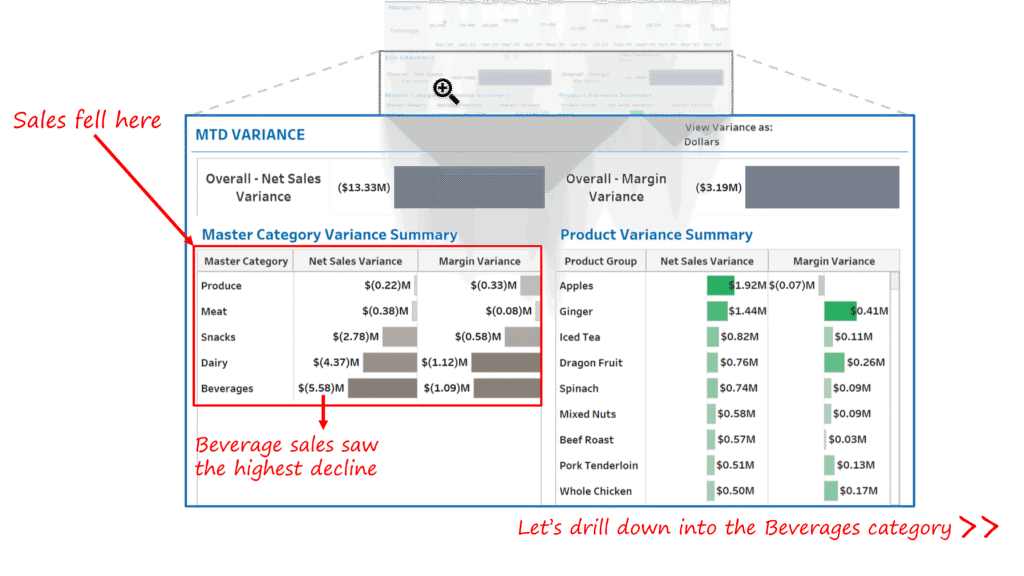
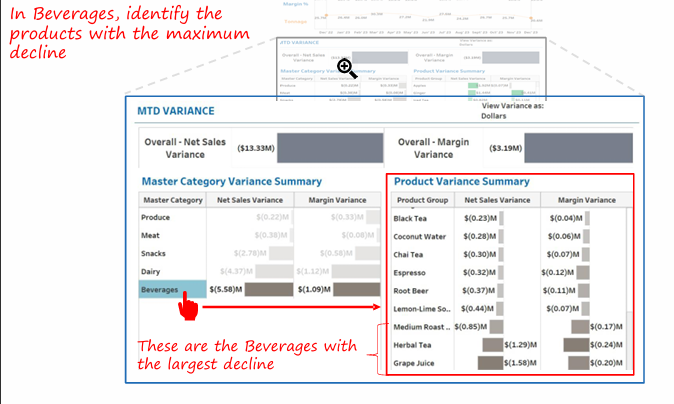
For example, beverages, a critical category, showed a double-digit percentage decline in volume and margin contribution in one quarter. Yet the issue wasn’t flagged until quarterly reviews, missing the opportunity for immediate course correction. Executives were frustrated by reactive reporting cycles, and sales teams were left unprepared for customer conversations.
The leadership’s goal was clear: build a solution that not only monitored topline sales but also highlighted margin drivers, identified unprofitable accounts, and gave leaders a real-time, drillable view into business performance.
Business Objectives
The engagement was designed to meet five clear goals:
- Pinpoint profitable vs. unprofitable categories and accounts
- Provide clarity on which categories and customers contributed to positive margins and which eroded profitability.
- Provide clarity on which categories and customers contributed to positive margins and which eroded profitability.
- Enable drill-down analysis of sales variances
- Move beyond static KPIs to allow executives to drill into categories, products, and even customer transactions.
- Move beyond static KPIs to allow executives to drill into categories, products, and even customer transactions.
- Detect early signals of revenue or margin leakage
- Highlight variances quickly enough to enable action before quarter-end.
- Highlight variances quickly enough to enable action before quarter-end.
- Support strategic account management
- Equip sales reps with customer-specific sales and margin trends for more effective conversations.
- Equip sales reps with customer-specific sales and margin trends for more effective conversations.
- Reduce reporting complexity and analysis time
- Cut down manual effort and move leadership discussions from descriptive to prescriptive.
Outcomes and Measurable Impact
The implementation of the Tableau Sales & Margin Summary Dashboard delivered tangible business impact within weeks of rollout.
- Revenue Protection through Early Detection
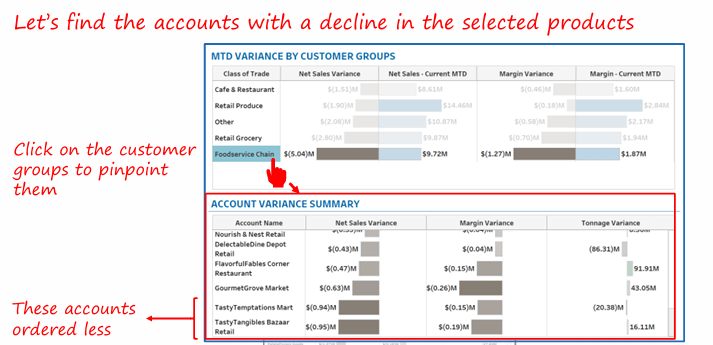
Executives identified a 12% drop in beverage sales mid-quarter, compared to last year’s baseline. With drill-down, they traced the decline to two specific SKUs and three major accounts. Corrective promotions were rolled out immediately, preventing what could have been a multi-million dollar revenue loss. - Improved Margin Visibility
The dashboard highlighted accounts with <10% gross margin contribution, previously hidden in aggregated reports. Sales leaders renegotiated contracts and focused incentives on high-margin accounts, leading to an estimated 6% improvement in overall gross margin within two quarters. - Faster Sales Variance Analysis
What previously took analysts 4–5 hours of Excel manipulation could now be completed in under 30 minutes through Tableau’s interactive filters and drill-down. Executives could move from KPI → category → customer in real time during boardroom discussions. - Strategic Sales Planning
Leadership began using the dashboard in monthly and weekly reviews. The ability to filter by customer group and product line meant sales meetings shifted from “what happened last month” to “what do we need to do next week.” - Sales Team Enablement
Account managers preparing for client meetings reported that pre-meeting prep time dropped by ~50%, as they no longer had to rely on fragmented CRM exports. Instead, they used Tableau’s customer-level view to track order patterns, tonnage, and margin trends.
Our Approach
KPI Discovery and Alignment
We began by aligning business stakeholders on the most critical KPIs. While revenue was already tracked, executives emphasized gross margin %, variance to plan, and volume tonnage as equally important. Defining “what counts as profitable” ensured consistency across sales, finance, and executive teams.
Workshops with regional managers also revealed the need for variance breakdowns: executives didn’t just want to know that sales had declined, but whether the variance came from pricing, volume, or customer mix.
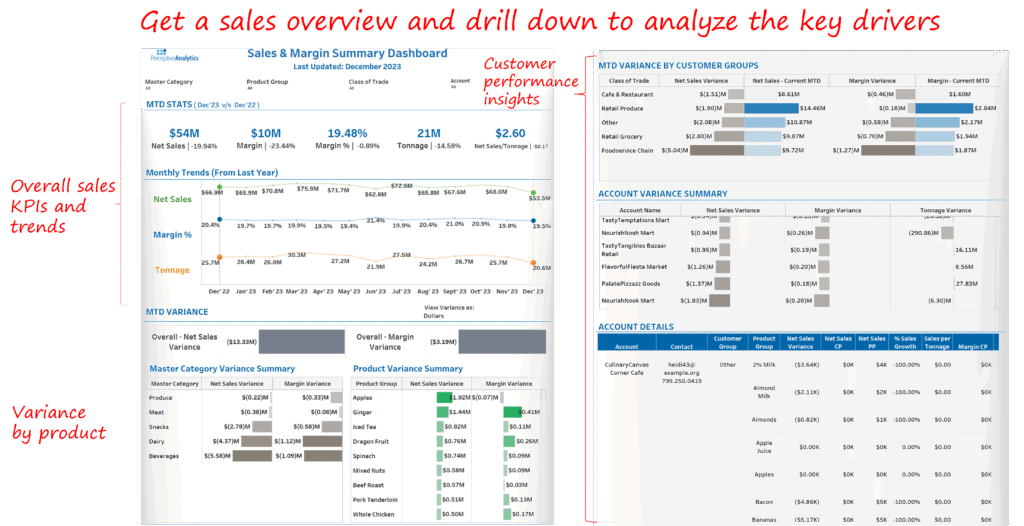
Dashboard Design in Tableau
Our design philosophy was to build a layered UX that allowed executives to start at a high-level KPI summary and progressively drill into categories, products, and transactions.
- Executive Summary KPIs: Topline sales, margin %, variance from plan
- Category Drill-Down: Comparative view of performance across product groups (e.g., beverages vs. bakery)
- Customer Performance: Variance trends by customer group, flagging unprofitable accounts
- Transaction-Level Detail: Line-item sales with tonnage, gross margin, and variance
Color-coding was used consistently: green for growth, red for decline. Leaders appreciated the at-a-glance clarity, especially during boardroom reviews.
Customer-Centric Analysis
One of the key differentiators of this dashboard was its ability to link profitability to specific customer groups.
By grouping customers into segments (e.g., retail chains, distributors, wholesale), the dashboard surfaced accounts where margins were eroding despite strong sales volume. For instance, one retail chain was contributing $4M in sales but with only a 5% margin, dragging down overall category performance. This insight enabled renegotiation of pricing and terms.
Sales reps also benefited from customer-level transaction tables, which they used for pre-meeting preparation. Instead of navigating between CRM, ERP, and Excel, they had a single view showing order history, tonnage, and margin contribution.
Iterative Refinement
We ran iterative feedback loops with both executives and field sales managers to ensure adoption.
- Executives requested simplified navigation and additional filters (e.g., by tonnage and SKU).
- Sales managers requested built-in transaction details to prepare for account meetings.
Incorporating this feedback created a tool that was not only a reporting dashboard but also a day-to-day sales enablement platform.
Key Learnings and Recommendations
- Margin Focus Must Accompany Sales Growth
Many organizations track revenue growth but miss hidden margin erosion. Building both into the same dashboard is essential for profitability management. - CXO Dashboards Should Layer Simplicity and Depth
Executives need high-level KPIs at a glance, but with the ability to drill down for clarity. Tableau’s design allowed us to deliver both without overwhelming the user. - Customer-Centric Profitability is a Strategic Advantage
By segmenting customers into profitable vs. unprofitable, the company shifted from treating all accounts equally to prioritizing those driving long-term value. - Adoption is Tied to Usability
Iterative refinement ensured adoption. By embedding transaction-level detail, sales teams integrated the dashboard into daily workflows, increasing ROI on the solution. - Recommendation: Organizations should review margin leakage monthly and combine sales + margin variance reviews into one strategic conversation, rather than siloing them across finance and sales.
Conclusion
The Sales & Margin Summary Dashboard transformed the way this $600M food manufacturer managed its business. What once was a reactive reporting cycle based on static Excel files became a proactive, data-driven process that balanced revenue growth with profitability insights.
Executives could now see the big picture, drill into variances, and act before quarter-end. Sales teams were empowered with customer-level insights, enabling faster, more informed conversations. Most importantly, the organization shifted from chasing revenue alone to building a strategy anchored in sustainable margin growth.
Each month, we curate the latest updates, insights, and trends for senior leaders in data analytics and AI in our CXO Analytics Newsletter.
Our mission is “to enable businesses to unlock value in data.” For over 20 years, we’ve partnered with more than 100 clients—from Fortune 500 companies to mid-sized firms—to solve complex data analytics challenges. Our services include Advanced Analytics Consulting, Generative AI Consulting, and Business Intelligence (Tableau Consultants, Power BI Consultants and Looker Consultants) turning data into strategic insight. We would love to talk to you. Do reach out to us for a free consultation.
Our Work
Industry
- Industry
Function
- Function
-
Increasing Conversions with Adwords Spend Optimizer
How To Optimize Adwords Budget in Real Time
Free Download
-
Markdown Optimization for Retailers
A Methodology to Track Performance and Maximize Value
Free Download
-
Optimizing Marketing Spend with Marketing Mix Modeling
Using Statistical Modeling and Empirical Methods
Free Download
-
Leveraging Web Analytics for Customer Acquisition
Leveraging Web Analytics for Customer Acquisition
Free Download
*Subscribe to be the first one to know our latest updates
Contact us

You have crafted a powerful analytical tool for us. Thank you.
Alan Benjamin
Principal, Benjamin Realty Advisors

I have been working with Chaitanya and Perceptive Analytics for about 20 months now. They did BI / reporting and excel tool development. Their work helped us in channeling our periodic reports to the senior and operational management. The team exceeded my expectations. Chaitanya would ask thought provoking questions that trigger a new line of thinking. They created good dashboards so our senior team can quickly interpret reports. We were able to make progress because the team knew finance and tools they created were easy to implement.
Samir Lavani
CFO at Pearl Hospitality

Chaitanya and the Perceptive Analytics team worked on multiple strategic projects that involved Tableau data visualizations. Perceptive's work (~ 1 year) led to successful launch of our portal - this was an important milestone for us. Visualizations created were insightful, easy to understand and visually attractive. The team often suggested ways to show data in more intuitive way so our audience can understand it. They also knew Tableau well that helped in customizing it for our purposes. The team worked hard to finish the project on time managing expectations. I look forward to working with Perceptive on other projects.
Haroon Yaqoob
Principal at Nomenclature Inc.
