


Introduction
Marketing leaders today are expected to move beyond brand visibility and drive measurable business outcomes acquisition efficiency, customer lifetime value, and return on investment. This demands more than just data access; it requires the right dashboards that distil complexity into action.
This article curates ten high-impact dashboards that give C-suite marketing executives a clear line of sight into the performance levers that matter most. Spanning the entire customer journey from segmentation and acquisition to channel attribution, campaign profitability, and email efficiency these dashboards are designed to support faster, sharper decisions across modern marketing organizations.
Each dashboard has been selected for its strategic clarity, operational relevance, and ability to surface key insights at a glance. The goal: help CMOs and VPs of Marketing focus on what moves the needle.
| Sr. No | Dashboard | Key takeaway — why this matters for CMOs |
| 1 | Executive Marketing Dashboard | Links paid channel ROI to occupancy, conversions, and customer experience, ensuring spend ties directly to outcomes |
| 2 | Customer Lifetime Value Dashboard | Breaks CLTV into orders, margin, and lifespan, enabling smarter acquisition and retention strategies |
| 3 | Customer Acquisition Cost Analysis Dashboard | Surfaces CAC by channel, product, and geography, exposing inefficiencies and high-cost segments |
| 4 | Channel Attribution & ROAS Dashboard | Compares attribution models to reveal true channel contribution, improving return on ad spend decisions |
| 5 | Customer Segmentation & Transaction Analytics Dashboard | Profiles customers by value, recency, frequency, and geography, powering precise targeting and retention |
| 6 | Spend Allocation & Channel Efficiency Dashboard | Connects spend to impressions, leads, and downloads, highlighting underperforming channels for reallocation |
| 7 | Funnel Performance Dashboard | Gives full visibility from website users to ARR, isolating channel contribution and conversion velocity |
| 8 | Email Marketing Campaigns Dashboard | Tracks campaign lifecycle KPIs, highlighting engagement drops and subscriber fatigue risks |
| 9 | Lead Generation Dashboard | Provides real-time visibility into lead volume, quality, cost, and source performance to guide pipeline growth |
| 10 | NPS Dashboard | Surfaces satisfaction by feature, channel, and geography, combining NPS with verbatims for action-ready insight |
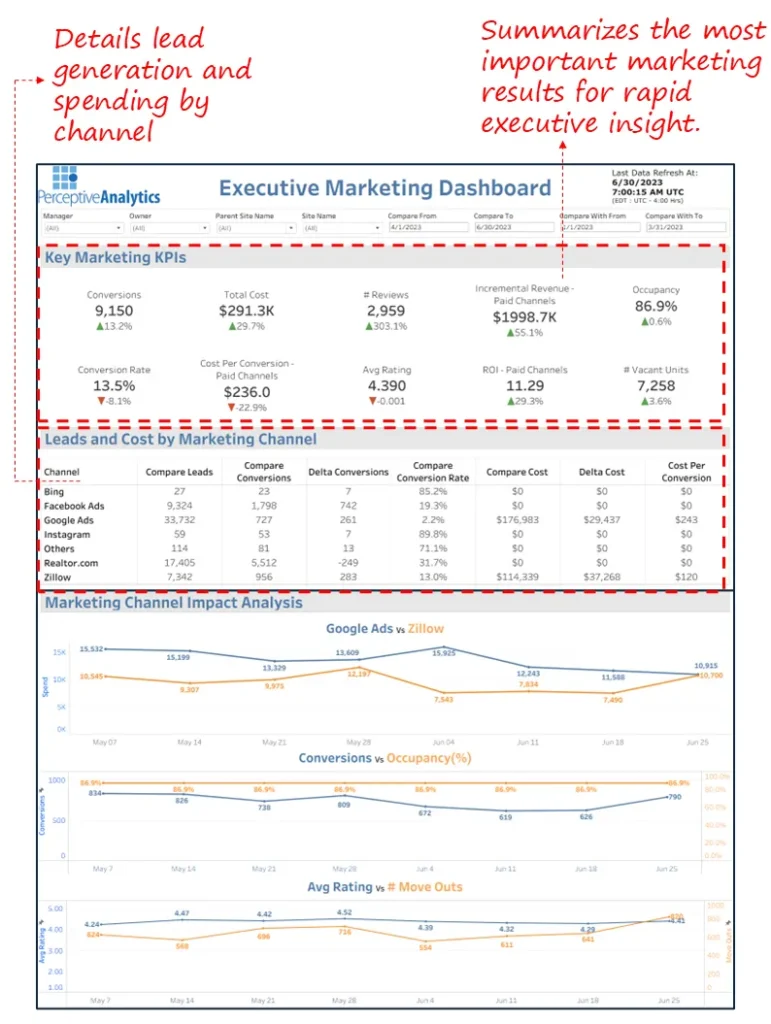
1. Executive Marketing Dashboard
Industry Fit
Real estate, hospitality, multi-location retail, or service chains with significant online-to-offline customer acquisition channels.
Most Relevant For
CMOs, Growth Leaders, and Regional Marketing Directors overseeing channel performance and ROI across sites.
Objective
To track high-level marketing performance across paid channels focusing on conversions, cost efficiency, and the impact of channel activity on occupancy, ratings, and move-outs.
What’s Good About This Dashboard
- Clearly separates paid channel ROI from overall marketing spend for sharper decision-making.
- Ties marketing conversions directly to operational outcomes (occupancy, move-outs, reviews).
- Enables channel benchmarking through “delta” metrics and comparative KPIs.
- Combines quantitative ROI metrics with qualitative indicators like average rating.
Check out the case study in detail – Executive Marketing Dashboard – pdf
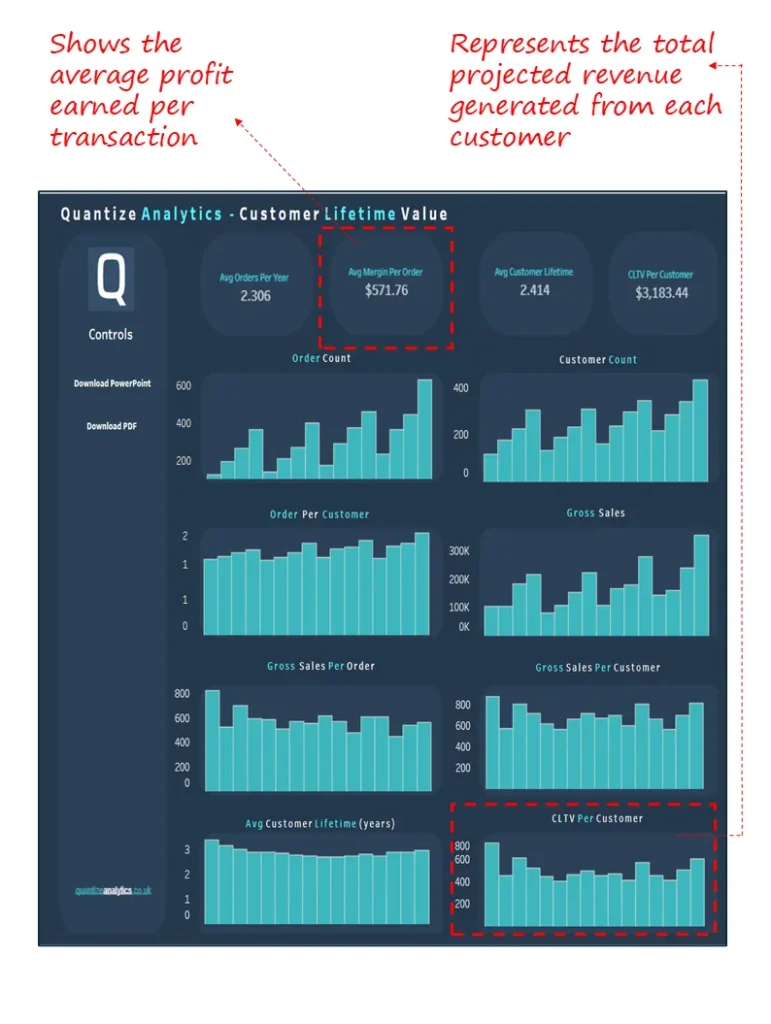
2. Customer Lifetime Value Dashboard
Industry Fit
E-commerce, subscription-based services, B2C SaaS, and retail chains with long-term customer engagement cycles.
Most Relevant For
Chief Marketing Officers, Heads of Customer Experience, and Retention Managers focused on strategic customer value and cohort profitability.
Objective
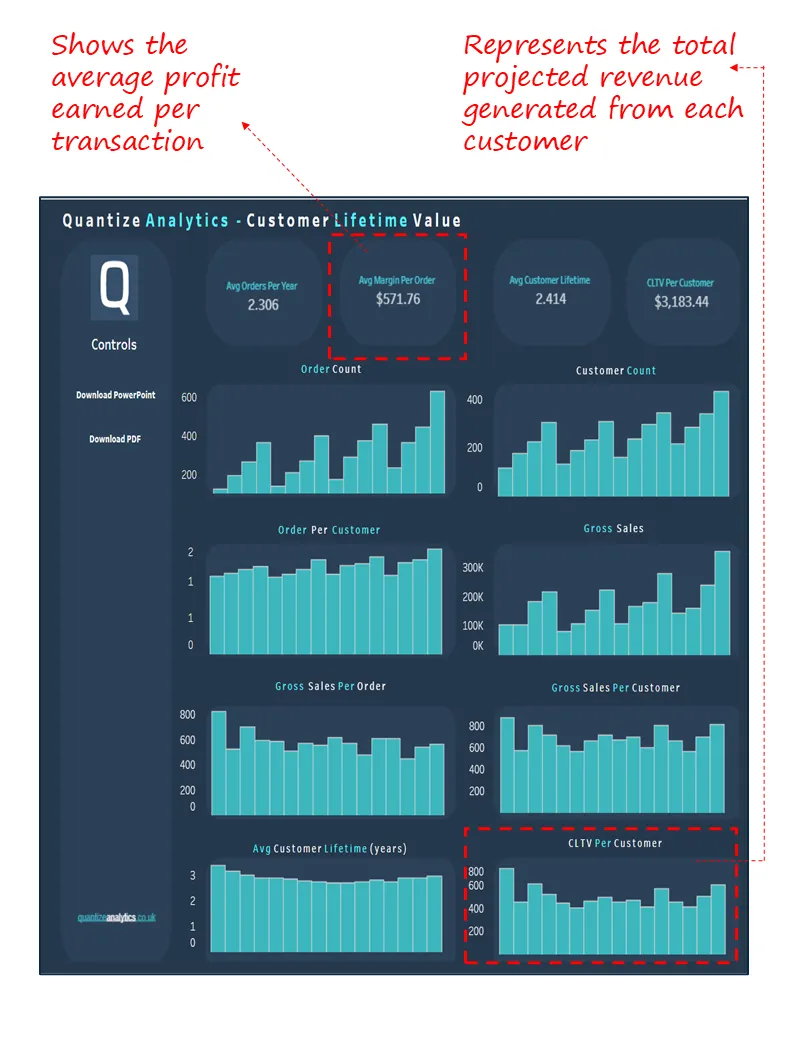
To calculate and deconstruct Customer Lifetime Value (CLTV) into its key components order behaviour, margin contribution, and customer lifespan to enable smarter acquisition, retention, and upselling strategies.
What’s Good About This Dashboard
- Provides a clear breakdown of CLTV drivers (orders, margin, lifetime) for targeted optimization.
- Enables cross-period comparison through uniform time-series visuals.
- Balances aggregate KPIs (like CLTV per customer) with behavioural depth (gross sales per order, customer count).
- Tracks CLTV shifts alongside core operational metrics, allowing for attribution of change.
3. Customer Acquisition Cost Analysis Dashboard
Industry Fit
Banking, fintech, and financial services with diverse product lines and multi-channel acquisition strategies.
Most Relevant For
CMOs, Heads of Growth, and Channel Marketing Managers aiming to benchmark and reduce acquisition costs across products, geographies, and segments.
Objective
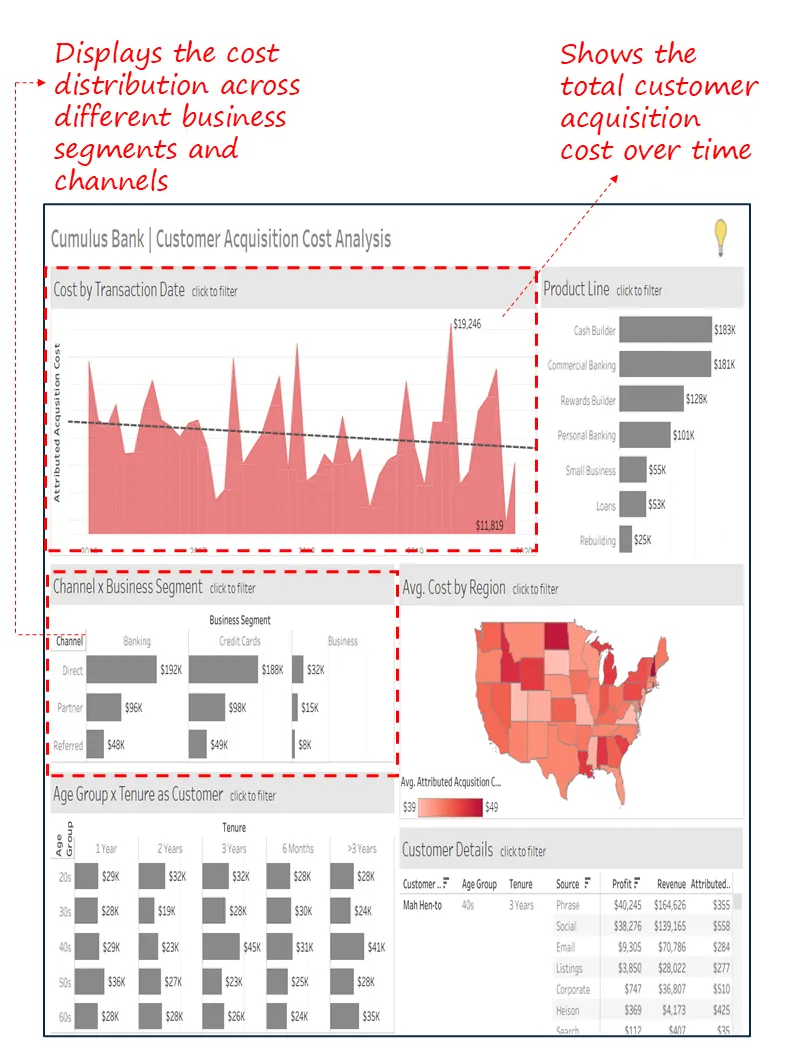
To analyze customer acquisition costs (CAC) by channel, region, product line, and demographic, and identify inefficiencies and high-cost patterns that erode marketing ROI.
What’s Good About This Dashboard
- Visualizes CAC trends over time, enabling detection of spikes and improving budget predictability.
- Breaks down CAC by product, channel, and business segment, supporting channel mix optimization.
- Offers geographic granularity for localized strategy development.
- Cross-filters demographics (age × tenure) with CAC, exposing expensive-to-convert cohorts.
4. Channel Attribution & ROAS Dashboard
Industry Fit
Retail, e-commerce, digital-first brands, and performance marketing teams managing multi-platform campaigns.
Most Relevant For
CMOs, Digital Performance Managers, and Growth Leaders focused on improving return on ad spend (ROAS) through better channel attribution.
Objective
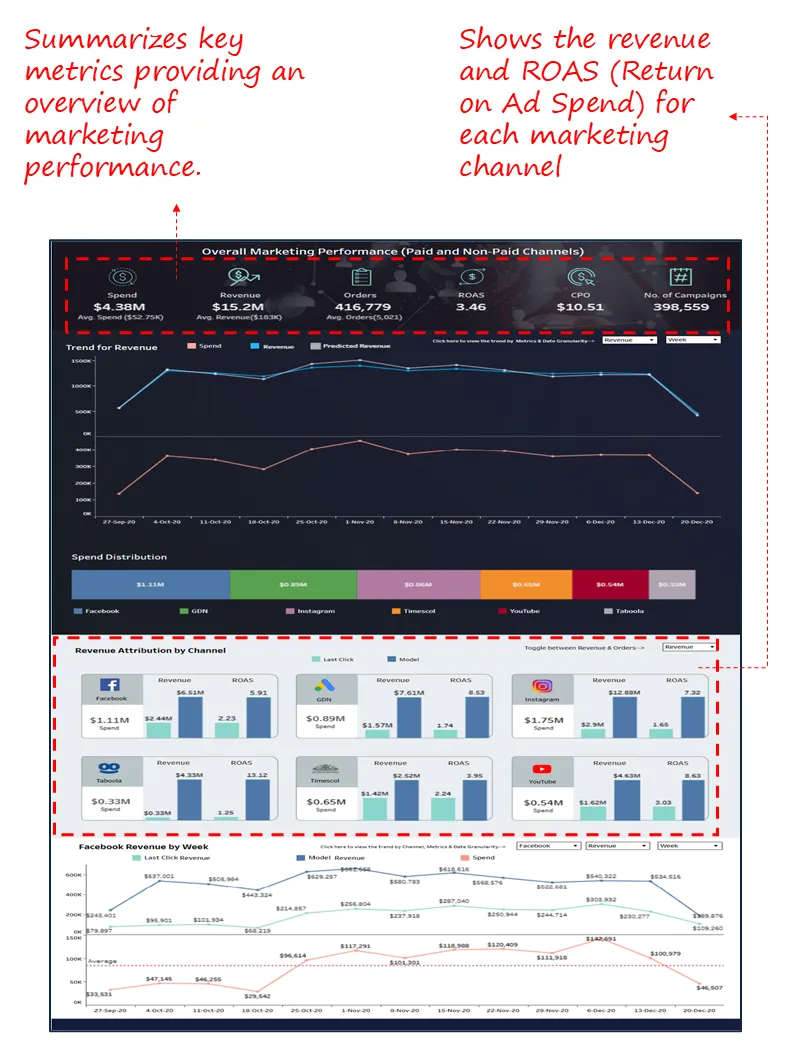
To compare performance across digital marketing channels using attribution models and isolate high-ROAS opportunities across platforms like Facebook, YouTube, GDN, and Taboola.
What’s Good About This Dashboard
- Juxtaposes last click vs. modelled attribution, helping avoid over-crediting or underestimating channel contribution.
- Highlights ROAS side-by-side with spend and revenue, enabling immediate profitability comparisons.
- Breaks down Facebook revenue by week, allowing time-series diagnostics of a high-spend platform.
- Visualizes spend distribution across channels clearly, useful for rebalancing underperforming investments.
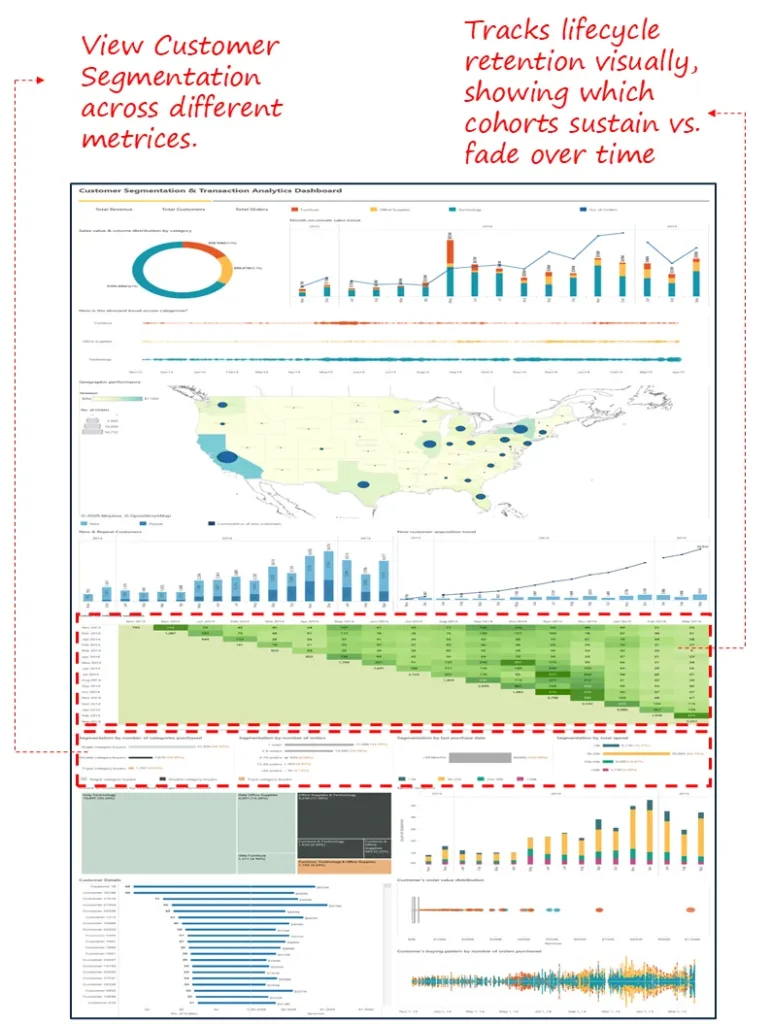
5. Customer Segmentation & Transaction Analytics Dashboard
Industry Fit
- Retail, e-commerce, direct-to-consumer brands, and subscription-driven platforms.
Most Relevant For
- Chief Marketing Officer (CMO), Head of Customer Analytics, VP of Growth, and Lifecycle Marketing Teams.
Objective
To analyze customer behaviour across value, recency, and purchase frequency dimensions. Helps identify key revenue segments, repeat purchase trends, and latent high-potential cohorts to inform targeting and retention strategies.
What’s Good About This Dashboard
- Multi-axis Segmentation: Profiles customers by spend, recency, product category preference, and number of purchases.
- Cohort-Level Retention Tracking: Clearly visualizes how long customer segments stay engaged post-acquisition.
- Geospatial Mapping: Links geographic regions to revenue and order volumes for localized campaign planning.
- Behaviour-Revenue Linkage: Connects transactional behaviour directly to revenue performance supports high-precision marketing decisions.
6. Spend Allocation & Channel Efficiency Dashboard
Industry Fit
- Digital-first businesses, retail, fintech, and B2B SaaS firms with high multi-channel marketing budgets.
Most Relevant For
- Chief Marketing Officer (CMO), Head of Digital Strategy, Performance Marketing Leads, and Media Buyers.
Objective
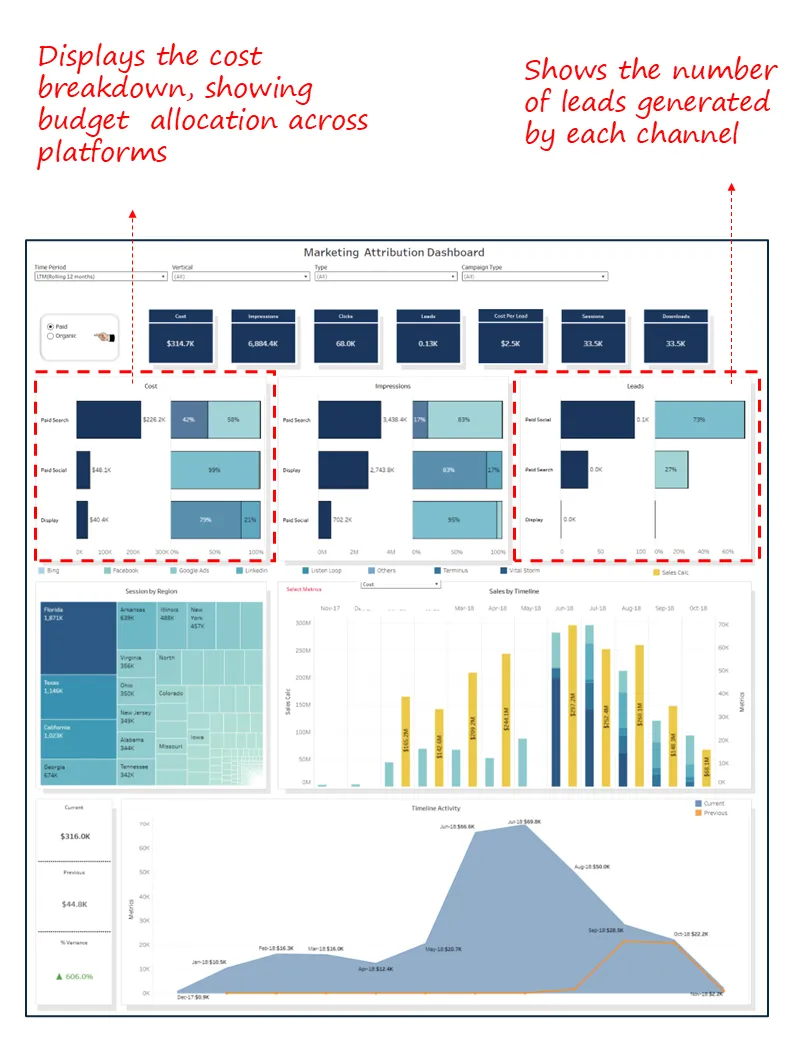
To assess how effectively marketing budget is allocated across channels by comparing spend to outcomes such as impressions, clicks, leads, and downloads. The dashboard enables course correction by spotlighting cost-per-lead outliers and underperforming sources.
What’s Good About This Dashboard
- Spend vs Outcome View: Connects media cost to high-level outcomes like impressions, sessions, leads, and downloads, ideal for budget vs ROI tracking.
- Granular Breakdown by Channel Type: Compares performance across Paid Search, Paid Social, and Display using stacked visuals and cost contribution bars.
- Geographical Segmentation: Regional performance tree map helps identify geographic ROI hotspots and budget sinks.
- Time-Series Trendlines: Visualizes campaign momentum and activity spikes over time, making it easier to identify effective timing and fatigue.

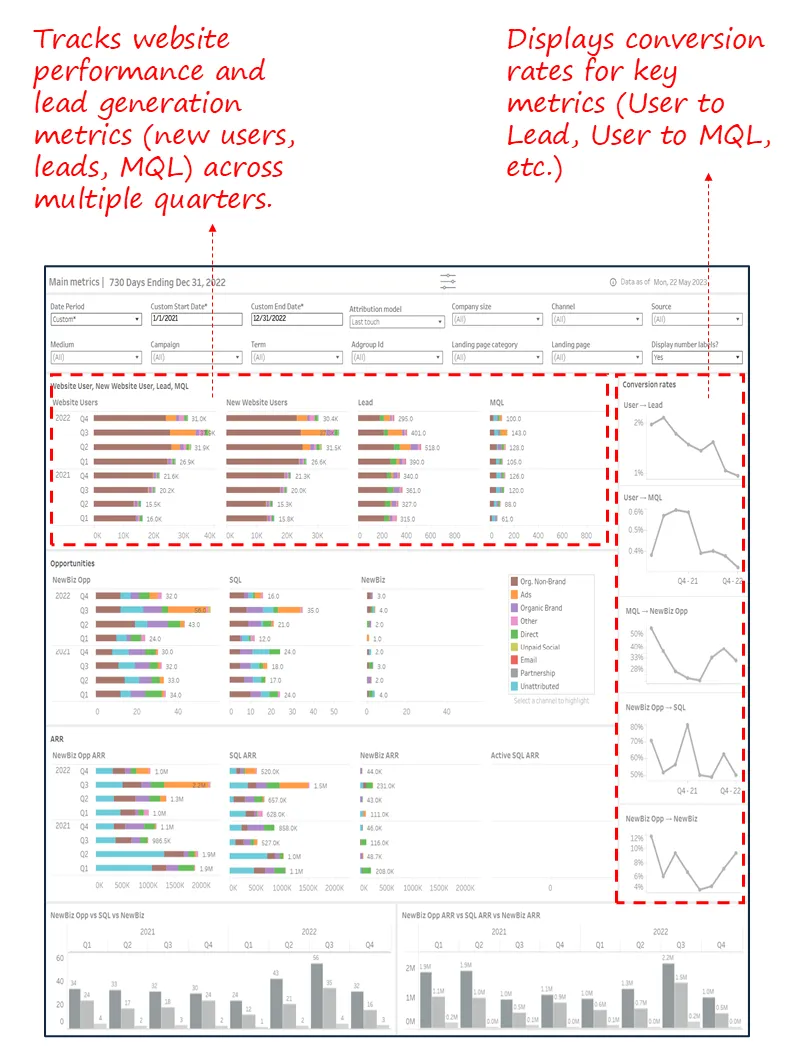
7. Funnel Performance Dashboard
Industry Fit
- B2B SaaS, enterprise sales-driven companies, and performance marketing teams managing multi-touch attribution and long sales cycles.
Most Relevant For
- Chief Revenue Officer (CRO), VP of Marketing, Demand Generation Leads, and Growth Marketing Analysts.
Objective
To monitor the entire marketing-to-sales funnel over a two-year window tracking volume, velocity, and conversion rates at each stage (from website visitors to qualified leads to closed deals). The dashboard isolates channel contributions to bottom-line metrics like Annual Recurring Revenue (ARR).
What’s Good About This Dashboard
- Full Funnel Visibility: Captures performance across eight distinct funnel stages-Website Users to SQL to ARR, providing holistic revenue attribution.
- Channel-Specific Segmentation: All metrics are color-coded by marketing source, enabling source-wise optimization without needing separate dashboards.
- Time Series & Trend Analytics: Visual conversion rates and ARR breakdowns across 8 quarters allow leaders to benchmark performance over time.
- Filter-Rich Interface: Allows slicing by attribution model, company size, medium, term, channel, or even landing page, a powerful decision-support tool.

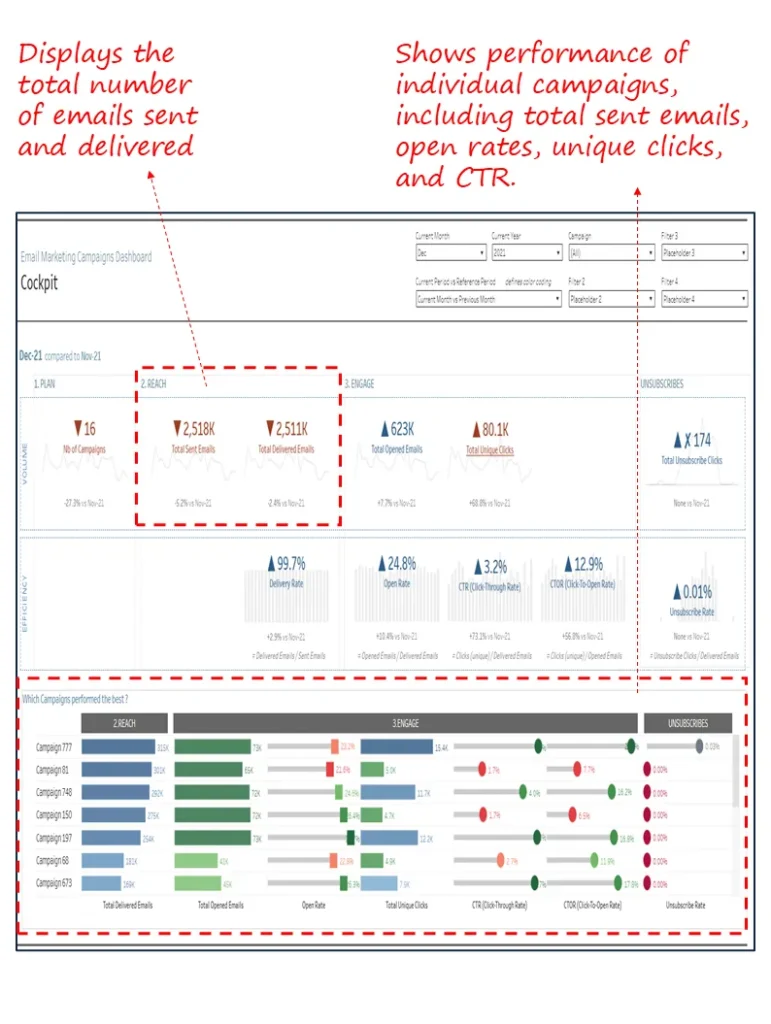
8. Email Marketing Campaigns Dashboard
Industry Fit
- Digital-native consumer brands, e-commerce companies, and B2C enterprises heavily reliant on email for lifecycle marketing, product promotions, or re-engagement campaigns.
Most Relevant For
- VP of Marketing, Campaign Managers, Email Marketing Specialists, and CRM Leads.
Objective
To provide month-on-month comparative performance of email campaigns from planning and delivery to user engagement and churn signals enabling tactical adjustments to boost effectiveness and reduce subscriber fatigue.
What’s Good About This Dashboard
- Covers Full Campaign Lifecycle: Spans key stages- Plan, Reach, Engage, and Unsubscribe, with KPIs for each, including opens, clicks, CTOR (Click-to-Open Rate), and unsubscribes.
- Campaign-Level Benchmarking: Performance of individual campaigns is ranked and visualized, highlighting what’s working.
- Variance Tracking vs Reference Period: Highlights changes from prior, ideal for gauging campaign optimizations.
- Early Detection of Fatigue or Risk: Unsubscribe trends and drop-offs in open rate are prominently flagged for quick mitigation.
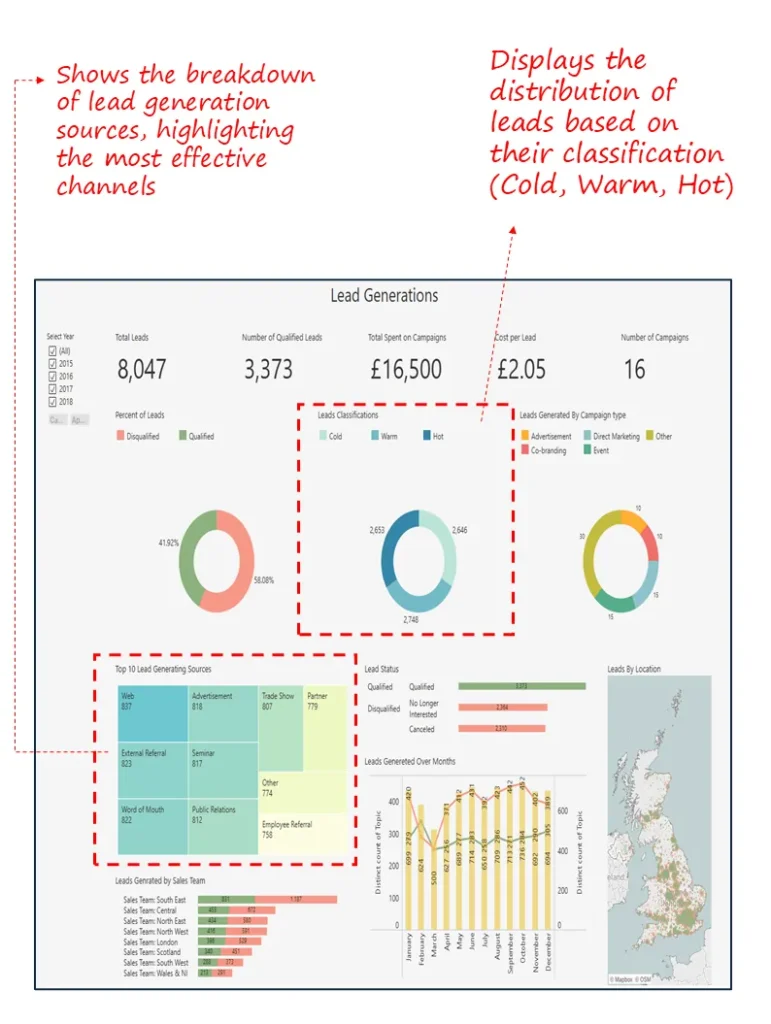
9. Lead Generation Dashboard
Industry Fit
B2B and B2C enterprises with active outbound, inbound, or event-driven sales pipelines ideal for services, SaaS, consulting, and multi-channel organizations.
Most Relevant For
Chief Marketing Officers, Heads of Growth, Sales Directors, and Demand Generation Managers focused on optimizing lead sourcing, quality, and cost effectiveness.
Objective
To provide a comprehensive, real-time overview of lead generation activities capturing volume, quality, sources, associated spend, and ultimate sales team performance.
What’s Good About This Dashboard
- Offers instant visibility into total and qualified leads, conversion rates, and cost per lead for executive decision-making.
- Highlights which channels, campaigns, and teams contribute most to pipeline growth, allowing for effective budget realignment.
- Segments lead by qualification status, classification, geography, and timeline enabling rapid identification of both strengths and bottlenecks.
- Visualizes spend versus results, lead trajectory over time, and regional coverage, driving more targeted and effective growth strategies.
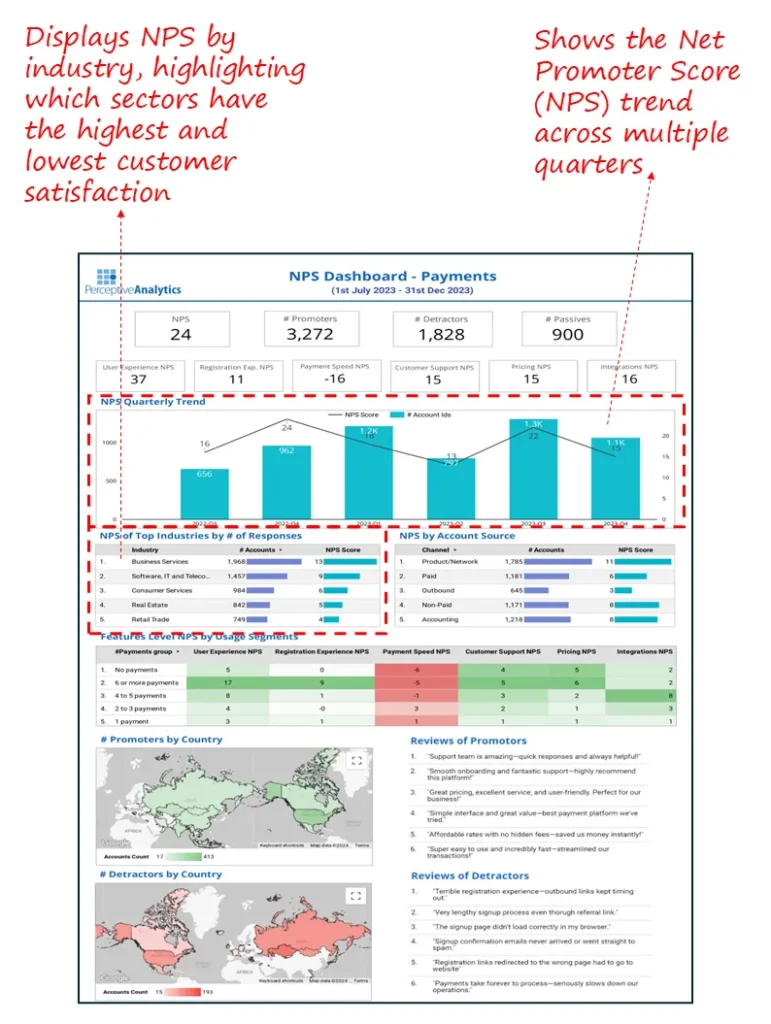
10. NPS Dashboard
Industry Fit
SaaS platforms, fintech providers, and digital B2B services that handle high-volume user onboarding, billing, or payment processing.
Most Relevant For
Chief Customer Officers, Heads of Customer Success, and Product Owners responsible for customer retention and experience improvement.
Objective
To measure customer satisfaction using Net Promoter Score (NPS) across product experiences and usage segments helping pinpoint feature-level friction and satisfaction drivers.
What’s Good About This Dashboard
- Breaks down NPS by feature group, exposing that Payment Speed is the weakest area (–16).
- Maps NPS by industry and acquisition source, revealing sectoral and channel-wise variances for targeted action.
- Customer verbatims are paired with NPS segments, adding qualitative insight to the numerical data.
- Highlights geographic distribution of promoters and detractors, useful for global CX alignment.
Check out the case study in detail – Net Promoter Score Analysis Dashboard – pdf
Closing Note
In today’s data-driven business landscape, marketing dashboards are essential tools that transform complex data into clear, actionable insights. For C-suite executives, these dashboards provide the strategic visibility needed to optimize marketing investments, drive sustainable growth, and align teams around measurable outcomes.
By carefully selecting and customizing dashboards that focus on key performance indicators, ranging from customer lifetime value and lead generation to channel attribution and campaign performance leaders can confidently steer marketing efforts with precision and agility. The dashboards outlined in this guide serve not only as measurement tools but as catalysts for smarter decision-making, ensuring that marketing remains a powerful engine of business success.
Marketing leaders frequently work with Tableau Consultants or hire Power BI consultants to unify campaign, lead, and revenue data, so dashboards reflect real-time marketing performance without manual reconciliation.
Embrace these dashboards as your strategic partners and empower your organization to move beyond vanity metrics toward true marketing effectiveness and impact.
Each month, we curate the latest updates, insights, and trends for senior leaders in data analytics and AI in our CXO Analytics Newsletter.
Our mission is “to enable businesses to unlock value in data.” For over 20 years, we’ve partnered with more than 100 clients—from Fortune 500 companies to mid-sized firms—to solve complex data analytics challenges. Our services include Advanced Analytics Consulting, Generative AI Consulting, and Business Intelligence (Tableau Consulting, Power BI Consulting and Looker Consultants) turning data into strategic insight. We would love to talk to you. Do reach out to us for a free consultation.