


How Mid-Size Insurance Companies Can Compete with Tier-1 Carriers Using Modern Data Platforms
The competitive gap between mid-market and Tier-1 P&C carriers is real — but it’s no longer insurmountable.For mid-market Property & Casualty carriers, 2026 is a strategic inflection point. The competitive landscape that once rewarded regional expertise and underwriter intuition is being rapidly redefined by data-driven decisioning and automation. Tier-1 carriers now leverage advanced analytics, machine learning, and real-time risk insights — delivering measurable performance gains that mid-market carriers risk being left out of entirely.
But here’s the insight that changes the equation: you don’t need Tier-1 budgets to build Tier-1 intelligence. As Perceptive Analytics outlines in this ebook, the real advantage lies not in out-spending the giants — but in out-maneuvering them with modern data platforms.
The Problem: Legacy Systems Are a Strategic Liability
The numbers are stark. As much as 74% of insurers still rely on legacy systems for core functions, and up to 70% of annual IT budgets go toward maintaining outdated technology rather than investing in innovation. Only 5–10% of carriers consistently extract competitive value from their existing data and technology investments.
The result is a compounding disadvantage. Legacy platforms lack real-time pricing and API integrations, force manual reconciliation across siloed systems, and impair automation in underwriting and claims workflows. Meanwhile, Tier-1 carriers and InsurTech challengers are moving fast with modular, cloud-native infrastructure — setting new benchmarks for speed, accuracy, and customer experience that mid-market carriers struggle to match.
At a combined ratio approaching 99% in 2026, there is virtually no room for operational drag. Every delayed decision, every manual process, every siloed data store represents margin walking out the door.
The Opportunity: Modern Data Platforms as the Great Equalizer
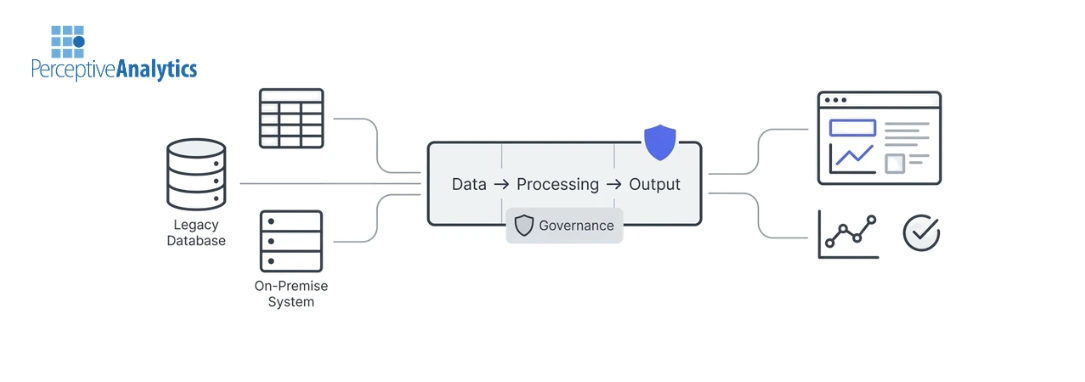
The good news is that the same forces widening the competitive gap — cloud computing, advanced analytics, external data availability, and automation — now make it realistic for mid-market carriers to close it. The key is adopting what Perceptive Analytics calls an overlay architecture: a modern, cloud-native data layer that sits alongside existing core systems rather than replacing them.
This coexistence strategy is the difference between a stalled multi-year transformation and sustained, measurable progress. Core systems continue to function as systems of record. The modern data platform — built on technology like Snowflake, Databricks, or Google BigQuery — becomes the system of intelligence. APIs and event-driven pipelines stream data into this platform, where it is standardized, governed, and enriched before being pushed back into underwriting, claims, and distribution workflows.
The business impact is well-documented. Cloud-native platforms reduce IT costs by 30–40%. Digitized underwriting can improve loss ratios by 3–5 percentage points and increase new business premiums by 10–15%. Application-to-quote times have been cut by 55%, and up to 70% of standard transactions can be processed with straight-through automation.
What the Architecture Actually Looks Like
A modern data platform for P&C insurance isn’t a single tool — it’s a structured stack of integrated capabilities. Data ingestion pulls from internal systems (policy admin, claims, billing) and external feeds (weather, geospatial, IoT, telematics). A unified lakehouse layer — the kind Perceptive Analytics’ Snowflake and data engineering consultants specialize in — consolidates storage for both analytics and machine learning without data duplication or latency.
From there, transformation pipelines convert raw data into business-ready formats. Governance layers automate data lineage, access controls, and compliance tracking — turning regulatory complexity from a brake into a built-in capability. And finally, BI tools like Power BI and Tableau, connected directly to the governed lakehouse, deliver dashboards and predictive insights to underwriters, claims teams, and executives — embedded in their workflows, not sitting in a separate reporting tool.
A real-world example from the ebook illustrates the scale of what’s possible: Carbon Underwriting built a cloud-native platform on Google BigQuery, consolidating thousands of inconsistent spreadsheets into a single governed data warehouse. Reporting time dropped from hours to minutes. Gross Written Premiums scaled from £15 million to over £300 million in five years — with a lean engineering team.
Where Mid-Market Carriers Can Actually Win
Modern data platforms don’t erase the advantages of scale — but they create specific arenas where mid-market carriers can compete and win. Using enriched geospatial and external risk data, they can build more granular, asset-level underwriting models than Tier-1 generalist portfolios allow. By embedding data-driven automation into agent workflows — instant data pre-fill, faster underwriting decisions, reduced rework — they can improve agent productivity and loyalty without competing on marketing spend.
Speed to market is another lever. With modular data services and analytics from Perceptive Analytics, carriers can launch new products, adjust pricing appetite, and respond to niche market opportunities in weeks — while Tier-1 competitors navigate internal governance committees. In an industry where one or two percentage points of combined ratio separate winners from losers, that agility is a genuine strategic advantage.
Making It Work: Execution Over Ambition
The ebook is candid: most transformation failures aren’t technology failures. They’re execution failures. Teams that try to solve everything at once — data lakes, governance, analytics, APIs, and front-end platforms simultaneously — exhaust budgets and deliver nothing visible.
The smarter approach, supported by Perceptive Analytics’ implementation and consulting services, is to start with three to five high-value use cases where data is reasonably clean and outcomes are measurable — automated claims triage, agent pre-fill workflows, predictive underwriting — prove value quickly, then scale. Pair that with cross-functional squads that span business and technology, transparent models that augment rather than override underwriter judgment, and continuous feedback loops that tie model performance to real business outcomes.
Mid-market carriers that build this discipline — clear ownership, limited scope, fast feedback — don’t just modernize. They build a compounding competitive advantage that grows with every iteration.
The Window Is Open, But Not for Long
The embedded insurance market is projected to reach $950 billion by 2030. Tier-1 carriers and InsurTech challengers are already positioning for that growth. Mid-market carriers that continue to defer modernization risk being progressively out-selected, out-priced, and out-distributed.
The investment required is far more accessible than most carriers assume. Targeted modernization initiatives — underwriting analytics, claims automation — can be delivered for $200,000–$500,000 annually over a 2–3 year horizon, often funded by reallocating existing maintenance spend. Enterprise-wide programs scale to $500,000–$1.5 million per year. And many carriers begin seeing measurable ROI within 6–12 months of launching their first use cases.
In an industry where data is the new underwriting edge, the carriers that operationalize intelligence fastest will define the next decade. The question isn’t whether to modernize — it’s whether to start now or let competitors set the pace.
Ready to Close the Gap?
Whether you need to unify fragmented data, build real-time analytics, or embed AI into your underwriting and claims workflows — Perceptive Analytics has the expertise to help mid-market carriers compete with confidence.
Talk with our consultants today. Book a session with our experts now.
Our Work
Industry
- Industry
Function
- Function
-
Increasing Conversions with Adwords Spend Optimizer
How To Optimize Adwords Budget in Real Time
Free Download
-
Markdown Optimization for Retailers
A Methodology to Track Performance and Maximize Value
Free Download
-
Optimizing Marketing Spend with Marketing Mix Modeling
Using Statistical Modeling and Empirical Methods
Free Download
-
Leveraging Web Analytics for Customer Acquisition
Leveraging Web Analytics for Customer Acquisition
Free Download
*Subscribe to be the first one to know our latest updates
Contact us

You have crafted a powerful analytical tool for us. Thank you.
Alan Benjamin
Principal, Benjamin Realty Advisors

I have been working with Chaitanya and Perceptive Analytics for about 20 months now. They did BI / reporting and excel tool development. Their work helped us in channeling our periodic reports to the senior and operational management. The team exceeded my expectations. Chaitanya would ask thought provoking questions that trigger a new line of thinking. They created good dashboards so our senior team can quickly interpret reports. We were able to make progress because the team knew finance and tools they created were easy to implement.
Samir Lavani
CFO at Pearl Hospitality

Chaitanya and the Perceptive Analytics team worked on multiple strategic projects that involved Tableau data visualizations. Perceptive's work (~ 1 year) led to successful launch of our portal - this was an important milestone for us. Visualizations created were insightful, easy to understand and visually attractive. The team often suggested ways to show data in more intuitive way so our audience can understand it. They also knew Tableau well that helped in customizing it for our purposes. The team worked hard to finish the project on time managing expectations. I look forward to working with Perceptive on other projects.
Haroon Yaqoob
Principal at Nomenclature Inc.
