Tableau Optimization Checklist and Guide
Tableau | January 19, 2026


How to use this checklist and guide?
This Tableau Checklist & Guide is designed to help you build efficient, high-performance dashboards while following best practices. It ensures that your dashboards are structured, optimized, and easy to use. It would also help you fine tune your dashboard for a better performance.
What’s in This Document?
This document consists of two main sections:
The Checklist
- A structured list of best practices for building Tableau dashboards.
- Covers key areas such as data source, visualizations, dashboard design and performance.
- Helps you stay on track and avoid common mistakes.
The Guide
- Detailed explanations for each checklist item.
- Provides insights into why each step matters and how to implement it effectively.
- Helps you troubleshoot potential issues and improve dashboard performance.
- Additionally, the outline on the left allows you to quickly navigate through different sections of the document.
How to Use This Document?
- Navigate Using the Outline
Use the document outline (on the left) to jump to different sections quickly.
- Follow the Checklist (Feature available in downloadable pdf)
Use the checklist as a step-by-step guide while building your dashboards.
Mark off items as you complete them to ensure best practices are followed.
- Refer to the Guide for More Details (Feature available in downloadable pdf)
If you need clarification on a checklist item, refer to the guide for a deeper explanation.
You can get to the guide for that particular item by clicking on the point and following the bookmark. This section provides additional context, best practices, and optimization tips.
- Make a Copy & Use It for Your Work (Feature available in downloadable pdf)
Duplicate this document and use it as a reference while working on your dashboards.
Ensuring each item is checked off will help improve performance, usability, and consistency.
Tableau Checklist
1. Data Model and Source Optimization
- Limit data size by applying data source filters
- Use Hyper Extracts
- Prefer native drivers over ODBC/JDBC for better query performance
- Avoid custom SQL unless necessary; optimize at the database level
- Utilize Tableau’s logical layer relationships instead of joins
2. Calculations and Aggregations
- Materialize String calculations
- Make groups with CASE statements
- Test the most frequent outcomes first in conditional statements
- Reduce complexity (Nested calculations and redundant logic)
- Reduce Granularity of LOD or Tableau Calculations
- Use IN instead of OR
- Use MIN or MAX instead of ATTR
- Minimize slow functions like COUNTD
- Materialize date conversions and calculations
Even basic statistical calculations can become expensive at scale. This walkthrough explains how correlation and other statistical measures are computed in Tableau and how to use them efficiently.
3. Filters and Parameters
- Minimize quick filters
- Avoid filters on high-cardinality fields
- Use context filters for high-cardinality filtering
- Replace unnecessary filters with parameters
- Use the apply button
- Set your Date filters to continuous
- Ranges are better than itemized filters
- Use Action filters to reduce query load across data sources
4. Worksheet and Visual Optimization
- Limit mark counts
- Visuals are better than texts
- Consider using text formatting instead of shapes
- Reduce image size
- Use transparent background PNGs instead of JPGs
- Avoid overuse of polygon marks
- Use the page shelf sparingly
5. Dashboard Design
- Use fixed-size dashboards
- Reduce the number of views per dashboard
- Drill into detail, rather than loading all data in one load
- Hide worksheets not in use, until needed.
- Clean-up containers.
- Break up complex dashboards
6. Performance Analysis
- Use Performance Recorder to identify slow queries, calculations, and visualizations.
- Optimize the slowest views(impact of filters, data source, and calculation efficiency)
- Warm up server cache by accessing dashboards after publishing.
7. General Tips
- Avoid overcomplicating dashboards with unnecessary features or excessive interactivity.
- Leverage Tableau Prep for data cleansing, reshaping, aggregations.
- Regularly clean up workbooks by removing unused fields, sheets, calculations.
In complex enterprise environments, Tableau performance issues often require deeper architectural fixes, which is where Tableau consulting experts can help streamline data models and calculations.
Talk with our Tableau Consultants today. Book a free 30-min session now
Tableau Guide
Understanding the performance of tableau dashboards:
Tableau Dashboards have 4 Core elements:
- Data
- Calculations
- Worksheets
- Dashboard Layout
When your end-user decides to load a dashboard:
Tableau writes queries processed by your data source. Tableau is, at its core, a visual query generator. Much of the work Tableau does is translating your designs into queries your underlying data source can understand. Those query results are then used by Tableau to perform additional calculations on the data (such as window calculations) as well as the internal calculations Tableau may need for your dashboard.
Your worksheets/visualizations are rendered based on the query results and calculations before being placed in their final layout. This process, when broken down, can be summarized into just four components that impact performance:
- Query Time
- Calculation Time
- Rendering Time
- Layout Computation
Some ground things which are true in all dashboards built in tableau:
- If data source is slow, then it will be slow.
- Fix: To use tableau extracts
- If it slow on Tableau desktop, then it will be slow in Tableau server.
- Newer versions are generally better
Data Model and Source Optimization
Tableau is, at its core, a visual query generator. It takes your designs and translates them into multiple queries to your data source. Well-designed data sources can give your production dashboard a fast foundation.
Tableau offloads as much of the calculation and aggregation work to the underlying data source as possible. This gives you a lot of flexibility in handling the processing through data source optimization and is another reason why Hyper Extracts are such an important part of your toolkit for performance.
Data sources in Tableau Tableau has an extensive ability to connect to data across many different platforms. For the purposes of talking about performance, we’re going to broadly group these connections to the following types:
- File-based data sources – such as Excel and CSV;
- Relational database data sources – such as Snowflake, Oracle, Teradata and SQL Server, as well as specialized analytic appliances such as HP Vertica, IBM Netezza, etc;
- OLAP data sources – such as Microsoft Analysis Services and Oracle Essbase;
- No SQL data sources – such as Hadoop;
- Cloud-based data sources – such as Salesforce, Google, etc.
For scenarios involving external market or financial data, connectors like FactSet require careful configuration to avoid performance bottlenecks. This example shows how to set up and optimize a Tableau Web Data Connector for reliable, scalable use.
For most connections, Tableau can either query the data live or create a Hyper Data Extract (a .hyper file). When querying live, that means that Tableau will generate queries to the underlying data source as you build visualizations and dashboards. Since data sources come in all shapes and sizes, slow and fast, the performance of your data source will have a huge impact on your dashboard. If your data source is slow, the Tableau Hyper Extract is your secret weapon for performance, the majority of environments would benefit from using extracts.
A Tableau Hyper Extract is:
- A persistent cache of data. It is written to disk and reproducible.
- A columnar data store – this is a format of storage that is particularly good for analytics
- Separate from your underlying data source. All Tableau queries will go to Hyper instead of live data connection. This has the added benefit of helping reduce resource contention in your underlying data source.
- Refreshable on a schedule. You can completely regenerate an extract or incrementally add rows of data to an existing extract via Tableau Server and Tableau Online, or do more complex updates via the Hyper API. Most production use cases require full extract refreshes for a number of reasons.
- In-memory and Architecture-aware – Hyper is an in-memory technology but is not constrained by physical RAM available, unlike many similar technologies.
- Portable – extracts are stored as files so can be copied to a local hard drive and used when the user is not connected to the corporate network. They can also be used to embed data into packaged workbooks that are distributed for use with Tableau Reader;
- Often much faster than the underlying live data connection.
If you are using a live connection in Tableau and you suspect your underlying data source could be causing performance problems, creating a Hyper Data Extract is often one of the easiest ways to improve performance. Beyond being a very capable analytic database, leveraging Hyper gives you additional ways to improve the speed of your data that you might not have access to with other systems either because of the nature of those data sources or because of the administrative rights needed. It’s also worth mentioning that Hyper is workbook-aware in certain circumstances. When it is embedded with a workbook, Hyper Extracts will automatically create summary tables and other artifacts to help speed up your dashboard. This is a level of customization that would be hard (if impossible) to achieve in other data sources.
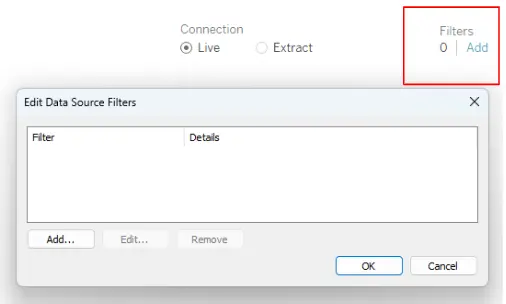
1. Limit data size by applying data source filters
Tableau performs better with smaller datasets. Applying data source filters ensures only relevant rows are loaded, reducing query size and memory use. For example, if your analysis focuses on the last two years of data, filter out older data in the source or during extract creation.
Aggregating data (e.g., monthly instead of hourly) reduces the number of rows, making queries faster and extracts smaller.
Go to the data source pane -> Click on Add under the Filters -> Add required filters and press OK
Many teams work with experienced Tableau consultants to standardize calculations and avoid performance pitfalls as dashboards scale.
Speak with our Tableau Consultants today. Book a free 30-min session now
2. Use Hyper Extracts
Tableau’s Hyper engine is optimized for query speed. By pre-aggregating data to visible dimensions, Tableau reduces processing overhead.
Hiding unused fields prevents unnecessary columns from being queried, reducing extract size and improving performance.
The “Compute Calculations Now” option materializes calculated fields into extracts, eliminating the need for Tableau to recompute these during runtime.
3. Prefer native drivers over ODBC/JDBC
Native drivers are faster and more stable for database queries. They leverage optimizations specific to the data source, reducing latency and improving query execution times.
4. Avoid custom SQL unless necessary
Custom SQL in Tableau prevents the use of its built-in query optimization features, often resulting in inefficient execution. Where possible, optimize queries directly in the database and use Tableau’s logical model for relationships and joins.
5. Utilize Tableau’s logical layer relationships instead of joins
Logical layer relationships allow Tableau to generate context-aware queries by preserving table granularity. This minimizes data duplication and enables query culling, which ensures Tableau fetches only the required data for the analysis.
Calculations and Aggregations
Calculations use various functions, formulas, and aggregations to transform data into analysis. Once you have built a calculated field, it is available to any workbook using the same data source. These calculated f ields can be used just like other measures and dimensions already in your data. The way you define and use these calculations affects both how Tableau queries the data source and the processing time in Tableau. Using best practices when assembling your calculations will help ensure you get the best performance possible.
Types of Calculations:
- Row-Level Calculations – Row-level calculations are calculations that happen within a row of data. These can include date functions, string functions, and mathematical operations to manipulate and combine the fields. You can add the results of a row-level calculation to the raw data without changing the results.
- Aggregate Calculations – Aggregate calculations use aggregate functions (like SUM, MAX, MIN, ATTR, etc) to combine multiple rows of data and create the result of the view. These calculations summarize a column of data to produce our visualization within a worksheet. This summary and the results of the aggregate calculations is determined by the level of detail of the worksheet, so the results can change from worksheet to worksheet.
- Table Calculations – Table Calculations work on the level of detail of your worksheet. In essence, they allow a second pass on your data after an aggregation. This enables you to perform calculations that couldn’t be done in a single aggregation such as the average of your aggregation results, running total, or % of total. The key here is that the calculation is working on the results of your view.
- Level of Detail (LOD) Calculations – LOD calculations give you more control over the level of granularity you want to do your calculation. They can be performed completely independently with the FIXED expression, at a more granular level with the INCLUDE expression. or a less granular level with the EXCLUDE.
- External Functions (External Services and Pass-through Functions) – these are calculations that leverage external systems (Einstein, R, Python, Matlab, etc) to enrich the data with results from models or specialized functions not available natively within Tableau.
1. Materialize String calculations
String-heavy calculations or complex row-level calculations in Tableau consume significant resources. Calculations that manipulate strings or search them, are still performance intensive. When you use string functions such as LEFT, RIGHT, MID, FIND, SPLIT, or any of the REGEX functions, it’s best to look at how these calculations can be added to your underlying data or materialized in your Extract
Precomputing these in the data source or materializing them during extract creation reduces the computational load during dashboard use.
2. Make groups with CASE statements:
The built-in grouping loads the entire domain of the dimension, whereas your calculated field only loads the named members of the domain. In our testing, grouping methods performed in the following order (from best to worst)
- CASE Statements
- Tableau Sets
- Native Group function
- If / Else If Statements
3. Test the most frequent outcomes first in conditional statements
When Tableau processes your conditional statements, it stops as soon as it finds a match. To get the best performance, putting the most likely outcomes at the top will mean the majority of cases in your data will stop sooner. Consider the following example.
This logic:
IF <unlikely_test>
THEN <unlikely_outcome>
ELSEIF <likely_test>
THEN <likely_outcome>
END
Will be slower to evaluate than this:
IF <likely_test>
THEN <likely_outcome>
ELSEIF <unlikely_test>
THEN <unlikely_outcome>
END
4. Reduce complexity
Nested calculations and redundant logic make dashboards sluggish. Consolidate calculations into reusable fields and simplify expressions. For instance, instead of writing the same calculated field multiple times in different views, create it once and reuse it.
5. Reduce Granularity of LOD or Tableau Calculations
In general, when you aggregate more it’ll be faster. The closer the calculation is to each individual row of data, the slower it will perform. For LODs, look at the number of unique dimensions members in the calculation and reduce if possible.
For Tableau Calculations, the more marks you have in the view the longer it will take to calculate. A lot of “Tableau tricks” online cleverly use LODs and Table Calculations in ways that work on smaller data sets, but can result in long loads on larger, production data sets.
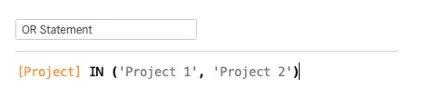
6. Use IN instead of OR
From a performance perspective, when a data source is passed a series of OR statements, it typically evaluates each condition individually before resulting the entire statement. This makes sense, given these logical comparisons often can have multiple types of comparisons within them
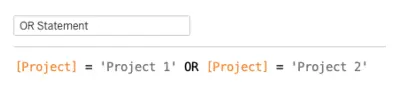
If we use IN instead, it can be assumed that we’re checking a single dimension against a list, which is a much simpler task from a performance perspective. This allows us to have very clean calculations as well as a performance.
7. Use MIN or MAX instead of ATTR
ATTR evaluates whether a field contains a single unique value, which requires Tableau to scan all records. Instead, use aggregations like MIN or MAX, which are computationally simpler and achieve the same outcome when uniqueness is guaranteed.
8. Minimize slow functions like COUNTD
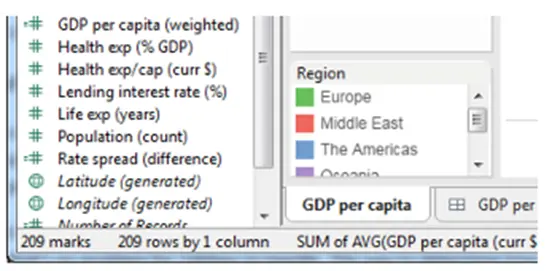
Functions like COUNTD() (distinct count) are expensive because Tableau needs to evaluate uniqueness across all rows. Precompute distinct counts at the source or use alternatives like SUM([Number of Records]) when feasible.
9. Materialize date conversions and calculations
Minimize the amount of date calculations and conversion you have to do in Tableau at run-time. If you do have to do them, leverage DATEPARSE and MAKEDATE before other methods
Filters and Parameters
Filers are a vital tool and can have a great impact on dashboard performance both good and bad. They can also be applied to multiple areas of tableau, including the data source, the worksheet and the dashboard.
Inefficient filter designs is often one of the most important causes of poor-performance dashboards.
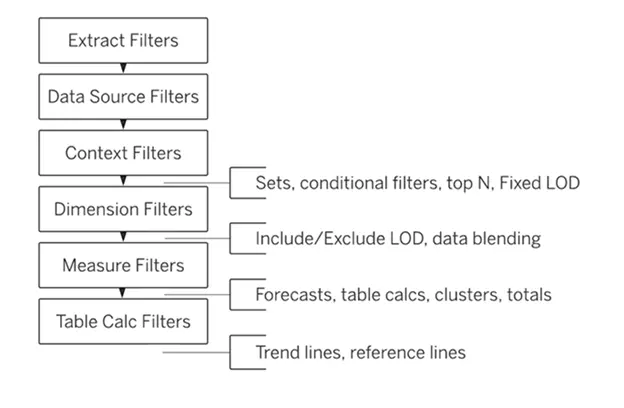
Understanding types of filters:
- Extract filters – applicable only when using Hyper data extracts and are applied on extract creation or refresh.
- Data source filters – are the highest level of filter available on live connections. Data source filters apply to the entire data source for all worksheets and views. This is where user security and similar filters should be applied.
- Context filters – Standard filters run without considering the context of your other filters. Setting a context filter allows you to apply that filter before your other filters are applied. For example, if you want the top 10 products for a selected region, you would apply the region as a context filter. Otherwise, Tableau will give you the top 10 products globally no matter what other normal filters are applied.
- Dimension / Set filters – a standard filter using a dimension or set from your data.
- Measure filters – a standard filter using a measure from your data.
- Table calculation filters – a standard filter using a table or window calc in your visualizations
1. Minimize quick filters
Quick filters (especially on large datasets) trigger additional queries for each filter, slowing down dashboards. Limiting the number of filters per dashboard minimizes this overhead.
2. Avoid filters on high-cardinality fields
Filtering fields with many unique values (e.g., customer IDs, timestamps) generates heavy queries. Instead, use aggregated fields (e.g., regions instead of individual stores) to reduce processing demands.
3. Use context filters for high-cardinality filtering
Context filters create a temporary data subset that subsequent filters can use. For example, applying a region context filter first allows city filters to operate on a smaller dataset, speeding up queries.
4. Replace unnecessary filters with parameters
Filters trigger queries, while parameters do not. Use parameters to drive calculations or select views where interactivity is needed without additional processing.
5. Use the apply button
By default, Tableau applies filters dynamically as users make selections, leading to multiple queries being run in real time. The “Apply Button” forces Tableau to wait until the user finalizes their selection before executing the query.
6. Set your Date filters to continuous
Continuous date filters (relative and range-of-date filters) can take advantage of the indexing properties in your database and are faster than discrete date filters.
7. Ranges are better than itemized filters
Itemized filters (e.g., filtering by selecting multiple individual values) force Tableau to check each selected value separately, leading to performance issues.
A range filter (e.g., selecting “Sales between $10,000 and $50,000”) allows Tableau to use indexing and query optimizations.
8. Use Action filters to reduce query load across data sources
Action filters apply selections based on user interactions with the dashboard (e.g., clicking a bar in a chart filters another worksheet). They are more efficient than traditional filters because they only trigger when users interact, reducing the number of automatic queries.
Worksheet and Visual Optimization
1. Limit mark counts
A mark is any point, plot, or symbol on your visualizations. They can be the bars in your bar graph or the points in your trendline. In large text tables each text element is considered a mark. You can see the number of marks that Tableau is rendering by looking at the bottom-left corner of Tableau Desktop. The more marks the more work Tableau is performing rendering your visualization.
Dashboards with millions of marks (data points) cause rendering delays. Aggregating data or using density marks (for maps or scatterplots) reduces the rendering load without losing insight.
2. Visuals are better than texts
Tableau has been optimized to do visualizations. Yet, it is not uncommon to see dashboards that are just a table of raw data with a long list of filters on the side. These views struggle with performance as it loads lots of unseen data (only available after scrolling) and includes more details than your users probably need. In many cases these exist to allow users to extract data to another tool like Excel for further analysis.
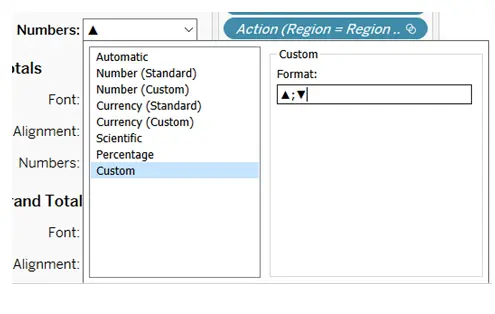
3. Consider using text formatting instead of shapes
Sometimes you need to convert a numeric value to a KPI indicator of some sort, such as ▲(up) or ▼(down). A neat trick is to use Tableau built in custom formatting to display these marks and you get a performance boost by skipping another calculated field and assigning it a shape.
4. Reduce image size
Visuals, such as custom shapes, can help the readability of your visualizations, as well as giving it visual flair. Like any type of mark, using lots of images can mean more work for Tableau. For images, however, there’s an added issue of the file size. Since you’re providing the file to Tableau, it’s possible for these files to be larger than they need to be. The best thing to do is to keep images below 50kb when possible with a 32×32 pixel count. Keeping file sizes down will also help in other ways, such as publishing and export. If you commonly export Tableau reports to another medium, such as PDF, these custom shapes and images can substantially increase the size of your document.
5. Use transparent background PNGs instead of JPGs
Another way to ensure smaller file sizes for your custom shapes and images is simply to use PNGs. PNGs support transparent backgrounds, which means less to store. It also can make the images more useful since they will work on multiple background colors without introducing a box around your shape.
6. Avoid overuse of polygon marks
Polygon marks are powerful in that they let you define custom shapes and paths in Tableau, really opening up the potential visualizations you can create. However, any visualization that uses polygon marks will for Tableau Server or Tableau Online to use server-side rendering, which can impact the end-user experience. More on client-side vs. server-side rendering in the server section.
7. Use the page shelf sparingly
Some dashboard authors believe the page shelf has the same performance as the filter shelf due to their similar appearance. However, when you use pages, Tableau will query for all the pages at once. The page shelf does not reduce the data. Stop and ask: would the view perform well if I added the dimension value on the page shelf to the display.
Dashboard Design
Dashboards are where it all comes together. If you’ve followed best practices with your data, calculations, and worksheet design, you’ll be in a strong position to create well performing dashboards. In a Tableau dashboard, we’re typically bringing multiple visualizations together and tying them together through actions, filters, buttons, and other elements to create the final product our end-users experience. The primary way we control performance on the dashboard level is by limiting the number of elements (worksheets, filters, containers, images, etc).
Dashboards perform best when they are designed for a clear purpose, with focused content. Keeping the number of visualizations and filters to the essential is the number one control you have over your dashboard’s performance. Remember that everything we’ve discussed is also still at play. The number of marks being rendered matters to the individual visualizations, but the number of marks across all your visualizations on a dashboard matters even more.
A visualization may perform fast on its own but combined with many others can result in a slower dashboard. If you have a complicated chart with many marks, it may be best to keep that the primary focus of a dashboard.
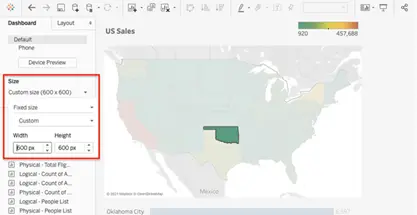
1. Use fixed-size dashboards
When you design your dashboard, you can choose from a few different options, including setting fixed dimensions or letting one (or both) dimensions fit the end-user’s screen. When you choose fixed dimensions, Tableau is able to better cache the results since it is a predictable size.
2. Reduce the number of views per dashboard
Every visualization you add to your dashboard increases the number of queries to execute and marks to render. It can be tempting to create a single dashboard with all your visualizations but breaking them up across multiple dashboards will result in better performance. If you have more than 5 visualizations on your dashboard, begin to consider how to break apart your analysis.
3. Drill into detail, rather than loading all data in one load:
Sometimes you need to give your users a lot of details or even the raw data. In use cases like this, it’s best to think about how you can keep all the details from being pulled on initial load. Many dashboards suffer from long load times because of the amount of data that needs to be loaded by these granular views, but never end up being used by the end-user. Consider using actions, global filters, or putting these detailed views in their own purpose built dashboard.
4. Hide worksheets not in use, until needed.
When you float a container in Tableau, you have the additional capability to add a show/hide button. Tableau utilizes “lazy loading” which means that whatever is in the container when hidden will not be rendered. This gives you additional ways to provide drill-downs, alternative chart views, or other creative uses that won’t impact the render time.
5. Clean-up containers.
Containers in Tableau help us align and group content in our dashboard. Often during the process of design and iteration, numerous nested containers end up in our dashboard. Cleaning up the design will uncomplicate the rendering and calculation that Tableau has to do when loading your dashboard.
6. Break up complex dashboards
Splitting large dashboards into multiple smaller ones prevents overloading Tableau’s rendering and query execution capabilities. For example, have separate dashboards for KPIs and detailed analysis.
Performance Analysis
1. Use Performance Recorder
Tableau’s Performance Recorder provides detailed insights into slow queries, rendering delays, and calculation inefficiencies. Use it to identify and resolve bottlenecks in your workbook.
2. Optimize the slowest views
Focus optimization efforts on the views identified as slowest by the Performance Recorder. Common issues include heavy filters, excessive marks, and complex calculations.
3. Warm up server cache
Preloading dashboards after publishing populates Tableau Server’s cache. This ensures faster load times for users accessing the dashboard subsequently.
General Tips
1. Focus on simplicity
Overcomplicated dashboards with excessive interactivity confuse users and slow down performance. Design dashboards with a clear purpose, emphasizing key insights over detailed data dumps.
2. Leverage Tableau Prep
Tableau Prep allows data transformations, cleaning, and aggregations to be handled outside Tableau, reducing runtime transformations and improving dashboard performance.
3. Regularly clean up workbooks
Remove unused fields, calculations, and worksheets. This reduces workbook size and ensures cleaner, faster queries.