Payment Platforms: Driving Growth with Data-Driven Strategy
Analytics | March 12, 2026


Introduction
Payment platforms are the Fintech infrastructure which facilitates the execution of electronic transactions between buyers, sellers, banks, and network operators . Payment platforms process tremendous volumes of transactions, with the payment volume processed through credit/debit cards in the U.S. growing from $3.7 trillion in 2018 to $5.6 trillion in 2023 . This growth, which forms part of the $10 trillion+ payment market in the U.S., has been driven by the increased use of digital commerce among consumers.
At Perceptive Analytics, we have been observing the evolution of the payment ecosystem over the years. Digital payments are no longer just an amenity, and the payment ecosystem has become the lifeblood of the global economy, driven by innovations in Embedded Finance, Instant Payments, and integrated platforms. For payment platforms, which are facing increased pressure on their already thin margins and changing consumer demands, the need to build data-driven strategies has become the key to success. This is where the need for data analytics and intelligent dashboards becomes critical.
In this article, we explore the key success factors for payment platforms and the data dashboards that are critical for strategic decision-making. Our objective is to help fintech executives monitor, optimize, and scale their platforms by focusing on the metrics that matter most.
To design effective executive dashboards, it is first important to understand the core performance drivers of payment platforms. These drivers determine where revenue comes from, how customer adoption grows, and how operational reliability impacts transaction success.
Talk with our experts today- Book a free 30-min consultation session
Key Performance Drivers
Payment platforms are the backbone of e-commerce, storefronts, and mobile wallets. They generate revenues by charging transaction fees on each transaction processed. Payment platforms in the competitive U.S. market differentiate themselves on the basis of transaction velocity, integration ease, payment acceptance, and high uptime and security.
Payment platforms can enhance their performance with effective management of revenues and costs. The key factors are:
1) Transaction volume & Take rate
Why it Matters:
For every payment platform, the revenue model is determined by the simple equation: Transaction Volume * Take Rate. Increasing either variable will increase revenue. Increasing Transaction Volume involves increasing the number of merchants and increasing the volume of transactions for each merchant. Increasing Take Rate involves increasing the percentage at which revenue is generated for each transaction. Increasing Take Rate by even small amounts can greatly increase revenue. For example, increasing Take Rate by 0.05 percentage points on $10 billion in transactions will increase revenue by $5 million.
With price pressure all around, precision is required in fine-tuning this lever. The most successful payment platforms combine competitive pricing with monetization of premium services offered.
How it Drives Performance
- Volume drives scale. Sign more merchants, increase average transaction size, and add new regions or payment types (like BNPL and FedNow) to boost volume results in more revenue.
- Take rate drives margin. Differentiated services like fraud protection, instant settlement, and FX handling can help boost fees.
Strategy for this driver:
1. Segmenting merchants for smart pricing: Segment merchants for smart pricing and offer different take rates for merchants of different sizes and industries. Merchants like SMBs may be comfortable with flat fees, but enterprises may demand more bundled pricing with service level agreements.
2. Expanding payment method coverage: Expand to include high growth potential and high-fee payment methods like wallets, instant payment solutions like FedNow, local payment methods like UPI in India, as well as new assets like stablecoins.
3. Implementation of tiered and value-based pricing: Introduce flexible tiering and offer discounts for higher volume merchants to boost overall transaction volume. Implement premium pricing for services like same-day settlement as well as fraud analytics to increase margins.
4. Benchmark and monitor take rate: Benchmark take rate by geography, channel, as well as tier. Use it to identify pricing gaps as well as underperformance.
2. Customer Acquisition & Retention
Why it Matters:
Many merchants sign up but never complete their first transaction, making activation (first successful payment) the most critical early lifecycle milestone.In payments, acquisition drives scale, but retention sustains profitability. Every new active merchant adds recurring transaction volume—but without retention, that growth leaks value. So, Perceptive also recommends adding another step, which is the second transaction (2nd activation/Retention) in the lifecycle, which signifies better customer lock-in and retention
With rising CAC and commoditized features, merchants switch easily. Retaining them requires more than just a functional product. It demands seamless onboarding, ongoing value, and proactive support. In payments, retention is strongly influenced by integration depth and operational dependence. Once a platform becomes embedded into checkout flows, accounting systems, and payout operations, switching costs rise significantly.
How It Drives Performance
- Activated merchants generate recurring revenue, activation is where marketing turns into monetization.
- A strong LTV/CAC ratio allows the company to scale profitably because merchants acquired over the long term pay for acquisition costs and contribute to gross margin
- Retention reduces revenue erosion. Churn not only cuts volume, it destroys prior investment.
- High retention boosts Net Revenue Retention (NRR) which is a core platform health metric.
Platforms with strong retention often see 2–3x higher LTV and smoother growth curves with lower sales overhead.
Strategy to leverage this driver:
- Optimize Onboarding & Time to First Transaction (TFT): Make the onboarding process as smooth as possible. This could be achieved through progressive KYC, plug-and-play APIs, and guided onboarding. Reduce friction through automated KYB/KYC, document scanning, and pre-filling of details for merchants. Provide SDKs and ready-to-use components and sandboxes to speed up the onboarding process. Integrate Plaid and similar tools to ease the KYC process.
- Predict and Act on Churn Risk: Identify churn risk based on behavioral data. Identify merchants that show low transaction volume, increasing payment failures, settlement issues, and increasing chargebacks. Automatically engage merchants who show churn risk.
- Deepen Engagement with Add-On Services: Introduce additional services that could be of use to merchants. Services could be in the realm of subscription billing, fraud protection, payouts, cross-border payments, financing, and data/analytics. Merchants who use two or more of these services tend to churn less and have higher lifetime value.
- Reward Loyalty: Introduce volume-based pricing tiers, priority support, or faster settlement for high-value merchants.
3. Payment Success & Fraud Rates
Why It Matters
Every declined transaction is a lost opportunity. For high-volume businesses, a decrease in authorization rates as low as 1% can mean millions in lost revenue. And fraud is not just costly; it also erodes trust, increases chargebacks, and can trigger costly reserve requirements and unwanted government inquiries. These two measures are the foundation of system reliability.
Payment success rate typically refers to authorization rate—the percentage of payment attempts approved by issuing banks.The goal is to maximize legitimate approvals while keeping fraud and chargeback losses within acceptable thresholds.
How It Drives Performance
- Improved success rates increase transaction completion, directly lifting volume and revenue.
- Less fraud means less loss from chargebacks, reserves, and fines from acquirers
- Better reliability boosts NPS, reduces merchant churn, and supports expansion into high-risk segments.
A 3–5% improvement in success rate can often generate more revenue than adding new merchants.
Strategy to Leverage This Driver
- Monitor Success Rates by Channel and Partner: Track approval rates by issuer, acquiring partner, card network, payment method, geography, and device channel.
- Invest in Fraud Intelligence & ML Risk Scoring: Leverage a risk scoring system that uses a range of data points such as behavioral data, device and IP data, and transaction history to evaluate the risk of a particular transaction in real-time.
- Optimize Risk Rules to Reduce False Declines: False declines (legitimate transactions rejected as fraud) are a significant hidden revenue risk. A balance must be struck by continually optimizing risk rules through feedback loops from approve/reject decisions and chargeback rates.
- Implement Proactive Fraud Controls & Alerts: Apply dynamic authentication methods such as 3D Secure or multi-factor verification only when risk scores exceed thresholds, minimizing friction for low-risk transactions.
- Implement Intelligent Payment Routing: Route transactions dynamically to acquiring partners with higher approval rates for specific issuers, geographies, or card types.
4. Product/Service Mix
Why It Matters
At the heart of transaction processing, margins are often low and heavily pressured by interchange and network costs. Hence, payment systems need to deliver value-added services so that they can be profitable in the long term. Today, payment systems are no longer just payment processors; they have become full-service financial and operational systems for merchants.
Merchants do not only look for payment processing but for various services such as invoicing, subscription services, point of sale services, reconciliation services, and lending services, among others. By venturing into such services, not only is the revenue per user enhanced but it is also crucial in boosting merchant retention through stickiness.
How It Drives Performance
- Merchants using multiple services often process higher payment volumes because the platform becomes embedded across billing, checkout, and financial operation
- With every additional product, ARPU goes up, thereby providing better monetization without impacting acquisition costs.
- The operational efficiency provides better data benefits, facilitating personalization and upsell opportunities.
- Value-added services improve margin profiles, providing stronger business economics compared to transactional revenue.
A well-executed product mix transforms platforms from a utility to a strategic partner.
Strategy to Leverage This Driver
- Use Data to Personalize Product Recommendations: Use transaction patterns and merchant behavior to recommend relevant services at the right lifecycle stage.
- Target High-Value Segments for Cross-Sell: Trigger cross-sell opportunities based on merchant milestones such as volume growth, international expansion, or recurring billing adoption.
- Design Vertical-Specific Modules: Create modules that cater to specific industries like healthcare, logistics, and education. A domain-specific set of tools will increase adoption and perceived platform value.
- Focus on Integration Simplicity and UX: Make it simple and easy to integrate using APIs and templates. A great developer experience will significantly encourage the use of more services.
- Bundle High-Margin Add-Ons: Package sets of services like fraud protection, reporting tools, and instant payouts into tiered plans to drive adoption and increase the total platform value.
5. Cost of Service & Operational Efficiency
Why It Matters
The payment processing industry is a high volume, low margin industry. Interchange and network costs tend to be the largest component of the company’s cost of goods sold in the credit card processing industry, often representing the majority of costs related to transactions.
We need to optimize costs wherever we can. Every basis point saved in cost per transaction can significantly expand contribution margin. The goal is to deliver at scale without degrading service quality or reliability.
How It Drives Performance
- Interchange and network fees make up 50–70% of COGS in most processing businesses. Since interchange and network fees represent the largest share of processing costs, optimizing the remaining controllable costs, such as processor markups, infrastructure, and operations directly increases margins.
- As the number of transactions increases, the fixed costs of the infrastructure and operations are distributed over a larger base. The automated infrastructure helps lower unit costs and speed up processing. It provides elastic growth.
Strategy to Leverage This Driver
- Optimize routing and cost efficiency: Route transactions through acquiring partners or networks that provide a balance between high approval rates and low processing costs.
- Negotiate Processor Fees: Interchange fees charged by card networks like Visa or Mastercard are non-negotiable; however, markup charged by processors is negotiable for businesses that process a large volume of transactions. Regularly check payment statements and use interchange-plus pricing models to ensure cost transparency by eliminating potential markup within blended pricing models.
- Automate Key Operational Workflows: Automate merchant onboarding verifications, settlement reconciliations, chargebacks, and customer support ticket prioritization.
- Move to Cloud-Native, Scalable Infrastructure: Cloud infrastructure allows a platform to increase capacity during periods of heightened transaction volume without requiring costly idle resources during normal periods.
- Track Unit Economics by Customer Segment: Monitor unit economics at a transactional level by payment methods, merchants, or geographies to identify low-margin or loss-making segments.
6. Regulatory Alignment & Ecosystem Partnerships
Why It Matters
Payment platforms are under constant regulatory watch. Changes in data privacy, KYC/AML, tax, and consumer protection regulations can affect operations or erode trust if not carefully anticipated and managed.
However, payment platforms are not isolated systems. Ecosystems of alignment, including banks, payment schemes, IDV services, and local settlement systems, are critical to product innovation, market expansion, and speed to market.
In summary, regulatory alignment is about ensuring business continuity, while ecosystem alignment is about expanding business possibilities.
For example, market entry into new, unfamiliar markets often depends upon obtaining regulatory licenses, sponsorships from banks, and access to local payment schemes
How It Drives Performance
- Proactive compliance can help a company gain trust from both merchants and regulators, thereby reducing legal risk and making the merchant onboarding process easier.
- Value-added compliance tools, like tax reporting and audit trails, can drive merchant retention and NPS.
- Robust ecosystem partners can speed up a company’s product development by providing platforms with the opportunity to plug in specialized capabilities rather than having to build them from scratch, for instance, through RTP/FedNow for faster settlement and identity APIs for easier merchant onboarding.
Well-aligned platforms scale faster, operate more smoothly, and win in trust-sensitive verticals.
Strategy to Leverage This Driver
- Map and Monitor Partner Coverage by Geography: Track acquiring banks, payment schemes, settlement networks, fraud vendors, and compliance partners by geography. Focus on partnerships that enable high-growth opportunities or underserved use cases.
- Build or Buy Key Ecosystem Capabilities: Partner with specialized providers in areas like identity verification, sanctions checks, and payouts. If a particular capability is mission-critical, build it in-house or acquire a strategic partner.
- Track Regulatory Trends and Act Early: Own the process of tracking regulatory trends in areas such as AML/KYC checks, CFPB (Consumer Financial Protection Bureau in the US) regulations in the United States, consumer protection regulations, and open banking models. Early compliance helps avoid disruption and cements the platform as a trusted ecosystem.
- Develop Ecosystem Uptime and SLA Dashboards: Track the uptime of various ecosystem partners. Partner reliability is a direct measure of the success of transactions with merchants.
Learn more: Top Executive Dashboards
Executive Dashboards for Payments Platforms
In today’s dynamic payments environment, data-driven decision making is no longer a ‘nice-to-have’ but a ‘must-have.’ At Perceptive Analytics, we believe that effective data visualizations, or data dashboards, are not only reporting tools, but can also be powerful tools that bring teams together, identify areas of friction, and enable executives to take actions that move the business forward. For every aspect of payments business that we have helped clients improve, from driving transaction volume growth to overcoming regulatory hurdles, there exist data dashboard frameworks that can not only track, diagnose, and improve these areas but also take them to the next level.
The data dashboards described below are designed to provide insights that can illuminate, enable, and support payments businesses in scaling with control and clarity. For each section of these data dashboards, we have included information on purpose, decision-making, metrics and visualizations, frequency, audience, and benefits.
Dashboard Name | Purpose | Metrics / Decision Flow | Benefits |
|---|---|---|---|
Revenue & Transaction Performance | Tracks transaction volume, revenue growth, and take rate by merchant segment and payment type. Helps identify under-monetized segments and pricing optimization opportunities. | Metrics: GMV / Total Payment Volume, Take Rate %, Fee Revenue, Avg Order Value, Transactions Count, Revenue by Merchant Tier. Visuals: Monthly trend lines, merchant segmentation treemaps, revenue waterfall. Filters: Region, Merchant Tier, Payment Method, Industry. Cadence: Weekly (Ops), Monthly (Strategy). | Pinpoints revenue drivers, identifies pricing opportunities, highlights underperforming segments. |
Customer/ Merchant Acquisition & Retention Dashboard | Monitors merchant lifecycle performance—from acquisition through activation to retention. Identifies onboarding friction, high-performing channels, and churn risks. | Metrics: CAC, Cost per Active Merchant, Sign-up to Activation Rate, Time to First Transaction (TFT), New Active Merchants, Active Merchants, Churn %, Net Revenue Retention (NRR), Cohort Retention. Visuals: Sign-up → Activation funnel, CAC by channel (bar), activation time distribution, retention curves, cohort analysis. Cadence: Weekly / Monthly. | Improves acquisition efficiency, identifies onboarding friction, reveals churn patterns, supports retention strategies. |
Payment Method Usage | Tracks adoption and performance of payment methods (cards, wallets, BNPL, bank transfers). Helps prioritize expansion of high-growth or high-margin methods. | Metrics: Transaction volume and value by payment method, growth rates, success/failure rates, adoption by region/merchant segment. Visuals: Stacked area or donut charts for usage share, trend lines for adoption, success rate comparisons. Cadence: Monthly. | Identifies preferred payment methods, detects failures or underperformance, informs product roadmap and payment method expansion. |
System Health & Payment Reliability | Monitors platform stability and transaction performance to ensure high authorization rates and minimal downtime. Enables rapid detection of routing or infrastructure issues. | Metrics: Authorization Success Rate, Decline Rate by issuer/BIN, Uptime %, Error Rate, API latency, transaction processing time. Visuals: Real-time system dashboards, geographic heat maps, incident timelines, performance logs. Cadence: Real-time monitoring + daily operational review. | Reduces outages, improves authorization success rates, protects merchant experience and transaction volume. |
Fraud & Security | Provides visibility into fraud activity, chargebacks, and risk patterns. Enables tuning of fraud rules and fraud models to balance approval rates and fraud losses. | Metrics: Fraud Rate (% of transactions), Chargeback Rate, Suspicious Transactions, False Positive Rate, Velocity Alerts, Fraud Loss Amount. Visuals: Fraud heatmaps, alert dashboards, chargeback trends, risk scoring distributions. Cadence: Near real-time alerts + daily/weekly summaries. | Minimizes fraud losses, reduces false declines, protects platform reputation and merchant trust. |
Cost & Fees | Breaks down transaction costs across networks, card types, and partners to identify margin improvement opportunities. Supports routing optimization and pricing strategy. | Metrics: Cost per Transaction, Interchange Fees, Network Fees, Net Take Rate, Gross Margin %, Cost by Payment Method/Region. Visuals: Cost breakdown charts, margin waterfalls, cost-per-transaction trends. Cadence: Weekly (Ops), Monthly (Finance). | Identifies high-cost transaction flows, informs partner negotiations, improves contribution margins. |
Images to the dashboard below:
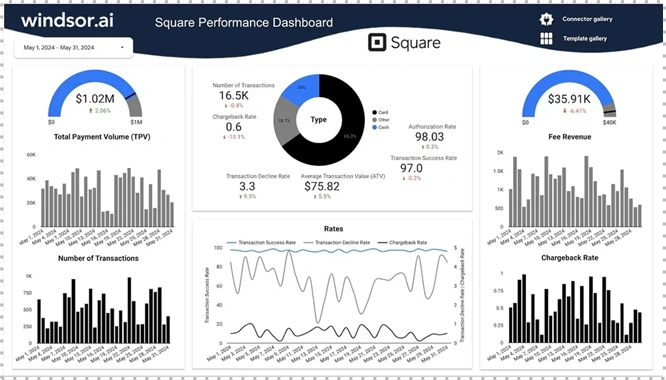
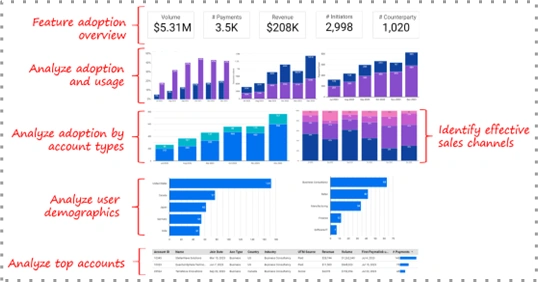
1. Revenue & Transaction Performance Dashboard
Purpose: Monitor revenue growth and transaction performance across merchant segments, payment methods, and regions to identify monetization opportunities.
Decision Flow:
- Metrics: Gross Payment Volume (GPV / GMV), Average Order Value (AOV), Transaction Count
- Visuals: Revenue trend line (monthly/weekly),Revenue contribution by merchant segment (treemap), Take rate by payment method (bar chart), Volume by geography (map), Revenue vs transaction growth comparison
Audience: Finance, Product, CEO
Benefits: Pinpoints revenue drivers, optimizes pricing decisions
Source – link
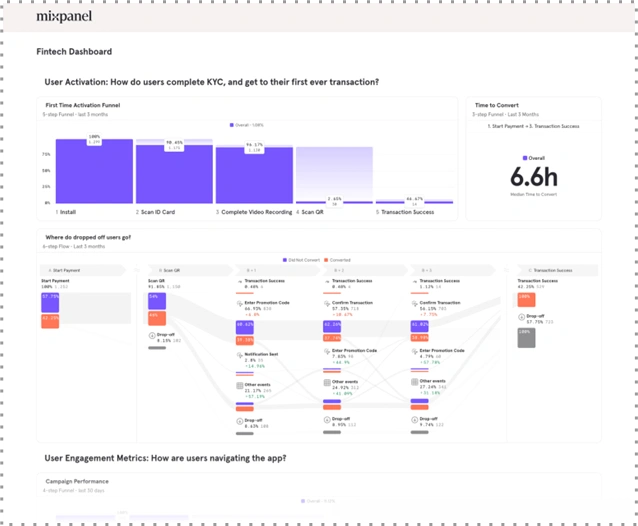
2. Customer Acquisition Dashboard
Purpose: This dashboard helps businesses understand where they’re getting customers from, how effectively they’re acquiring them, and how to optimize their strategies for better growth.
Decision Flow:
- Metrics: Amount Spent, Cost per Active Merchant, Sign-up to Activation Rate,Onboarding Time,New Active Accounts
- Visuals: Funnel chart (sign-up to activation), CAC by Channel (Bar),Activation Time (Line/Box Plot)
Audience: Growth, Marketing, Customer Success
Benefits: Sharpens targeting, tracks onboarding and effective sales campaigns
Additional Materials: Source 1. Paypal 2. Medium
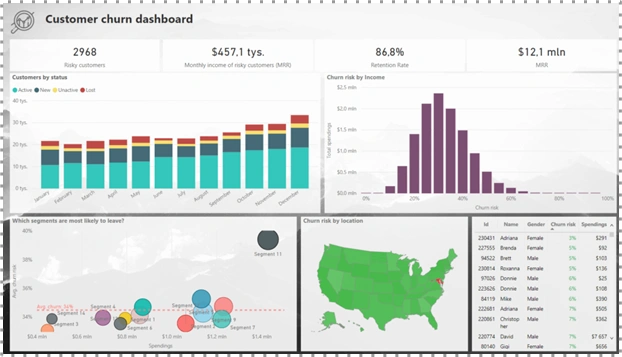
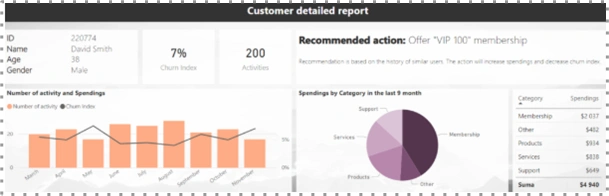
3. Customer Retention Dashboard
Purpose: This dashboard provides a granular look at key metrics that can help you understand your retention rates, identify potential risks, and take proactive measures to keep your merchants engaged and satisfied..
Decision Flow:
- Metrics: Active Accounts, Churn %, Risky Customers,Retention by cohorts
- Visuals: Funnel chart (sign-up to activation), Retention curves
Audience: Growth, Marketing, Customer Success
Benefits: Sharpens targeting, tracks onboarding, reveals churn trends
Additional Material: Source
4. Payment Method Usage Dashboard:
Purpose: Track adoption of different payment options and plan expansions. Shows where to invest (e.g. mobile wallets, local methods).
Decision Flow: Monitor growth and usage patterns across all payment methods to identify high-performing options. Analyze failure rates to flag operational issues. Evaluate customer preference trends to align internal offerings with what users actually choose. Use insights to expand or de-prioritize specific methods.
Metrics: Number and value of transactions by payment method, payment method growth rates, and successful vs failed counts per method.
Visuals: stacked area or donut charts of usage share; trend lines of new method adoption. Also “NPS by payment method” if data exists.
Cadence: Monthly. Updates as new methods (e.g. BNPL, crypto) roll out.
Audience: Head of Product, CEO. Guides decisions to add new methods that customers prefer.
Explore more: The CIO’s View: Top IT Dashboards Driving Reliability, Security, and Value

Additional Material: Source
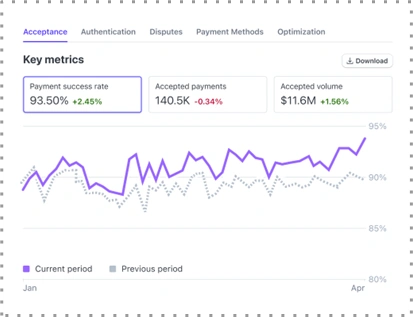
5. System Health & Uptime Dashboard:
- Purpose: Track infrastructure and service reliability to meet Service level agreements. Downtime directly hurts sales. Monitor live throughput and latency to ensure fast, reliable processing (a top UX driver). Fast processing prevents cart abandonment and lost revenue (Checkout.com notes 76% of UK shoppers quit if payments are slow)
- Metrics & Visuals:
Decline rates and reasons: Did you know 45% of customers will not retry a payment if it declines on first attempt?. Uptime %, error rate, latency, auth success rate are important KPI’s. There are many adjustments that can be made to improve authorization rates, many of which can be improved using ML.
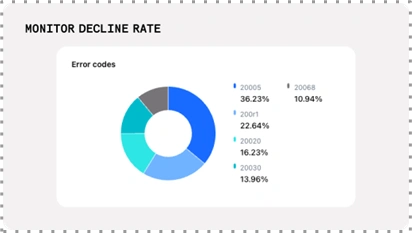
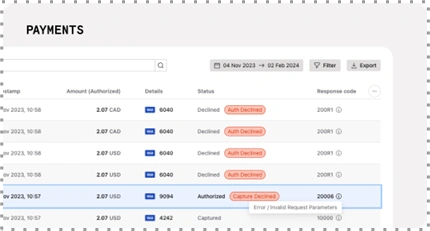
- Visuals: logs, world maps, incident timelines
- Cadence: Real-time monitoring and aggregated daily logs. Alerts on outages and trend analysis over days.
- Audience: CTO/COO and Site Reliability teams. Quickly address outages and maintain reliability (a key success factor).
- Benefits: Reduces downtime, prevents failed checkouts
6. Fraud & Security Dashboard:
- Purpose: Detect and respond to fraud/risks in real time, protecting revenue and trust. Rising fraud prevalence threatens profitability and compliance.
Alarmingly, a growing number of US enterprises are experiencing payment fraud: 46% in 2023, up from 32% the year prior. Failing to keep up with fraud monitoring will not only ravage your balance sheets, it can damage your business reputation, incur costly legal action, and even restrict your ability to trade. - Metrics & Visuals: Suspicious transaction count, fraud rate (fraudulent vs approved transactions), chargeback rate, false-positive rate (blocked but legitimate), unusual velocity (transactions per card/ IP). Visuals might include alerts on spikes (e.g. burst in same-card attempts ), geographic fraud heatmap, and trends of chargeback volume.
- Cadence: Near-real-time (continuous stream analysis) with alerts for anomalies. Also daily and weekly summaries of fraud trends.
- Audience: Head of Risk/Fraud, COO. Enables swift blocking of attacks (e.g. rapid-fire attempts) and assessment of fraud prevention effectiveness.
- Benefits: Balancing acceptance with fraud prevention, Tracking fraud velocity, enhanced reputation and trust
Learn more: People Strategy in Focus: 8 Executive Dashboards for HR Leaders
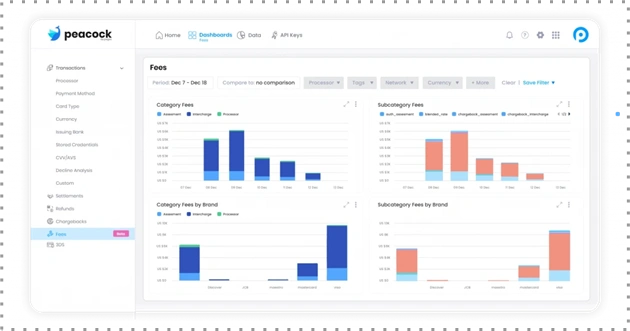
7.Cost & Fees Dashboard:
- Purpose: Analyze cost-per-transaction and fee structure to optimize margins. Executives need visibility into how interchange and partner fees eat revenue .
- Metrics & Visuals: Average cost per transaction (network interchange + gateway fees) , total fees as % of volume, net take-rate, interchange fees by card type/region. Visuals: stacked bar showing gross vs net, line chart of cost% trend, and breakdown pie of fee components (e.g. interchange vs processing). A useful view is fees per payment method or per region.
- Cadence: Monthly (or weekly for large volumes). Align with finance closes.
- Audience: CFO, COO. Identifies high-cost channels or shifts in fees.
- Benefits: Uncovers hidden cost drivers early, Helps reroute or renegotiate high-fee channels, Empowers data-driven pricing and margin optimization
Read more: Marketing Metrics That Matter: Top 10 Dashboards for CMOs
Closing Note
At Perceptive Analytics, we believe data is a strategic lever. In payments, where every millisecond, basis point, and customer touchpoint counts—visibility is power.
The most successful platforms don’t just track what happened; they build systems to influence what happens next. If you’re ready to turn your payment data into a high-impact growth engine, we’re ready to help.
Talk with our expert BI Consultants (Power BI Consulting & Tableau Consulting) today- Book a free 30-min consultation session