Power BI Optimization Checklist and Guide
Power BI | January 21, 2026


How to use this checklist and guide?
This Power BI Checklist & Guide is designed to help you build efficient, high-performance dashboards while following best practices. It ensures that your dashboards are structured, optimized, and easy to use. It would also help you fine tune your dashboard for a better performance.
What’s in This Document?
This document consists of two main sections:
- The Checklist
- A structured list of best practices for building Power BI dashboards.
- Covers key areas such as data source, visualizations, dashboard design and performance.
- Helps you stay on track and avoid common mistakes.
- The Guide
- Detailed explanations for each checklist item.
- Provides insights into why each step matters and how to implement it effectively.
- Helps you troubleshoot potential issues and improve dashboard performance.
- Additionally, the outline on the left allows you to quickly navigate through different sections of the document.
How to Use This Document?
- Navigate Using the Outline
Use the document outline (on the left) to jump to different sections quickly.
- Follow the Checklist
Use the checklist as a step-by-step guide while building your dashboards.
Mark off items as you complete them to ensure best practices are followed.
- Refer to the Guide for More Details
If you need clarification on a checklist item, refer to the guide for a deeper explanation.
You can get to the guide for that particular item by clicking on the point and following the bookmark. This section provides additional context, best practices, and optimization tips.
- Make a Copy & Use It for Your Work
Duplicate this document and use it as a reference while working on your dashboards.
Ensuring each item is checked off will help improve performance, usability, and consistency.
Power-BI Checklist
1. Data Model Design
- Use a Star Schema for simplified relationships (fact and dimension tables)
- Avoid complex many-to-many relationships; use bridge tables when needed.
- Remove unused columns, tables, and calculated columns.
- Don’t use autogenerated date tables
- Use proper data types (e.g., numeric over text) for better compression.
- Ensure relationships are single-directional unless bidirectional is essential.
- Ensure column names, relationships, and measures are properly documented for future scalability.
2. Data Source Optimization
- Filter and reduce unnecessary rows/columns in Power Query before loading data.
- Perform aggregations (e.g., summing, grouping) at the source whenever possible.
- Use Import Mode over DirectQuery unless real-time updates are mandatory.
- Optimize queries at the data source (e.g., add indexes and avoid expensive joins).
3. DAX Calculations
- Use measures instead of calculated columns for dynamic calculations.
- Precompute repetitive or complex calculations in Power Query or the data source.
- Avoid row-based operations like SUMX, FILTER, and CALCULATETABLE unless necessary.
- Use combination of COUNTROWS and VALUES instead of DISTINCTCOUNT
- In your DAX calculations, filter as soon as you can.
- Create columns on Power Query instead of Calculated Columns
- Test and optimize DAX measures for performance using Performance Analyzer in Power BI.
4. Filtering and Slicers
- Use slicers sparingly and replace them with dropdowns or buttons where possible.
- Apply filters at the report or page level instead of the visual level.
- Avoid excessive use of cross-filtering; manage relationships appropriately.
- Add a single Apply button to the filter pane to apply changes at once (preview)
5. Visualizations
- Limit the number of visuals per page. ??
- Use built-in Power BI visuals instead of custom visuals wherever possible.
- Simplify large visuals like tables/matrices by limiting rows and columns displayed.
- Minimize the use of conditional formatting and complex visual interactions.
6. Managing Data Granularity
- Load data at the required level of granularity (e.g., monthly instead of daily if detailed trends aren’t necessary).
- Use aggregated tables for high-level insights and detailed tables only when required.
- Remove unnecessary high-cardinality columns like unique IDs or excessively detailed timestamps.
7. Performance Testing and Monitoring
- Use Performance Analyzer to identify slow visuals or calculations.
- Optimize slow-running queries and visuals based on insights from Performance Analyzer. ?
- Regularly test dashboard performance with realistic data volumes.
Our Power BI consulting services help organizations design scalable, governed BI environments that deliver trusted insights faster.
Talk with our Power BI Consultants today. Book a free 30-min session now
Power BI Optimization Guide
Data Model Design
A data model in Power BI is the structured representation of your data, which includes tables, relationships, calculations (DAX), and hierarchies. It determines how data from different sources connects and interacts within your reports and dashboards.
Power BI follows a columnar database structure and relies on the VertiPaq engine, which compresses and optimizes data for efficient querying.
A good data model ensures that Power BI processes queries efficiently, minimizes resource usage, and delivers faster performance for dashboards.
Spend a good amount of time in perfecting your data model to have a seamless experience in creating visualizations for your reports.
1. Use a Star Schema for simplified relationships (fact and dimension tables).
Star Schema: Star schema is the simplest method for arranging data in a data warehouse. It contains a fact table at the center connected to dimension tables around it. Star schema is most effective for quick and simple data query execution.

Snowflake Schema: Snowflake schema is a more complex method of storing data in which fact tables, dimension tables and sub-dimension tables are connected through foreign keys. Snowflake is most effective for in-depth data query analyses.

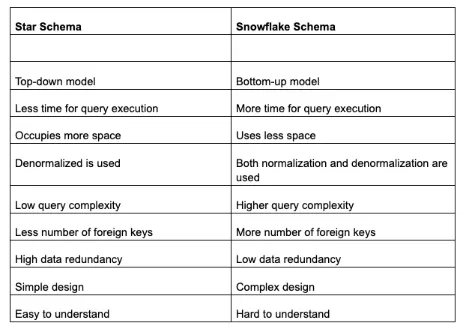
So when not to use a star schema?
It’s best not to use a star schema for data warehouses that are complex, have dynamic dimensions or require high accuracy and data normalization. A star schema denormalizes data, which can limit data depth and breadth and affect performance in the above cases.
2. Avoid complex many-to-many relationships on
Bi-directional relationships refer to the two-way data flow between tables. Many-to-many relationships refer to multiple records in one table being related to multiple records in another. High cardinality columns are columns in a table with many unique values relative to the total number of rows.
When applied to high-cardinality columns, these relationships can significantly impact report performance due to increased data processing and query complexity.
Avoid these relationships to optimize query performance and reduce resource consumption, leading to faster report rendering.
3. Remove unused columns, tables, and calculated columns.
Removing unused columns, tables, and calculated columns in Power BI optimizes memory usage, query performance, and refresh speed by reducing the amount of data the VertiPaq engine processes.
A smaller model improves compression ratios, lowering RAM consumption and file size, leading to faster dashboard interactions. Removing unused columns prevents unnecessary scans during queries, reducing DAX execution time and improving visual load speed. It also simplifies relationships, avoiding redundant dependencies that slow down calculations. Additionally, a cleaner data model is easier to maintain, debug, and scale, making it more intuitive for users.
4. Replace autogenerated date table
Replacing auto-generated date tables with custom ones reduces model size and increases performance. The auto-generated date table creates a separate table for each date column, which can bloat the model. A singular custom date table, with date and time split for better compression, streamlines the model and allows for more efficient use of time-series functions in Power BI.
On your Power BI Desktop,
Go to Settings -> options -> Current file -> ‘Data Load’ and then untick Auto date/time under Time Intelligence. If you want this for every Power BI project you are going to work on, do the same but by going to the Global section.

5. Use proper data types (e.g., numeric over text) for better compression.
Numeric columns (Whole Numbers, Decimals, Boolean, DateTime) compress better than text fields because VertiPaq stores numbers efficiently in columnar storage.
Text columns (e.g., Customer Names, Product Codes) have high cardinality (many unique values), which reduces compression efficiency.
Using numeric fields instead of text helps Power BI compress data more efficiently, execute queries faster, reduce memory usage, optimize relationships, and improve dashboard responsiveness. By ensuring proper data types, you minimize processing overhead, making your reports faster, lighter, and more scalable
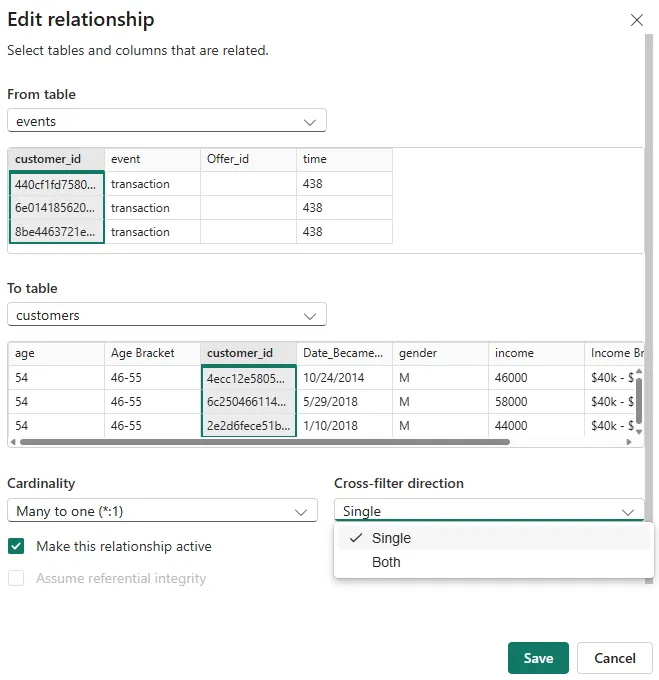
6. Ensure relationships are single-directional unless bidirectional is essential.
In a single-directional relationship, filters flow from one table to another in a single direction. This is the default and most efficient way to propagate filtering in a star schema model.
In a bi-directional relationship, filters flow in both directions between tables. This can create performance issues because Power BI has to evaluate more complex queries to maintain both directions.
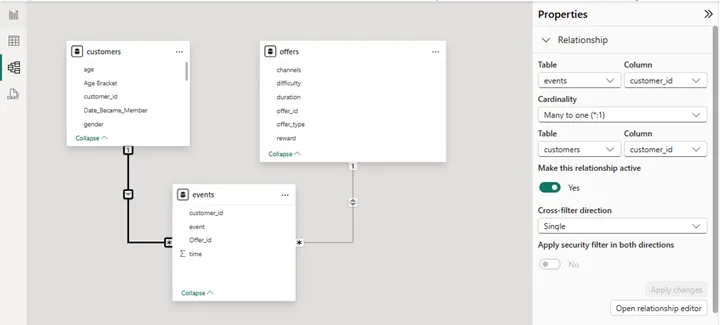
You can change the cross-filter direction by going to your model view, clicking on the relationship and going to properties. An ‘Edit Relationship’ window opens and you can set your cross-filter direction.
An alternative is to or click on the properties tab on the right side of your model view
Data Source Optimization
Data Source Optimization in Power BI refers to the process of preparing, structuring, and optimizing the data before it is loaded into Power BI. It involves techniques such as reducing unnecessary data, improving query performance, aggregating data at the source, and choosing efficient connection modes (Import vs. DirectQuery). The goal is to minimize data size, enhance refresh speed, reduce processing time, and ensure efficient report performance.
1. Filter and reduce unnecessary rows/columns in Power Query before loading data.
Reducing data volume in Power Query before loading it into Power BI improves performance by minimizing memory usage and query processing time. Every additional row and column increases the size of the dataset, making queries and calculations slower. Removing unnecessary columns reduces the storage footprint, while filtering out irrelevant rows decreases the number of records Power BI needs to process.
Since Power Query applies transformations before data reaches the VertiPaq engine, optimizing data here ensures that only the essential data is loaded, leading to faster refresh times and better dashboard performance.
2. Perform aggregations (e.g., summing, grouping) at the source whenever possible.
Choosing the right storage mode (Import, DirectQuery, or Dual) based on your data aggregation needs and visualization requirements is crucial. This decision impacts where your data is stored and how queries are processed, directly affecting the report’s responsiveness and efficiency.
Aggregating data at the database level (SQL, Azure, or other sources) rather than in Power BI improves efficiency by reducing the number of rows that need to be stored and processed. The VertiPaq engine performs best with pre-aggregated data, as row-level details require more memory and increase calculation time. Instead of loading millions of detailed records, grouping data by month, category, or product level reduces processing time and makes measures, filters, and visualizations run faster. This also shifts the computational load to the data source, leveraging its performance capabilities instead of burdening Power BI.
3. Choose ideal storage mode: Import Mode or DirectQuery
Import Mode loads data into Power BI’s in-memory VertiPaq engine, making queries significantly faster than DirectQuery, which retrieves data from the source in real-time. Since Import Mode caches data, it allows for instant filtering, aggregations, and visuals rendering without waiting for database queries to execute.
DirectQuery could be used when real-time updates are necessary, as it depends on the performance of the external database, leading to slower visual interactions, increased query load, and potential performance bottlenecks. For large datasets, hybrid models (composite models) can be used to keep frequently used data in Import Mode while allowing real-time queries on selected tables.
4. Optimize queries at the data source (e.g., add indexes and avoid expensive joins).
Optimizing queries at the database level before Power BI processes them ensures faster data retrieval and report performance. Indexing frequently used columns in relational databases (like SQL) speeds up joins, lookups, and filters, reducing query execution time.
Expensive operations like nested subqueries, large cross-joins, and non-indexed searches can cause significant slowdowns, especially when using DirectQuery mode.
Instead, pre-aggregating data, using indexed keys for joins, and avoiding excessive calculations in queries ensures that Power BI receives optimized, structured data that loads and processes efficiently.
Learn more: Answering strategic questions through high-impact dashboards
DAX Calculations
Optimizing DAX (Data Analysis Expressions) calculations in Power BI is essential for ensuring faster query execution, reducing memory consumption, improving dashboard responsiveness, and maintaining scalability. Since Power BI relies on in-memory processing (VertiPaq engine), poorly optimized DAX can slow down visuals, overload CPU and RAM, and degrade user experience.
1. Use measures instead of calculated columns for dynamic calculations.
Complex measures and aggregations in data models can slow down query performance. Using calculated measures, which is computed during query execution, are more efficient than calculated columns. Applying filters can also aid in this process.
Measures are calculated at query time when a user interacts with the report, whereas calculated columns are precomputed and stored in the data model, increasing memory usage. Using measures instead of calculated columns ensures that calculations remain dynamic and optimized, reducing the dataset size and improving dashboard responsiveness.
Calculated columns consume memory permanently, whereas measures execute only when needed, making them more efficient.
For example: If our report only requires the Total Profit measure then instead of building a calculated column and then a measure as shown below:
ProfitColumn = Sales[Amount] – Sales[Cost]
TotalProfit = SUM(Sales[ProfitColumn])
Build only a measure as follows:
TotalProfit = SUM(Sales[Amount]) – SUM(Sales[Cost])
2. Precompute repetitive or complex calculations in Power Query or the data source.
Complex calculations performed at runtime in DAX can slow down queries, especially with large datasets.
Moving calculations to Power Query or SQL ensures they are processed before loading into Power BI, reducing the workload on the VertiPaq engine.
Precomputing also improves data refresh speed, as Power BI doesn’t need to repeatedly calculate values every time a user interacts with a report.
3. Avoid row-based operations like SUMX, FILTER, and CALCULATETABLE unless necessary.
Iterator functions like SUMX, FILTER, and CALCULATETABLE process data row by row, making them slow for large datasets.
The VertiPaq engine is optimized for columnar storage and aggregation functions (SUM, COUNT, AVERAGE), which perform significantly faster than row-based operations.
Row-based operations should only be used when absolutely necessary, and alternative approaches (e.g., using summary tables or aggregations) should be considered first.
4. Test and optimize DAX measures for performance using Performance Analyzer in Power BI.
Power BI’s Performance Analyzer helps identify slow DAX queries, inefficient visuals, and high-impact calculations.
It breaks down the time taken for each visual, query, and calculation, allowing developers to optimize slow measures.
By testing DAX performance, you can refine formulas, remove unnecessary calculations, and optimize data model design.
Many teams choose to hire Power BI consultants to accelerate delivery while maintaining governance and data consistency.
Filtering and Slicers
1. Use slicers sparingly and replace them with dropdowns or buttons where possible.
Slicers are a great way of allowing users to navigate data, but they come at a performance cost. Each slicer generates two queries: one fetches the data and the other fetches selection details. Adding too many slicers drastically slows performance. Use the Filter pane to evaluate and remove unnecessary slicers.
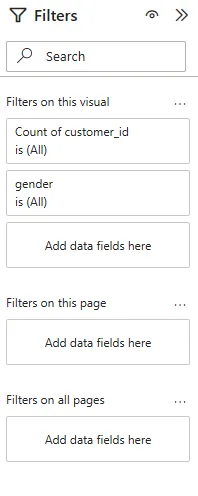
2. Apply filters at the report or page level instead of the visual level.
Visual-level filters apply queries individually to each chart, leading to repeated calculations and slower performance.
Report-level and page-level filters apply once for the entire report or page, reducing redundant processing.

3. Configure visual interactions for filtering and highlighting
Configuring visual interactions involves defining how visuals on a report page interact with each other based on user selections and filters. Wisely configuring these interactions can optimize performance by reducing unnecessary data processing and refreshing.
For example, setting visuals to only interact with relevant slicers or filters ensures that only pertinent data is updated when users make selections. This targeted approach minimizes the computational overhead and improves the responsiveness of interactive reports in Power BI.
This can be after you select a visual and go to Format -> Edit Interactions.
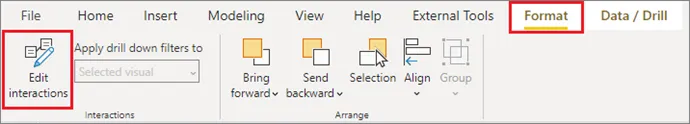
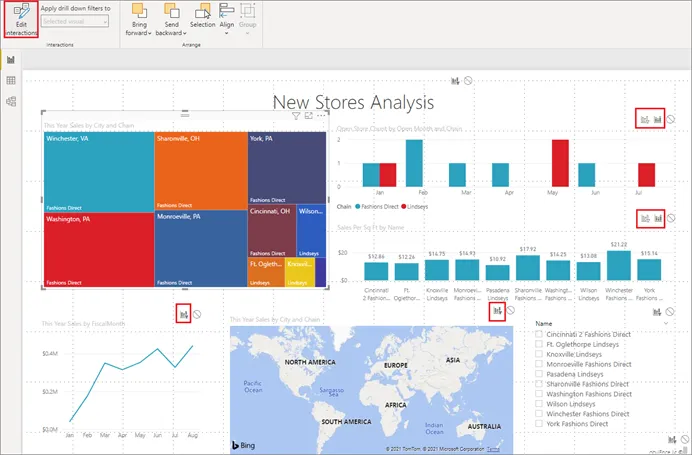
- If you want the selected visualization to cross-filter one of the other visualizations on the page, select the filter icon in the upper right corner of that visualization
- You can only cross-filter line charts, scatter charts, and maps. You can’t cross-highlight them.
- If you want the selected visualization to cross-highlight one of the other visualizations on the page, select the highlight icon
- If you want the selected visualization to have no impact on one of the other visualizations on the page, select the no impact icon
4. Add a single Apply button to the filter pane to apply changes at once (preview)
For filters, the Add a single Apply button to the filter pane to apply changes at once option consolidates filter changes and applies them all at once, further minimizing query volume.
Reducing the number of queries improves report performance, especially when dealing with complex reports and large datasets.
Explore more: Choosing the right data transformation maturity framework for enterprise reliability
Visualisations
Creating optimized visuals in Power BI ensures faster load times, better user experience, and efficient data processing. Poorly designed visuals can overload memory, slow down interactions, and increase query complexity, negatively impacting dashboard performance.
1. Limit the number of visuals per page.
Each visual in Power BI executes its own query, and having too many visuals on a page increases processing time and slows down rendering. More visuals leads to more queries which further leads to higher CPU and memory usage, making dashboards unresponsive. Power BI renders visuals sequentially, so reducing the number of visuals improves load time.
2. Use built-in Power BI visuals instead of custom visuals wherever possible.
Custom visuals (downloaded from AppSource) often require more memory and longer load times compared to built-in Power BI visuals.
Some custom visuals run JavaScript code in the background, making them slower and less optimized.
Built-in visuals leverage Power BI’s optimized rendering engine, ensuring better performance and scalability.
3. Simplify large visuals like tables/matrices by limiting rows and columns displayed.
Large tables/matrices with thousands of rows and columns force Power BI to process and render excessive data, slowing down performance. The VertiPaq engine works best with summarized data, so limiting displayed data reduces query execution time.
Limit tables to show only the top 10/20 rows instead of full datasets. Use aggregations instead of raw transactional data. Apply drill-throughs or report tooltips to show details only when needed. Use hierarchies and expand/collapse features instead of showing all data at once.
4. Minimize the use of conditional formatting and complex visual interactions.
Conditional formatting (color scales, data bars, icons) adds extra computation, especially in large tables.
Excessive interactions (cross-filtering, highlighting across multiple visuals) slow down queries by increasing filter complexity.
Simplifying visuals reduces rendering time and improves dashboard fluidity.
Managing Data Granularity
Data granularity refers to the level of detail stored in your dataset (e.g., transaction-level vs. aggregated data). Properly managing granularity ensures that Power BI dashboards run efficiently, reduce memory usage, and improve query performance. If granularity is too high (too detailed), it increases data size, slows calculations, and overloads visuals. If too low (too summarized), it loses critical insights. Optimizing granularity helps balance performance and analytical depth.
1. Load data at the required level of granularity (e.g., monthly instead of daily if detailed trends aren’t necessary).
Lower granularity (aggregated data) reduces the number of rows in your dataset, making queries faster and memory usage lower.
If analysis doesn’t require daily or transactional-level details, storing only monthly or quarterly aggregates makes visuals and calculations more efficient.
The VertiPaq engine in Power BI compresses data better when fewer rows exist, leading to faster report performance.
2. Use aggregated tables for high-level insights and detailed tables only when required.
Aggregation tables store pre-summarized data, reducing the need for complex DAX calculations.
Instead of querying raw data for every visual, Power BI can redirect queries to smaller, aggregated tables.
This significantly improves query performance and dashboard responsiveness.
3. Remove unnecessary high-cardinality columns like unique IDs or excessively detailed timestamps.
High-cardinality columns (columns with many unique values, such as Transaction IDs or precise timestamps) take up a lot of memory and slow down filtering, relationships, and calculations.
Removing or transforming them improves Power BI’s compression and enhances performance.
Timestamps with second-level precision often aren’t necessary and add unnecessary data points.
Performance Testing and Monitoring
Performance testing and monitoring are critical for optimizing Power BI dashboards, ensuring that reports run efficiently, load quickly, and scale effectively as data grows. Without monitoring, slow queries, excessive memory usage, and inefficient DAX calculations can degrade user experience, increase refresh times, and overload system resources. Regular performance testing helps identify bottlenecks, improve query efficiency, and maintain dashboard responsiveness.
1. Use Performance Analyzer to identify slow visuals or calculations.
Performance Analyzer in Power BI tracks how long each visual, DAX query, and report action takes to execute.
It helps pinpoint which visuals, filters, or calculations are causing slow performance, allowing targeted optimizations.
Without Performance Analyzer, it’s difficult to know whether slowdowns are due to DAX formulas, data model inefficiencies, or Power BI Service limitations.
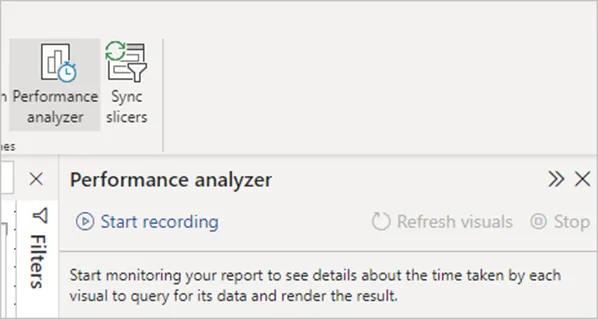
How to use it:
- Go to View → Performance Analyzer in Power BI Desktop.
- Click Start Recording and interact with the report.
- Analyze Query Execution Time, DAX Query Time, and Visual Rendering Time to identify slow elements.

2. Optimize slow-running queries and visuals based on insights from Performance Analyzer.
Once slow visuals or queries are identified, optimizing them ensures faster report load times and better user experience.
Many performance issues arise due to inefficient DAX calculations, excessive filters, complex visuals, or unnecessary relationships.

3. Regularly test dashboard performance with realistic data volumes.
Dashboards often perform well with small test datasets, but when deployed with full production data, performance issues arise.
Regularly testing with realistic data volumes ensures that dashboards remain scalable and efficient as data grows.
Test with actual dataset sizes instead of small development samples. Monitor refresh times and visual response times in Power BI Service. Use incremental refresh for large datasets to avoid full data reloads.
Talk with our Power BI Consultants today. Book a free 30-min session now