


Introduction
In today’s enterprises, Human Resources has moved beyond administration to become a strategic driver of organizational performance. For executives, the ability to see workforce health, hiring efficiency, retention risk, skill readiness, and diversity in one view is critical. These insights are no longer just operational; they directly influence cost control, productivity, culture, and long-term competitiveness. This article curates eight executive dashboards that translate HR’s most complex data into actionable intelligence. From workforce composition and pay structures to engagement, turnover, capability development, and diversity outcomes, each dashboard surfaces the metrics that matter at the boardroom table. Together, they provide leaders with a comprehensive lens on people strategy, enabling faster and better-informed decisions that protect talent, optimize resources, and strengthen organizational resilience.
| Sr. No | Dashboard | Key takeaway — why this matters for HR leaders |
| 1 | HR Executive Summary Dashboard | Provides a consolidated view of workforce size, distribution, and demographics, enabling better workforce planning and policy decisions |
| 2 | Compensation & Benefits Overview Dashboard | Surfaces total workforce pay and benefits trends, helping leaders manage costs, ensure equity, and spot overspending |
| 3 | Employee Performance Dashboard | Links utilization, billability, and labor costs, giving executives a clear view of productivity and profitability drivers |
| 4 | Employee Engagement & Workplace Sentiment Dashboard | Tracks satisfaction, NPS, and absenteeism, allowing early detection of disengagement risks and cultural gaps |
| 5 | Talent Acquisition Dashboard | Monitors recruitment funnel, time-to-fill, and sourcing effectiveness, enabling faster, higher-quality hiring |
| 6 | Learning & Development Dashboard | Surfaces readiness and training outcomes, ensuring workforce capability aligns with business needs |
| 7 | Turnover & Retention Risk Dashboard | Highlights attrition patterns and root causes, helping leaders prioritize retention strategies and protect critical talent |
| 8 | Diversity & Inclusion Dashboard | Provides executive-level DEI insights across gender, ethnicity, and leadership representation, aligning workforce culture with ESG and governance goals |
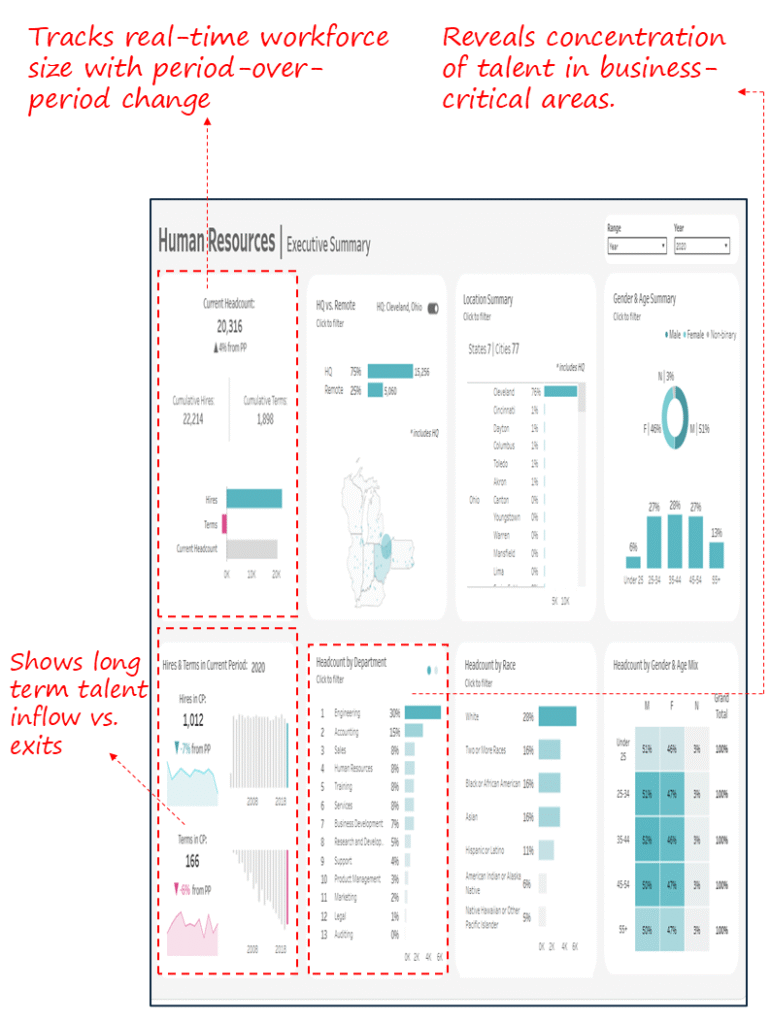
1.HR Executive Summary Dashboard
Industry Fit
Applicable across all industries with medium-to-large workforce footprints. Particularly valuable for organizations managing distributed teams across multiple geographies.
Most Relevant For
CHROs, HR Directors, Workforce Planning Leaders, and C-suite executives overseeing people strategy.
Objective
Provide a consolidated executive view of workforce size, distribution, demographics, and hiring/termination dynamics to guide strategic workforce planning and policy decisions.
What’s Good About This Dashboard
- Surfaces current headcount with cumulative hires vs. terminations, giving leaders a single source of truth for workforce scale.
- Breaks down workforce composition by department, age, and race to flag concentration risks or diversity gaps.
- Highlights location distribution and remote vs. HQ presence, supporting resource allocation and hybrid work policies.
- Tracks hiring and separation trends to anticipate future staffing needs and retention challenges.
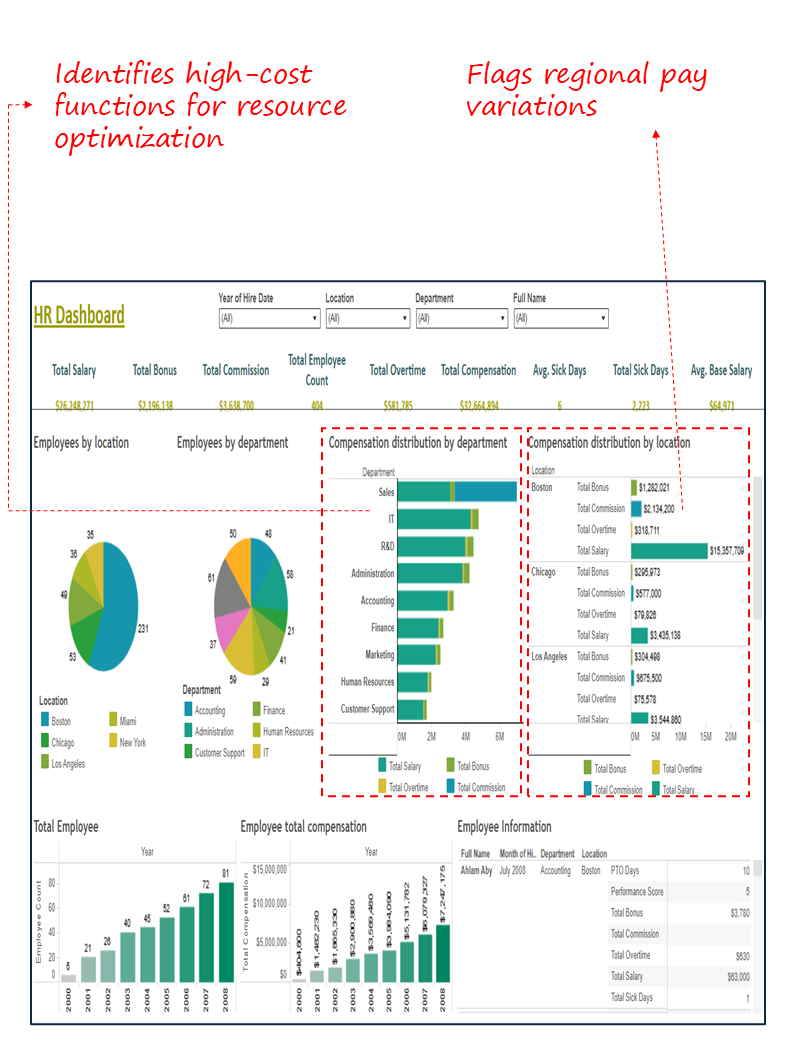
2.Compensation & Benefits Overview Dashboard
Industry Fit
Relevant across industries with large-scale workforces and structured pay frameworks, especially critical in sectors with multiple locations and functions.
Most Relevant For
CHROs, CFOs, and senior HR leaders responsible for workforce cost optimization, pay equity, and retention strategy.
Objective
Provide an executive view of total workforce compensation ,salary, bonus, overtime, and commissions segmented by department and geography, to spot disparities, overspending, and opportunities for workforce cost control.
What’s Good About This Dashboard
- Surfaces compensation distribution by department and location to identify high-cost areas.
- Links pay spend to workforce composition, highlighting where resources may be over- or under-invested.
- Enables benchmarking across functions and geographies, supporting equitable pay structures.
- Provides visibility into total workforce cost trends, aiding in strategic budgeting.

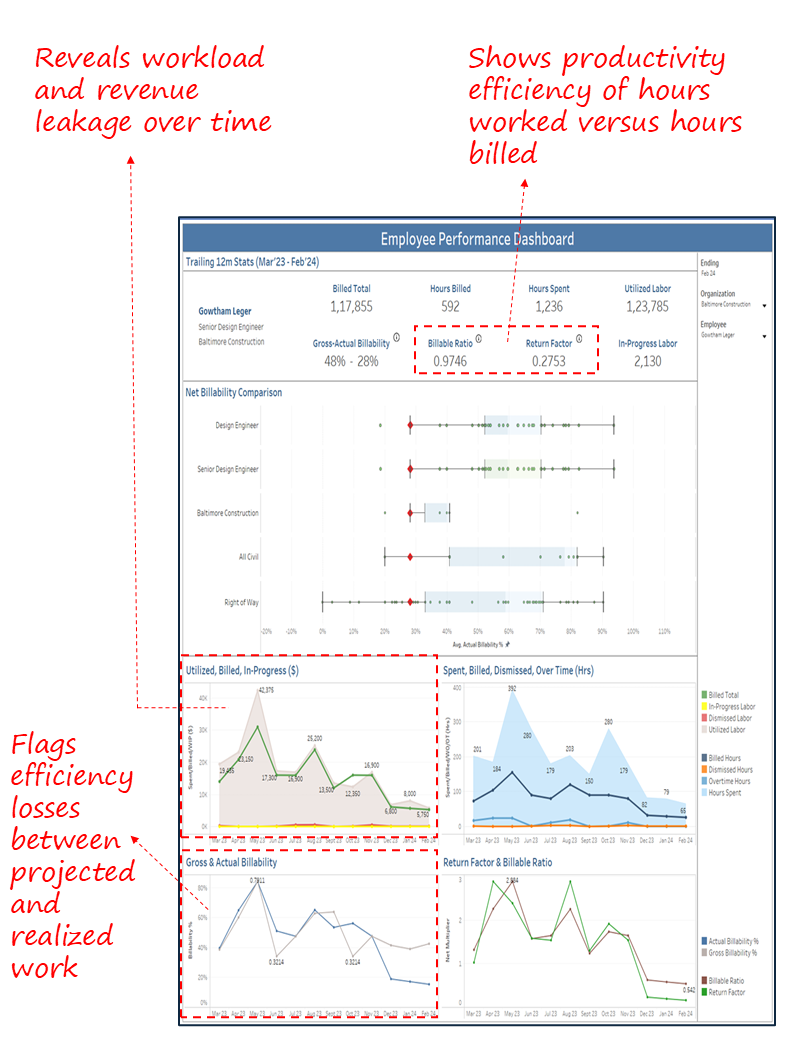
3.Employee Performance Dashboard
Industry Fit
Highly relevant for professional services, engineering, consulting, and project-based industries where employee utilization and billability directly impact revenue and profitability.
Most Relevant For
CHROs, COOs, and Department Heads monitoring workforce efficiency, project allocation, and revenue contribution.
Objective
Track performance across billable hours, utilization, and return factors to ensure efficient labour allocation and sustained profitability.
What’s Good About This Dashboard
- Links billable hours, utilization, and labour costs into a unified view for executive oversight.
- Surfaces gross vs. actual billability gaps, pointing to efficiency or delivery issues.
- Highlights in-progress vs. dismissed labour trends to signal workload misalignment or project leakage.
- Supports decisions on resource reallocation and workforce planning.

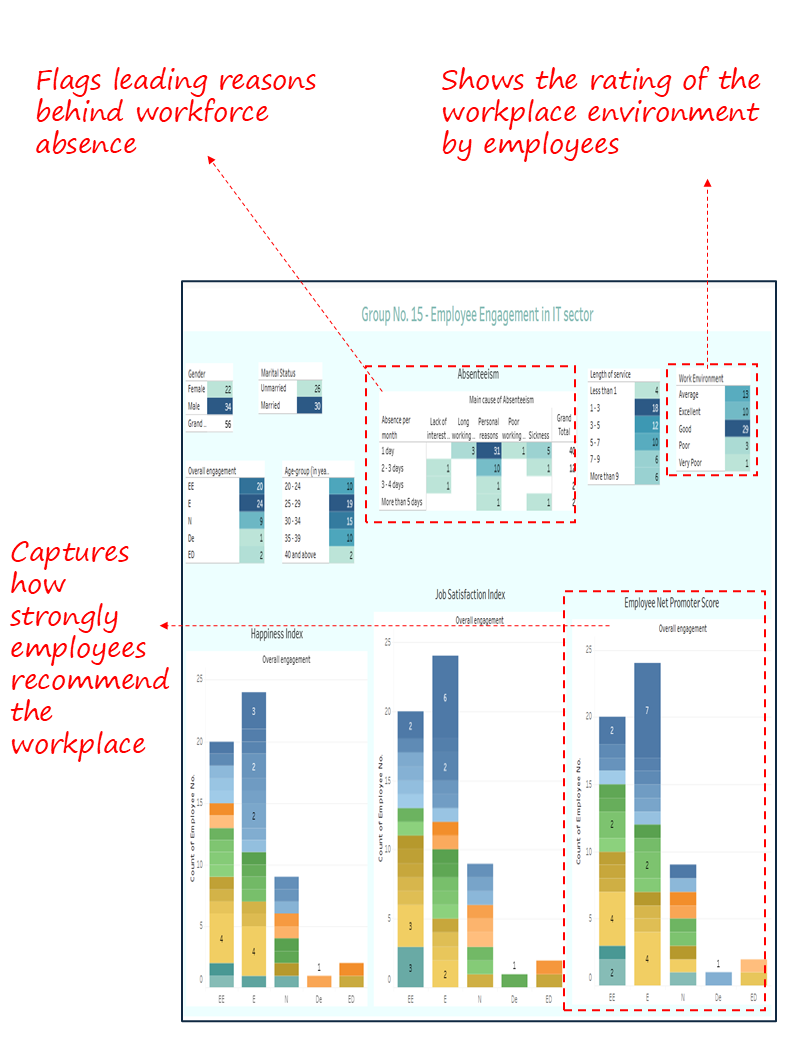
4.Employee Engagement & Workplace Sentiment Dashboard
Industry Fit
Multi-industry; applicable across sectors where workforce engagement and culture directly affect retention and productivity.
Most Relevant For
CHROs, HR Directors, and Employee Experience Leaders responsible for retention, cultural health, and organizational effectiveness.
Objective
Monitor employee engagement and sentiment, happiness, job satisfaction, and advocacy (NPS) along with absenteeism trends, to identify retention risks and guide interventions that improve culture and performance.
What’s Good About This Dashboard
- Integrates happiness, satisfaction, and Net Promoter Score into one view for comprehensive sentiment tracking.
- Links absenteeism patterns with root causes (illness, stress, personal reasons) to inform targeted interventions.
- Surfaces work environment ratings to highlight cultural strengths and gaps.
- Supports early identification of disengagement risks that impact productivity and attrition.

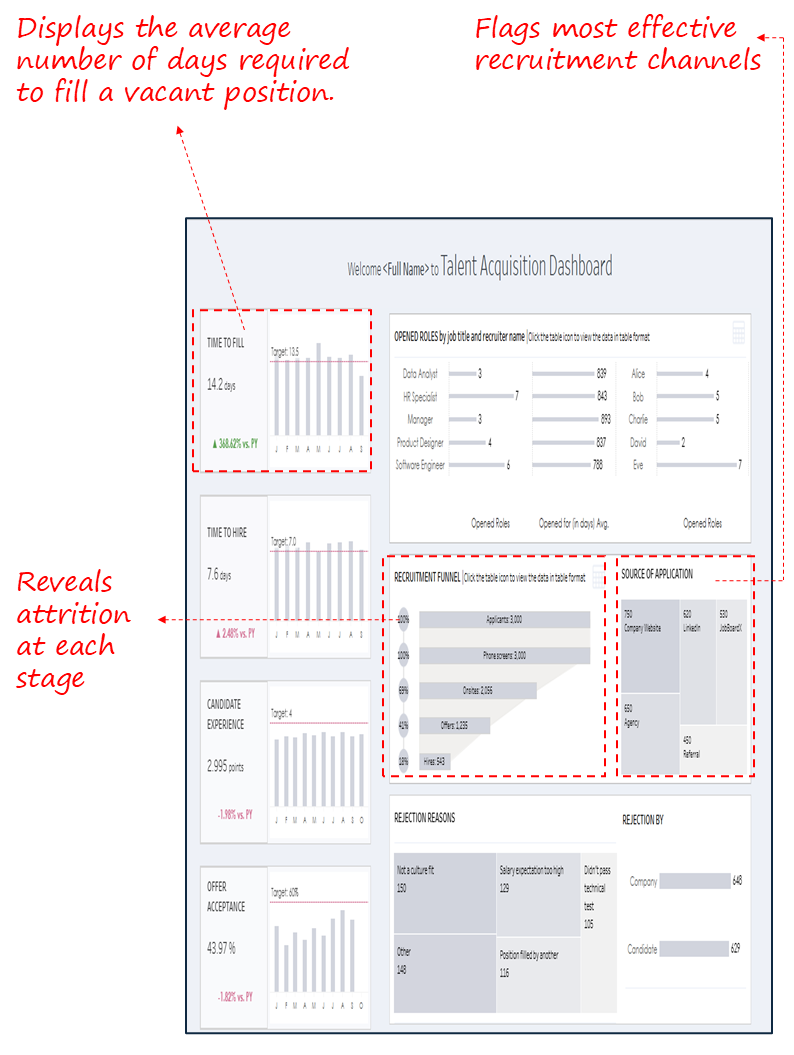
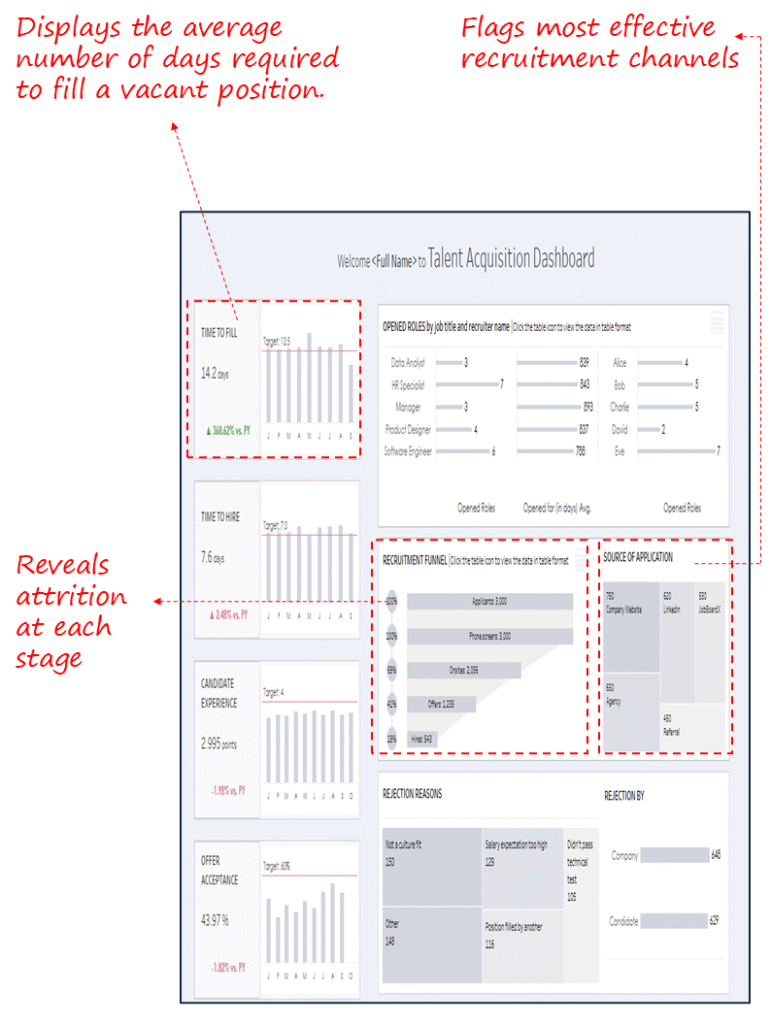
5.Talent Acquisition Dashboard
Industry Fit
Cross-industry; applicable to all organizations with ongoing hiring needs and competitive labor markets.
Most Relevant For
CHROs, Talent Acquisition Leaders, HR Directors, and Business Unit Leaders overseeing recruitment efficiency and workforce expansion.
Objective
Track hiring pipeline health and recruitment efficiency, focusing on time-to-fill, candidate progression, sourcing channels, and rejection causes to accelerate hiring while improving quality and candidate experience.
What’s Good About This Dashboard
- Surfaces time-to-fill and time-to-hire metrics, enabling executives to monitor speed of recruitment against benchmarks.
- Shows funnel progression and attrition points, clarifying where candidate drop-offs occur.
- Highlights sourcing channel effectiveness, guiding investment toward high-yield pipelines.
- Tracks offer acceptance and rejection reasons, providing insight into employer brand strength and market competitiveness.
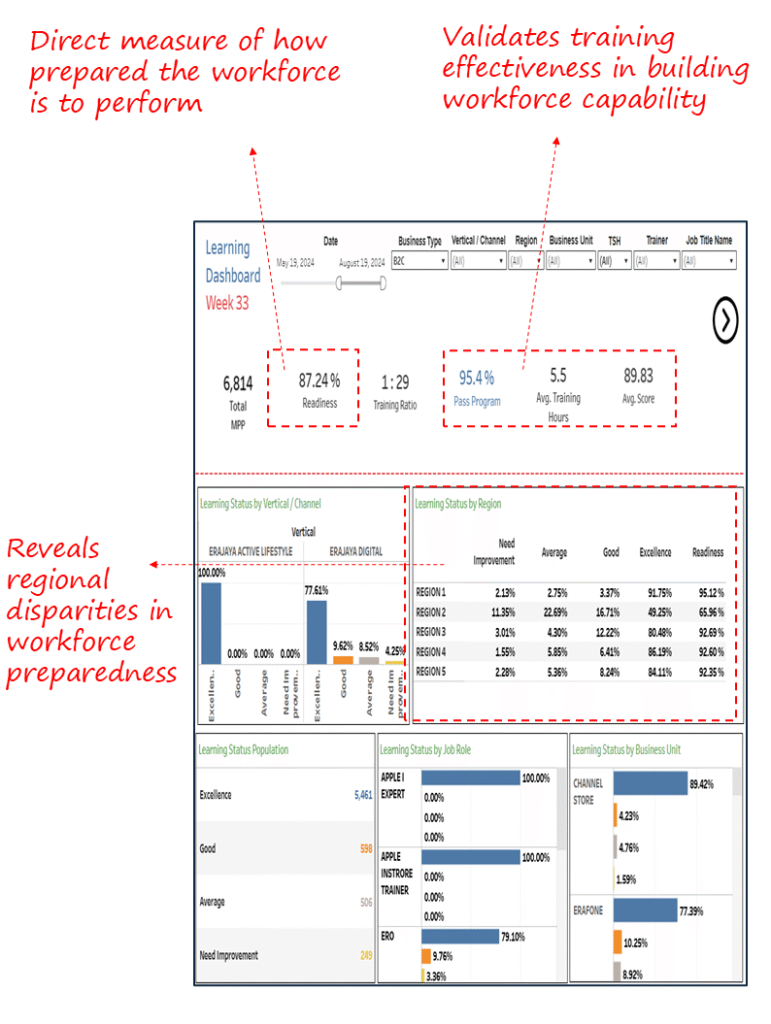
6.Learning & Development Dashboard
Industry Fit
Applicable across industries that depend on continuous upskilling , technology, consulting, retail, and customer service , where workforce readiness directly impacts business execution.
Most Relevant For
CHROs, Chief Learning Officers, HR Business Partners, and Business Unit Leaders managing workforce capability and role readiness.
Objective
Provide executives visibility into training outcomes and workforce readiness by tracking program completion, pass rates, and role-based learning effectiveness.
What’s Good About This Dashboard
- Surfaces readiness index, pass rates, and average scores as leading indicators of workforce capability.
- Highlights learning completion trends by region, business unit, and role for targeted interventions.
- Quantifies time and effort spent in training (training ratio, hours) to assess return on learning investments.
- Provides early warning of capability gaps that could affect project delivery or customer service.
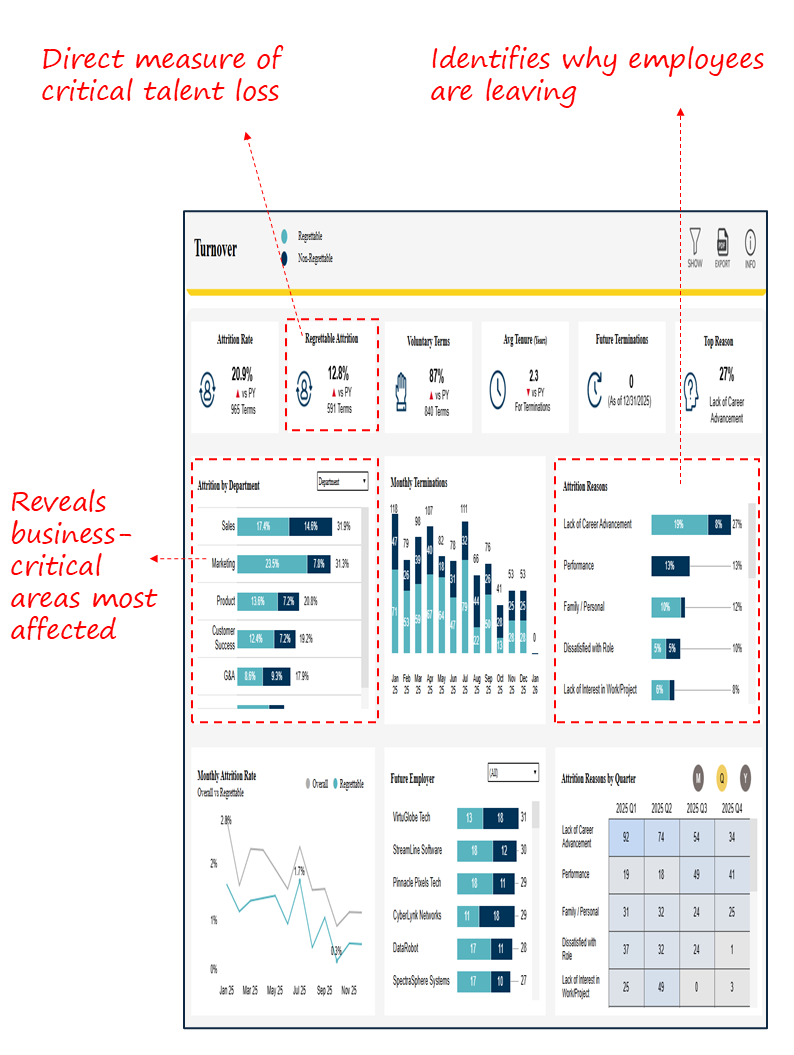
7.Turnover & Retention Risk Dashboard
Industry Fit
Cross-industry; vital for mid-to-large enterprises where talent retention impacts cost, customer delivery, and organizational stability.
Most Relevant For
CHROs, HR Business Partners, Business Unit Leaders, and C-suite executives monitoring workforce stability and retention risk.
Objective
Highlight workforce attrition patterns, who is leaving, why, and at what cost — to prioritize retention actions that protect capability and reduce turnover expense.
What’s Good About This Dashboard
- Differentiates regrettable vs. non-regrettable attrition, spotlighting loss of critical talent.
- Surfaces root causes of turnover (career advancement, performance, personal factors).
- Shows attrition trends by department and tenure, revealing organizational hotspots.
- Tracks future employers of leavers, giving executives visibility into competitive threats.

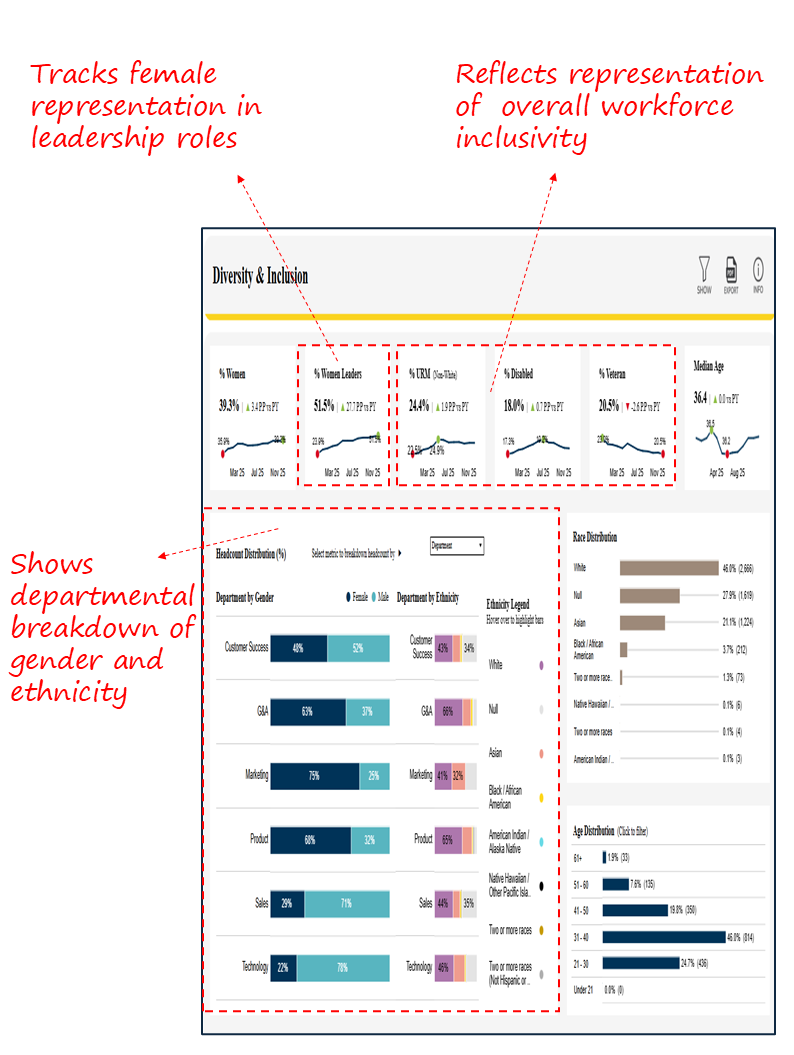
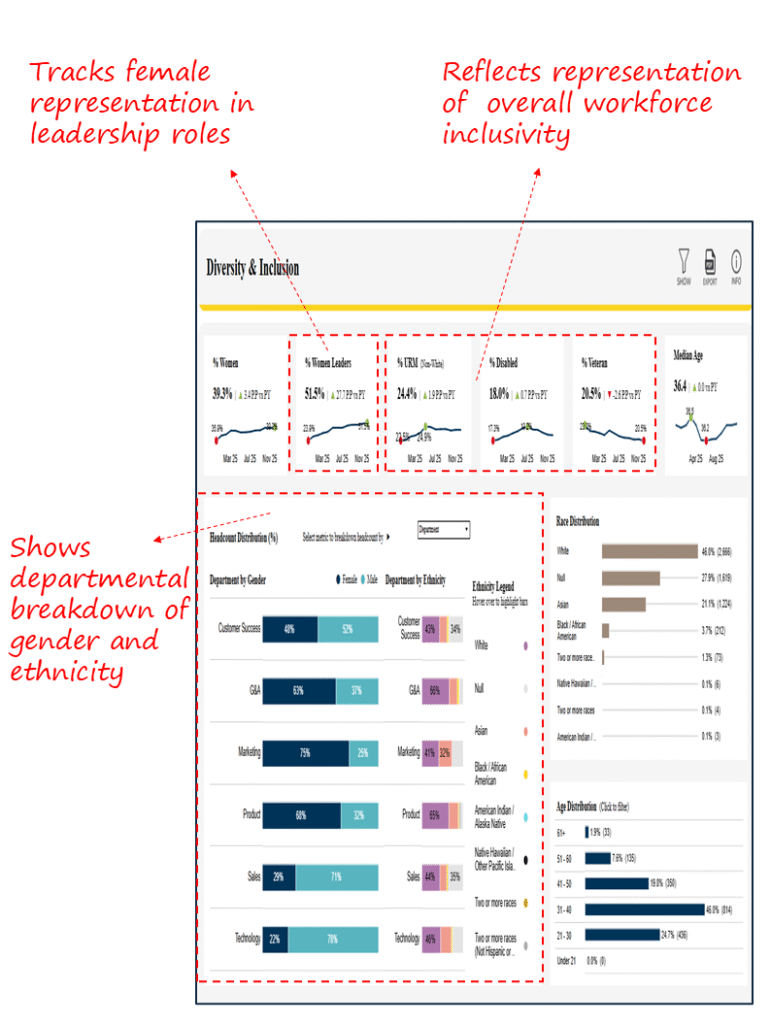
8.Diversity & Inclusion Dashboard
Industry Fit
Cross-industry; relevant for all organizations reporting on ESG, DEI, and workforce culture at the executive or board level.
Most Relevant For
CHROs, Chief Diversity Officers, HR Leaders, and C-suite executives accountable for inclusion, culture, and governance.
Objective
Track workforce diversity, equity, and inclusion across gender, ethnicity, age, and leadership representation to ensure alignment with organizational values and compliance expectations.
What’s Good About This Dashboard
- Puts executive-level DEI KPIs upfront (% women, % women leaders, % underrepresented minorities, % disabled, % veterans).
- Provides breakdown by department and function, showing where imbalances are most acute.
- Surfaces trends over time, enabling leaders to measure progress toward DEI goals.
- Aligns DEI outcomes with governance and ESG reporting requirements, critical for external stakeholders.
Closing Note
Human Resources is no longer a back-office function; it is a strategic lever that determines workforce resilience and organizational competitiveness. The eight dashboards highlighted in this article provide executives with a unified lens on the most critical people priorities: workforce scale, cost, performance, engagement, hiring, retention, capability readiness, and inclusion. By focusing on these high-impact metrics, leaders can move beyond anecdotal insights to make evidence-based decisions that protect talent, optimize resources, and strengthen culture. In doing so, HR dashboards become more than reporting tools, they become enablers of strategic workforce decisions at the boardroom table.
HR teams often rely on Tableau Consultants or hire Power BI consultants to integrate workforce planning, performance, and retention data into executive dashboards while maintaining role-based access and compliance.
Each month, we curate the latest updates, insights, and trends for senior leaders in data analytics and AI in our CXO Analytics Newsletter.
Our mission is “to enable businesses to unlock value in data.” For over 20 years, we’ve partnered with more than 100 clients—from Fortune 500 companies to mid-sized firms—to solve complex data analytics challenges. Our services include Advanced Analytics Consulting, Generative AI Consulting, and Business Intelligence (Tableau Consultants, Power BI Consultants and Looker Consultants) turning data into strategic insight. We would love to talk to you. Do reach out to us for a free consultation.