


Introduction
Driving operations at scale across projects, assets, vendors, and teams demands more than instinct and experience. Yet many leadership teams still operate with fragmented insights, outdated reports, and lagging performance signals.
This article curates ten high-impact dashboards designed for C-suite visibility across the operational stack. From backlog risks to downtime exposure, procurement control to SLA adherence, these executive-ready dashboards enable faster decision-making, tighter execution, and greater accountability.
Each dashboard is paired with concise annotations that spotlight the metrics that matter, so operations leaders can move from guesswork to actionable insight.
| # | Dashboard | Operations Lever | Key Value |
| 1 | Personnel Utilization | Workforce planning & labor optimization | Tracks utilization by employee, product, and line to cut idle time and boost productivity |
| 2 | Supply Chain Risk Assessment | Supplier risk & continuity | Maps supplier risk globally; integrates likelihood vs. impact for resilience planning |
| 3 | Project Proposal Details | Bid management & proposal efficiency | Win–loss tracking, market-level bid analysis, and proposal diagnostics |
| 4 | Project & Resource Management | Capacity planning & delivery | Balances workload vs. SLA; connects analyst demand to contract fulfilment |
| 5 | Pharma Production | Throughput & quality monitoring | Compares produced vs. target doses, flags quality issues, and tracks plant-level output |
| 6 | Inventory Management | Stock optimization & demand match | Highlights overstock, stockouts, turnover, and sales vs. stock trends |
| 7 | Maintenance Tracker | Downtime prevention | Pinpoints root causes of production delays; heatmaps for error hotspots |
| 8 | Backlog Management | Load balancing & revenue risk | Compares current vs. prior backlog; flags risks by manager, project, and city |
| 9 | Quality Control (Product & Location) | Defect reduction | Tracks pass rates, defect causes, and underperforming plants/lines |
| 10 | SLA Adherence | Service reliability | Flags SLA breaches by process; highlights failure reasons for corrective action |
| 11 | Consumer Duty & Product Approval | Compliance & lifecycle governance | Tracks QA approvals, abandonment, and overdue compliance risks |
| 12 | Procurement Cockpit | Supplier performance & spend control | Monitors cost avoidance, contract risk, buyer performance, and supplier concentration |
| 13 | Cost Centre Efficiency & Profitability | Financial control & shared service optimization | Benchmarks unit costs, margins, and cost-to-serve variance across functions |
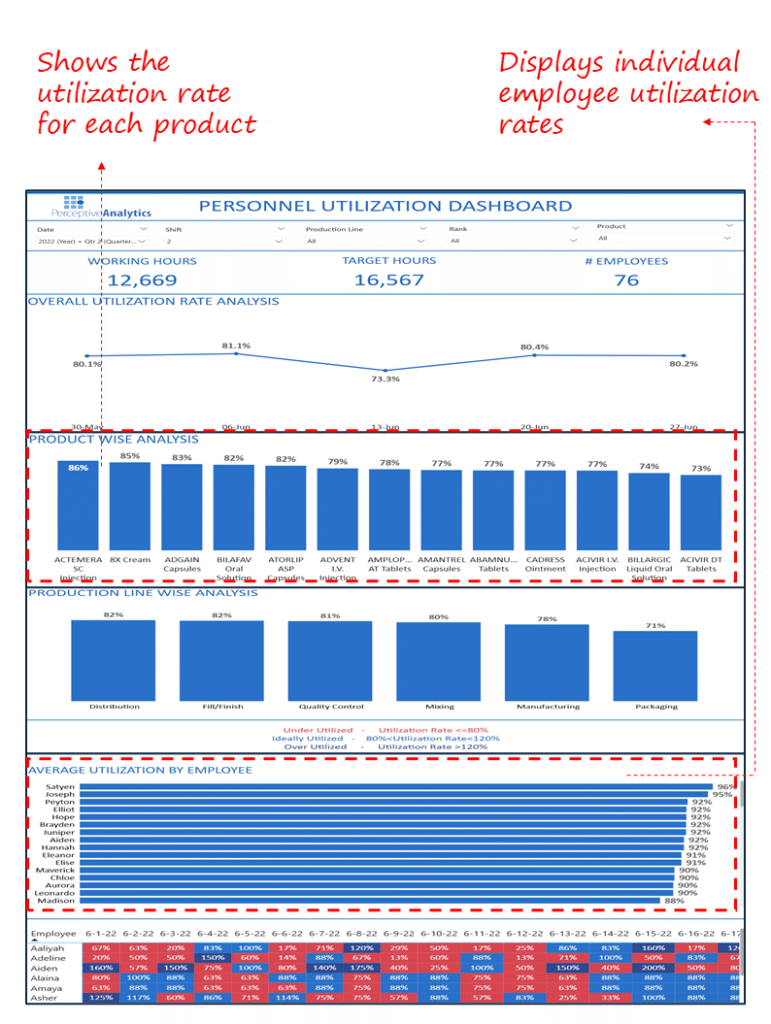
1. Personnel Utilization Dashboard
- Source: Perceptive Analytics
- Operations Lever: Workforce Planning & Labor Optimization
- Industry Fit: Pharmaceuticals, Healthcare Manufacturing, or High-Compliance Assembly Operations
- Relevance For: Plant Managers, Operations Heads, Workforce Optimization Leads
Objective
Monitor personnel utilization across shifts, products, and lines to identify labour bottlenecks, reduce idle time, and improve productivity.
What’s Good About This Dashboard
- Breaks down utilization by employee, product, and production line enabling granular intervention.
- Provides clear benchmarks for under, ideal, and over-utilization zones.
- Tracks daily workforce output vs. target hours, helping align labour planning with demand.
- Enables comparative performance analysis across employees, highlighting outliers and training needs.
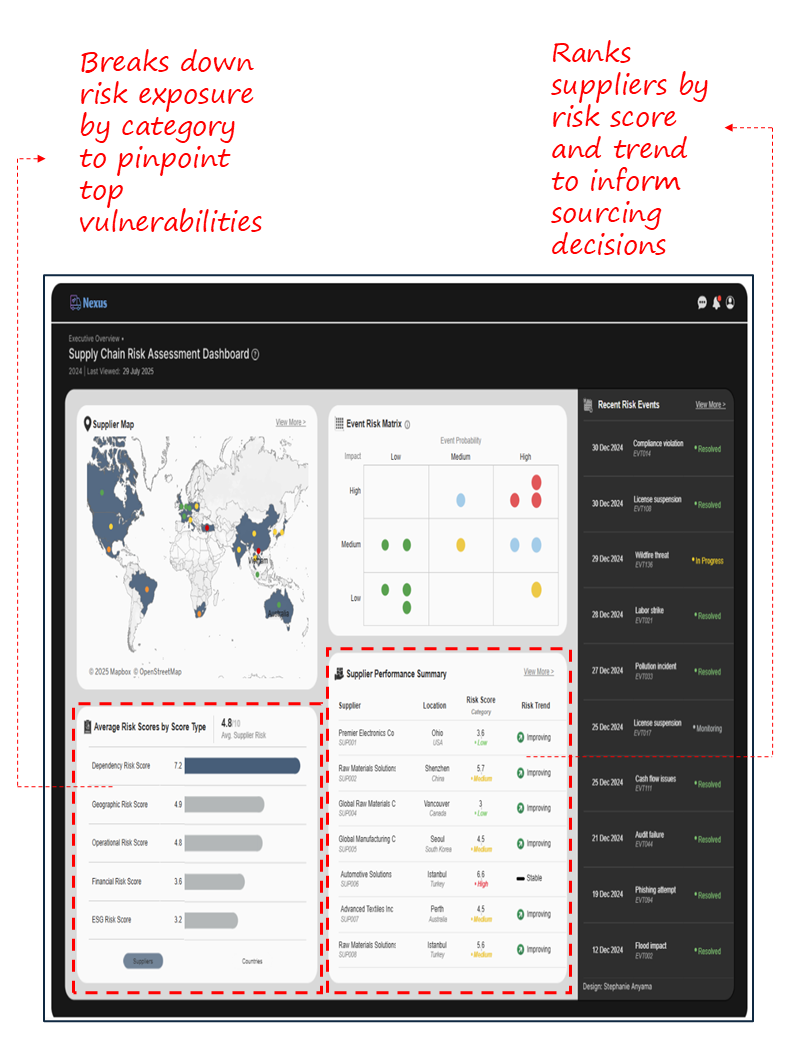
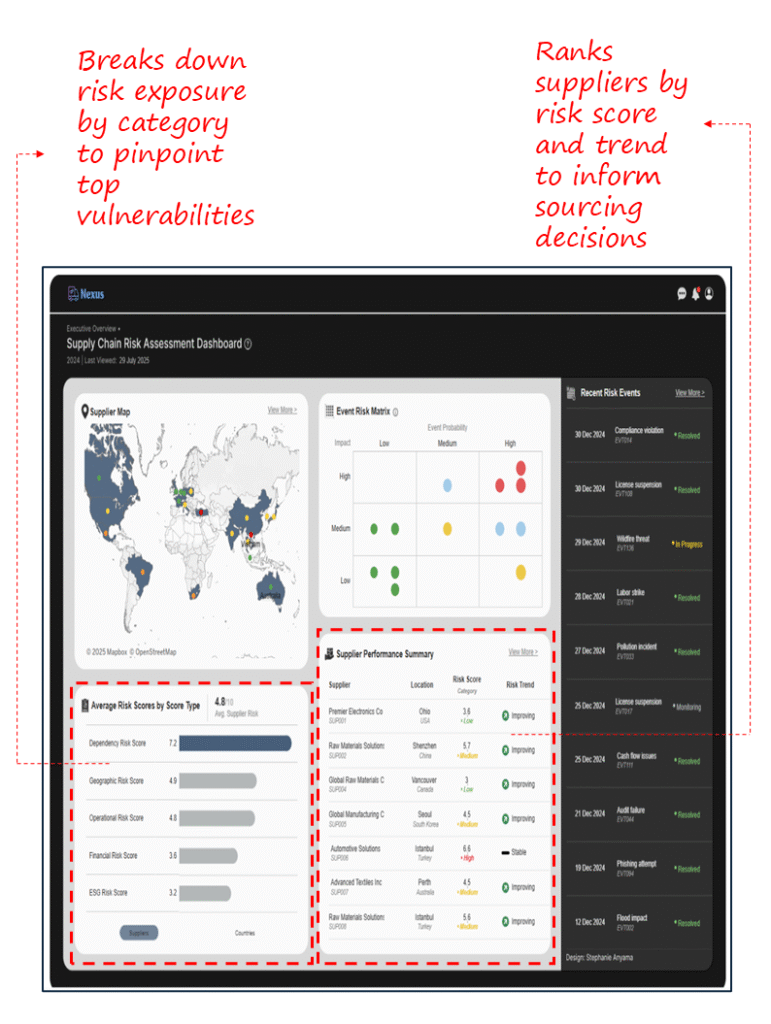
2. Supply Chain Risk Assessment Dashboard
- Source: Tableau Public
- Operations Lever: Supplier Risk Management & Continuity Planning
- Industry Fit: Manufacturing, Electronics, Automotive, Pharma with global sourcing footprint
- Relevance For: Chief Operating Officer (COO), Chief Procurement Officer (CPO), Global Sourcing Heads
Objective
Monitor risk exposure across global suppliers to mitigate operational disruptions and improve sourcing resilience.
What’s Good About This Dashboard
- Uses a geospatial supplier map to visualize global risk concentration.
- Integrates a risk matrix for assessing event likelihood vs. impact supports rapid prioritization.
- Breaks down supplier risk by category (dependency, geographic, ESG, financial).
- Provides supplier-level performance trends, enabling targeted mitigation efforts.
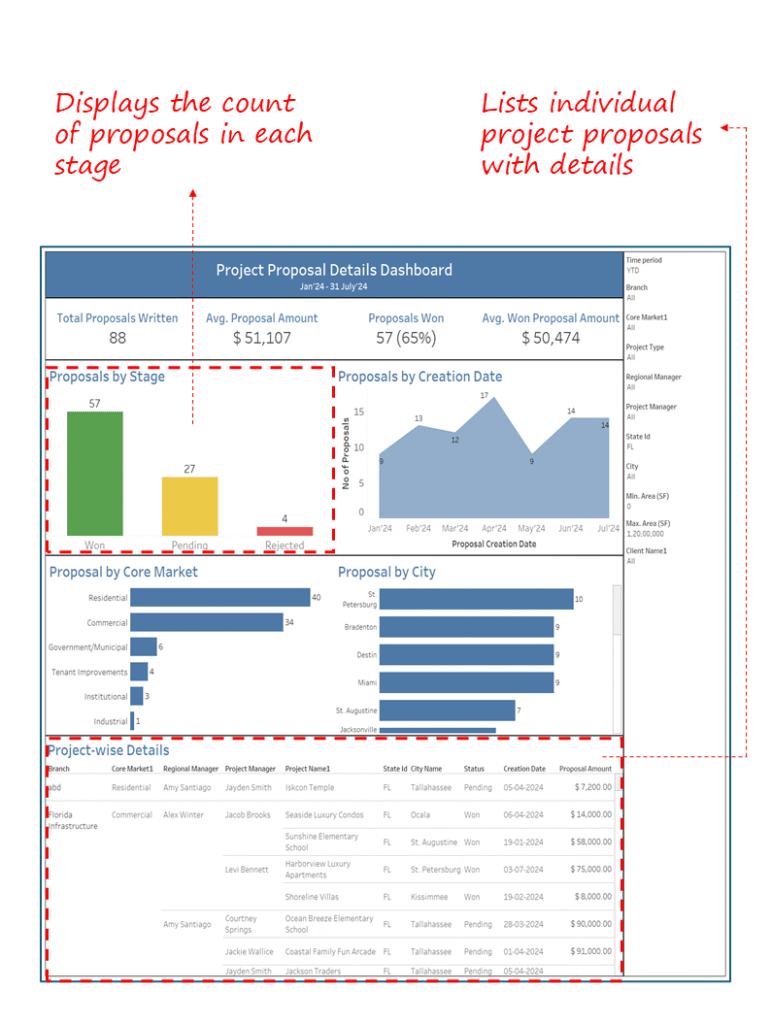
3. Project Proposal Details Dashboard
- Source: Perceptive Analytics
- Operations Lever: Bid Management & Proposal Efficiency
- Industry Fit: Engineering, Construction, Real Estate Development
- Relevance For: Business Development Head, Project Operations Manager, Regional Director
Objective
Track proposal wins rates, bid volume, and market-level performance to optimize project acquisition strategies.
What’s Good About This Dashboard
- Displays win-loss trends and average proposal values to guide pricing and pursuit strategies.
- Breaks down proposal activity by market and region, aiding salesforce alignment.
- Includes project-level detail view, enabling quick diagnostics of stalled or rejected bids.
- Filters by city, project type, branch, and manager support regional performance comparisons.
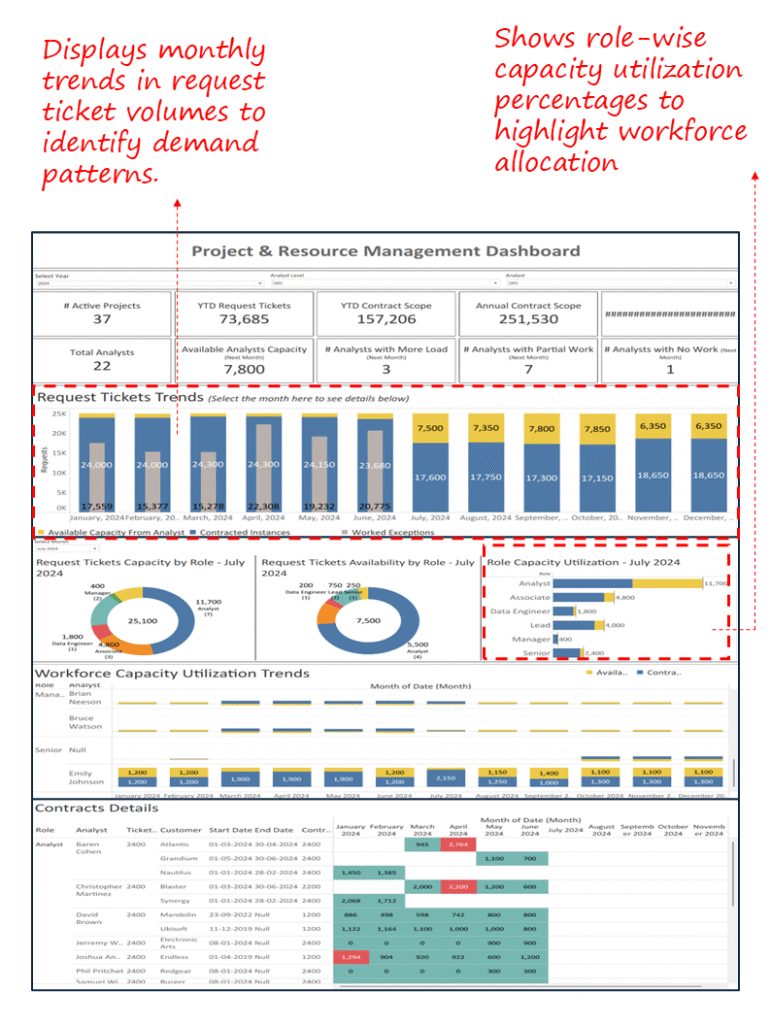
4. Project & Resource Management Dashboard
- Source: Perceptive Analytics
- Operations Lever: Capacity Planning & Contract Fulfilment
- Industry Fit: IT Services, Consulting, Analytics Outsourcing
- Relevance For: Delivery Manager, Resource Planning Lead, Client Success Director
Objective
Balance analyst workload, project fulfilment, and contractual obligations to prevent overruns and delivery gaps.
What’s Good About This Dashboard
- Tracks request tickets vs. analyst capacity by role and month for proactive workload balancing.
- Highlights exceptions and over-allocations, helping prevent SLA breaches.
- Enables contract-level traceability, connecting resource demand to fulfilment outcomes.
- Provides individual-level capacity trends, supporting performance reviews and staffing plans.
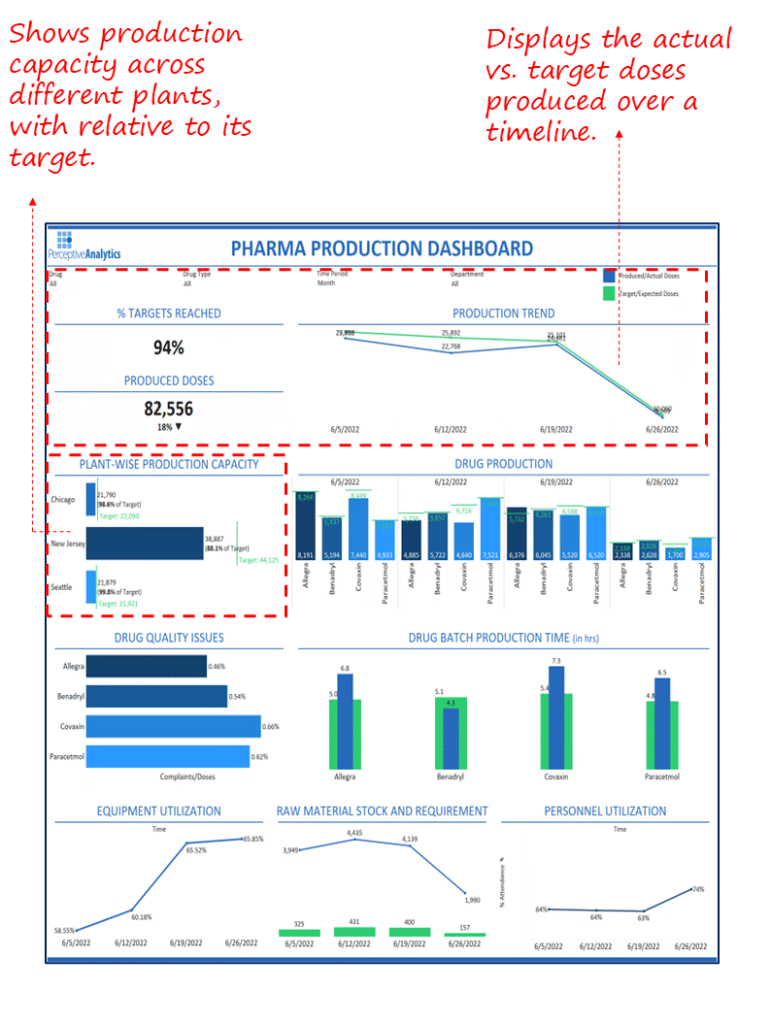
5. Pharma Production Dashboard
- Source: Perceptive Analytics
- Operations Lever: Production Throughput & Quality Monitoring
- Industry Fit: Pharmaceutical Manufacturing, Healthcare Supply
- Relevance For: Plant Manager, Quality Head, Operations Director
Objective:
Ensure consistent drug output across plants while monitoring batch quality, equipment usage, and workforce allocation.
What’s Good About This Dashboard
- Compares produced vs. target doses across time and facilities to track fulfilment.
- Flags drug-wise quality complaints and batch production times for quality control.
- Tracks equipment and personnel utilization to optimize daily production ops.
- Displays plant-level performance to uncover capacity bottlenecks or execution gaps.
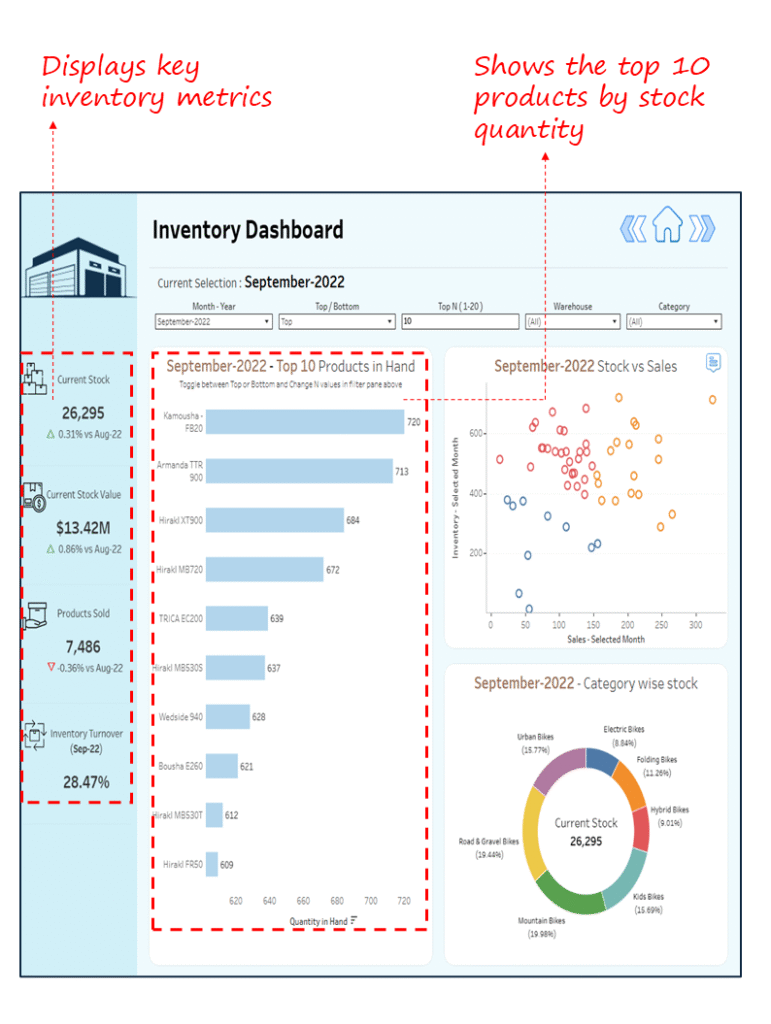
6. Inventory Management Dashboard
- Source: Tableau Public
- Operations Lever: Inventory Optimization & Demand Matching
- Industry Fit: Manufacturing, Retail, Distribution
- Relevance For: Warehouse Manager, Inventory Planner, Operations Head
Objective
Monitor inventory levels, product velocity, and stock alignment to sales trends to reduce holding costs and avoid stockouts.
What’s Good About This Dashboard
- Flags top 10 products in hand to spotlight overstock risks or aging inventory.
- Plots stock vs. sales correlation to assess inventory efficiency across SKUs.
- Displays category-wise stock distribution for warehouse load balancing.
- Tracks inventory turnover and changes in stock value/sales versus prior month for trend-based control.
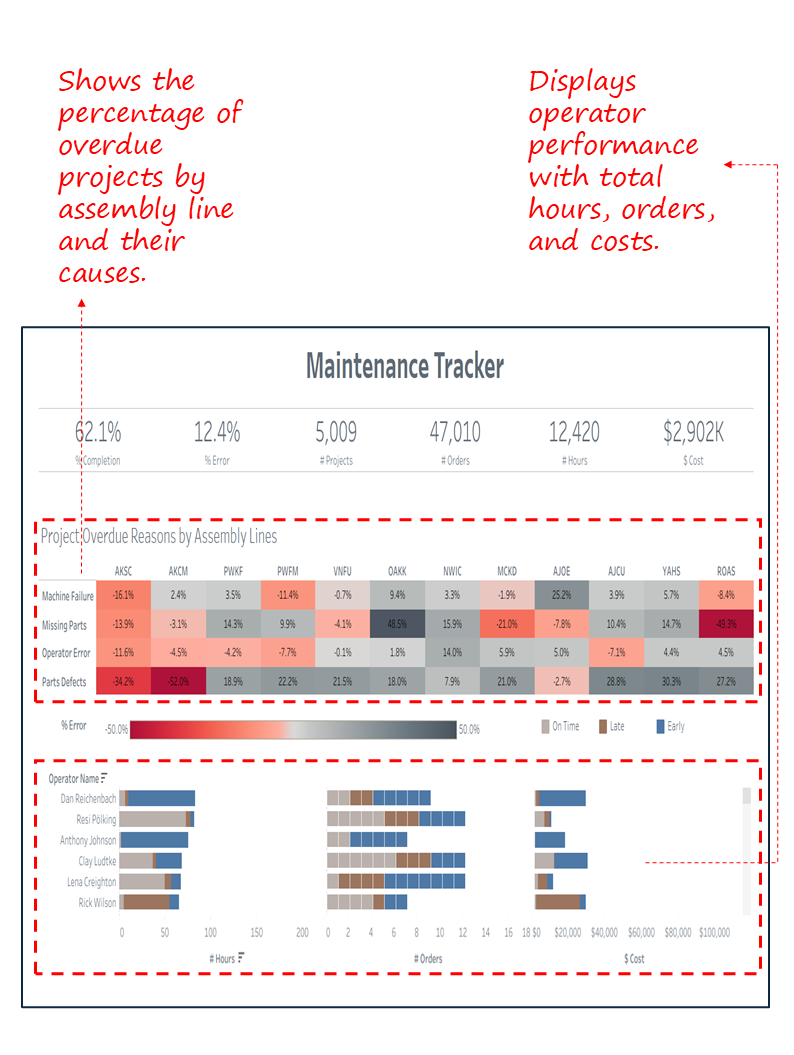
7. Maintenance Tracker Dashboard
- Source: Tableau Public
- Operations Lever: Maintenance Efficiency & Downtime Prevention
- Industry Fit: Manufacturing, Automotive, Industrial Equipment
- Relevance For: Maintenance Head, Plant Manager, Continuous Improvement Leader
Objective
Identify and reduce delays in production due to equipment failure, part defects, and operator-related errors across assembly lines.
What’s Good About This Dashboard
- Pinpoints root causes of project delays by assembly line (e.g., machine failure, parts defects).
- Highlights top error contributors by operator for performance coaching or retraining.
- Visualizes cost, time, and order volume distribution across early, on-time, and late completions.
- Enables heatmap analysis of error hotspots to prioritize corrective actions.
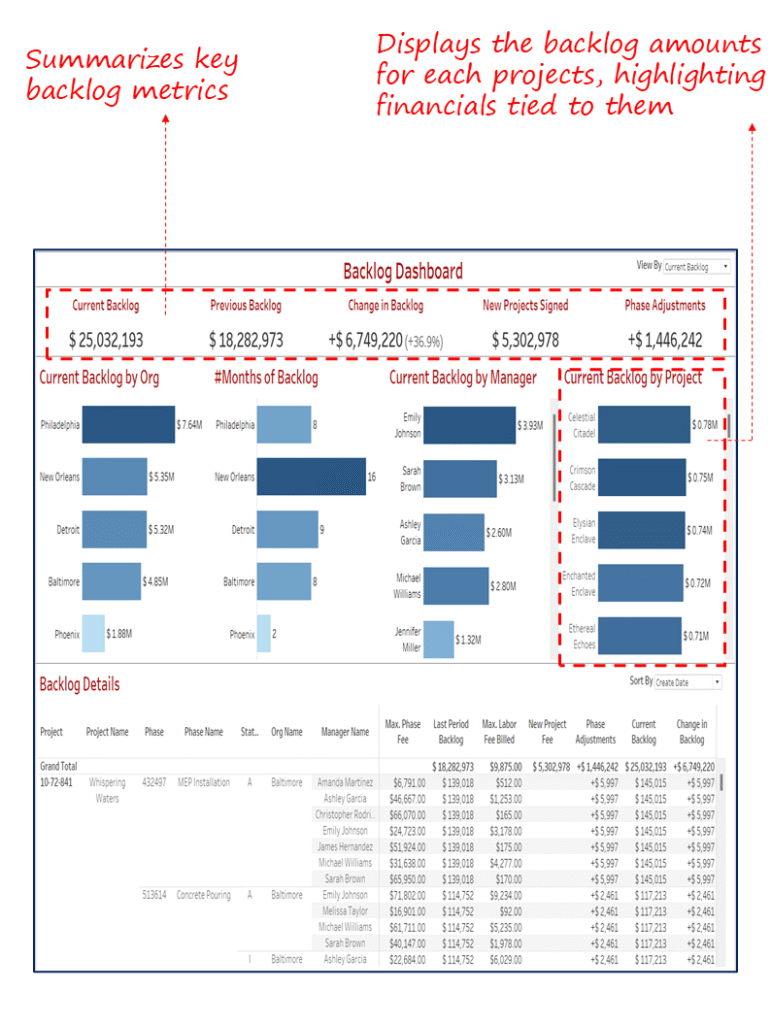
8. Backlog Management Dashboard
- Source: Perceptive Analytics
- Operations Lever: Project Load Balancing & Revenue Pipeline Management
- Industry Fit: Construction, Engineering, Public Infrastructure
- Relevance For: Regional Director, Project Controller, Program Manager
Objective
Track backlog accumulation across cities, managers, and projects to assess execution capacity, manage resource allocation, and forecast revenue risks.
What’s Good About This Dashboard
- Compares current vs. previous backlog with variance and percentage shift for momentum tracking.
- Flags backlog by manager and project to enable workload balancing and accountability.
- Provides detailed backlog components including new projects, phase adjustments, and billing.
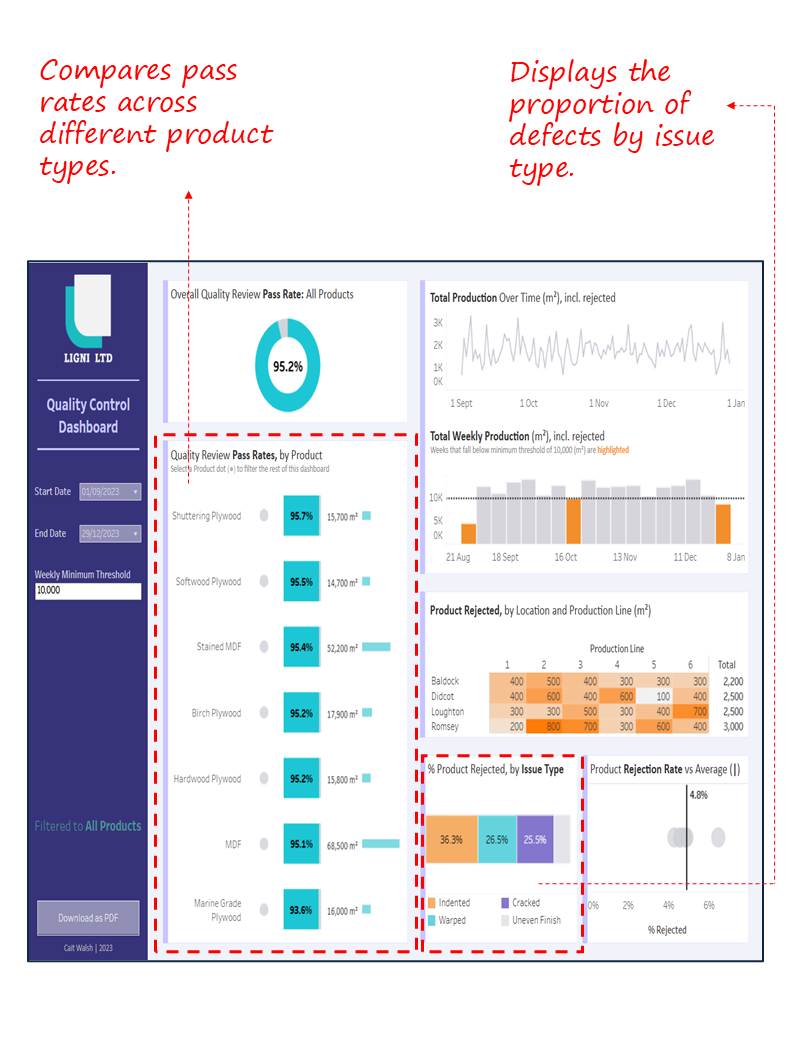
9. Quality Control by Product & Location Dashboard
- Source: Tableau Public
- Operations Lever: Defect Reduction & Production Line Efficiency
- Industry Fit: Manufacturing, Wood & Materials Processing, Furniture
- Relevance For: Plant Manager, Quality Assurance Lead, Production Head
Objective
Monitor pass rates, rejection causes, and production gaps across products, plants, and lines to drive quality improvements and reduce material wastage.
What’s Good About This Dashboard
- Shows product-wise pass rates with volume to align quality with throughput.
- Highlights locations and lines with high rejection to prioritize interventions.
- Breaks down rejection by defect type for targeted quality action.
- Flags weekly output below threshold to identify underperforming periods.

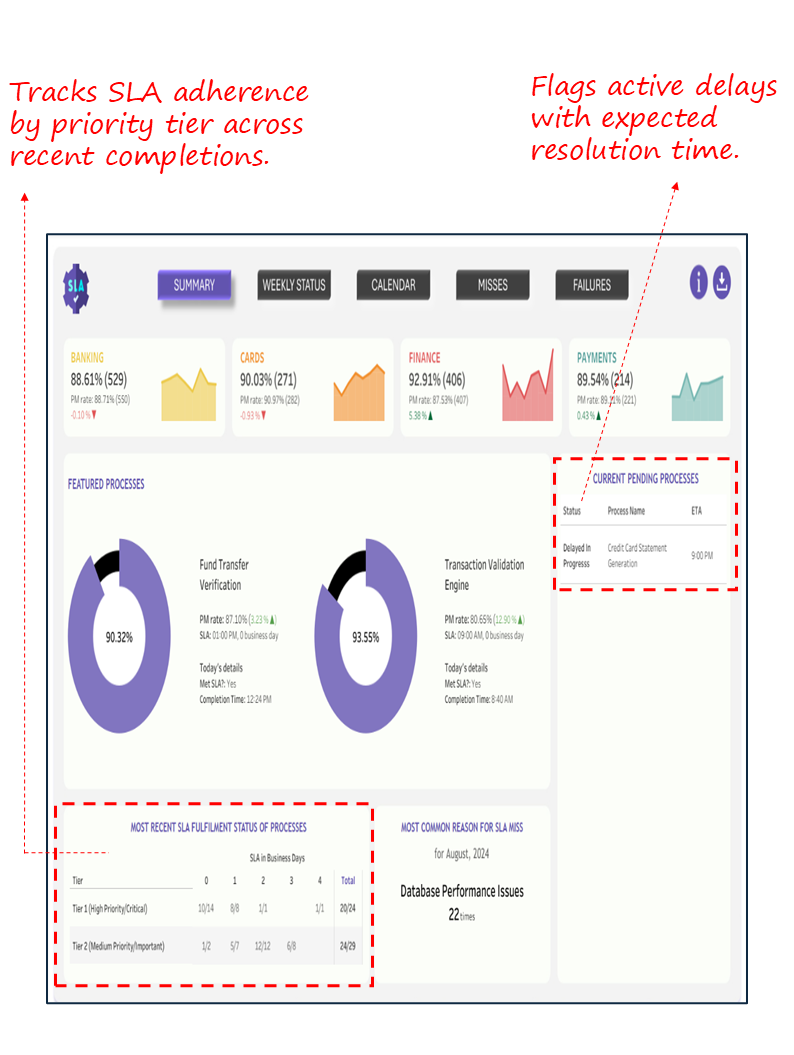
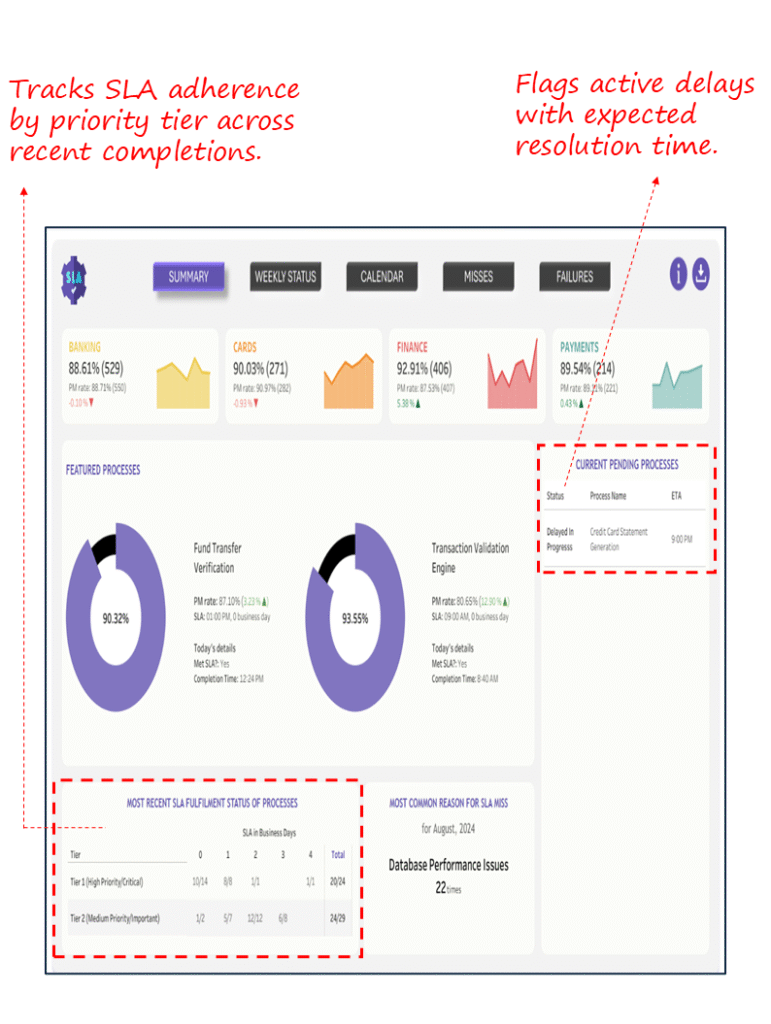
10. SLA Adherence Dashboard
- Source: Tableau Public
- Operations Lever: Service Reliability & Timeliness
- Industry Fit: Banking, BPO, IT Services, Shared Service Centres
- Relevance For: Service Delivery Manager, IT Ops Head, Process Excellence Lead
Objective
Track service level adherence across processes and departments to ensure time-bound delivery, reduce SLA breaches, and identify failure root causes.
What’s Good About This Dashboard
- Summarizes SLA fulfilment by tier, enabling prioritization of high-risk delays.
- Flags most common failure reason (e.g., database performance) for root cause correction.
- Tracks process-level adherence with SLA thresholds and real-time status.
- Highlights pending/delayed processes for immediate escalation.
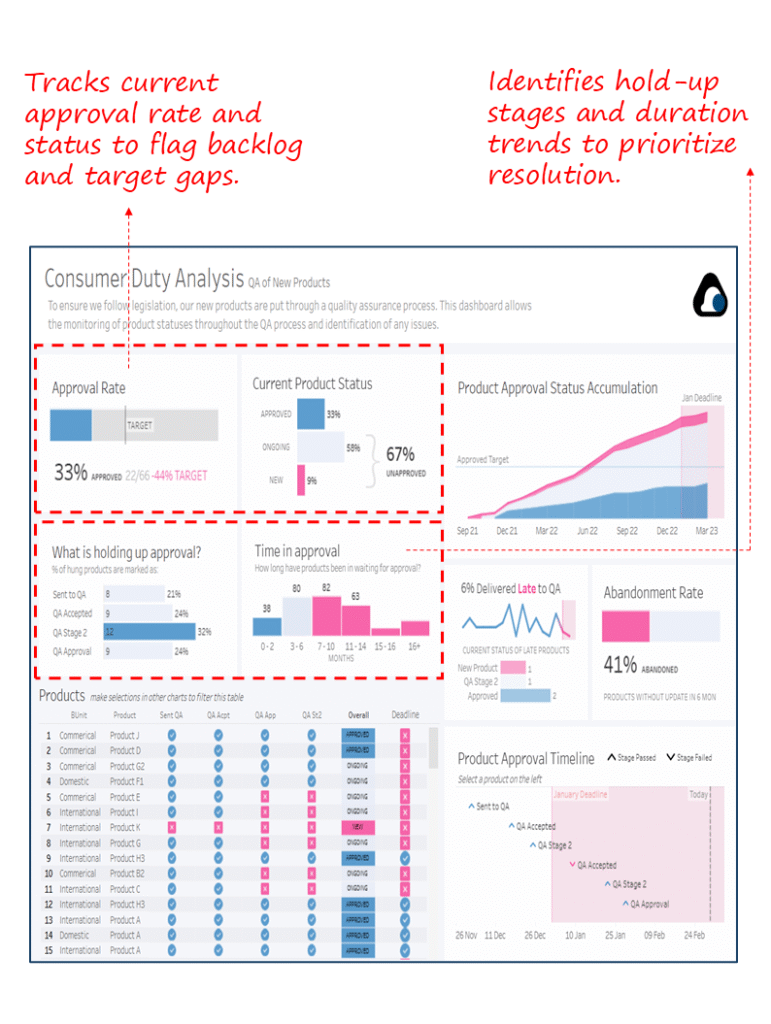
11. Consumer Duty & Product Approval Dashboard
- Source: Tableau Public
- Operations Lever: Product Lifecycle Governance
- Industry Fit: Financial Services, Insurance, Regulated Manufacturing
- Relevance For: Product Governance Lead, Risk & Compliance Head, QA Manager
Objective:
Monitor QA status, approval bottlenecks, and abandonment trends of new product launches to meet compliance deadlines and avoid regulatory slippage.
What’s Good About This Dashboard
- Tracks approval rate vs. target and flags systemic delays in multi-stage QA processes.
- Surfaces high-risk lag by visualizing time-in-stage and abandonment rate (>40%).
- Enables granular investigation through product-level stage status and historical timeline.
- Aligns with regulatory oversight by highlighting overdue approvals and delivery breaches.
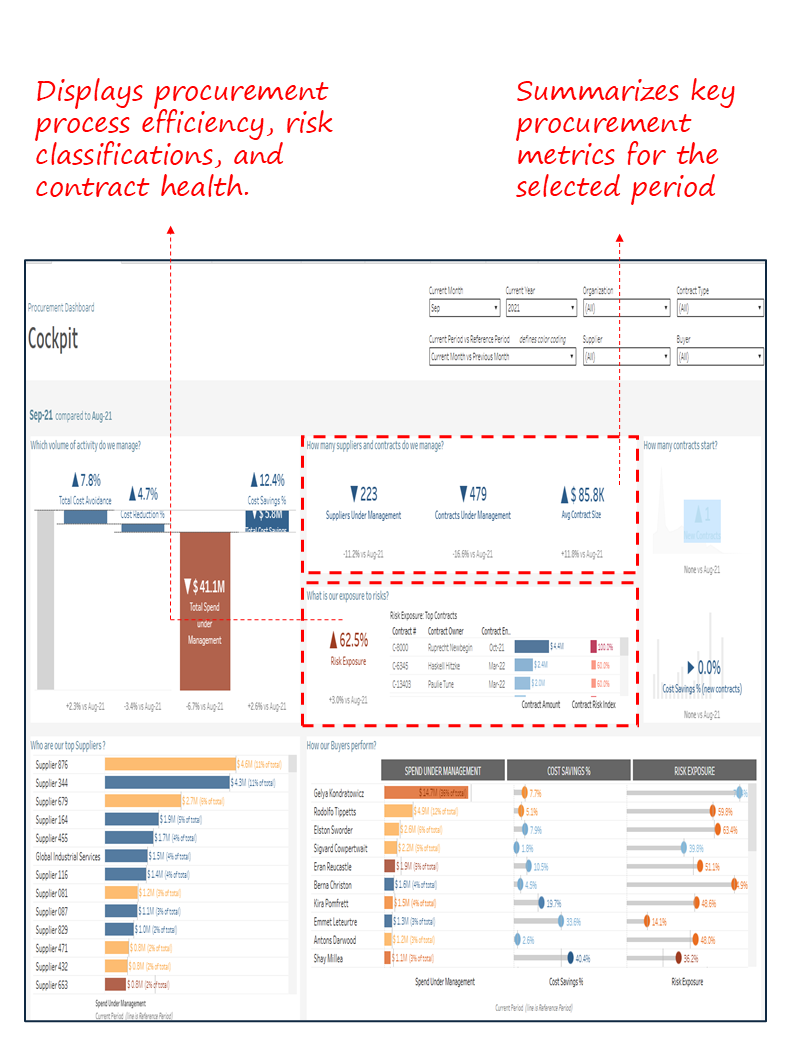
12. Procurement Cockpit Dashboard
- Source: Tableau Public
- Operations Lever: Procurement Oversight & Supplier Risk Management
- Industry Fit: Manufacturing, Pharma, Retail, Construction
- Relevance For: Chief Procurement Officer (CPO), Sourcing Head, Category Manager
Objective
Enable visibility into procurement health, contract exposure, supplier value contribution, and buyer performance to reduce cost and manage supplier risk.
What’s Good About This Dashboard
- Quantifies total cost avoidance and savings % vs. prior period, offering control levers on procurement performance.
- Monitors supplier concentration and risk exposure by contract, buyer, and spend category.
- Flags underperforming buyers via comparative benchmarking on cost savings and risk impact.
- Integrates contract risk index and value for top contracts to prioritize renegotiation.

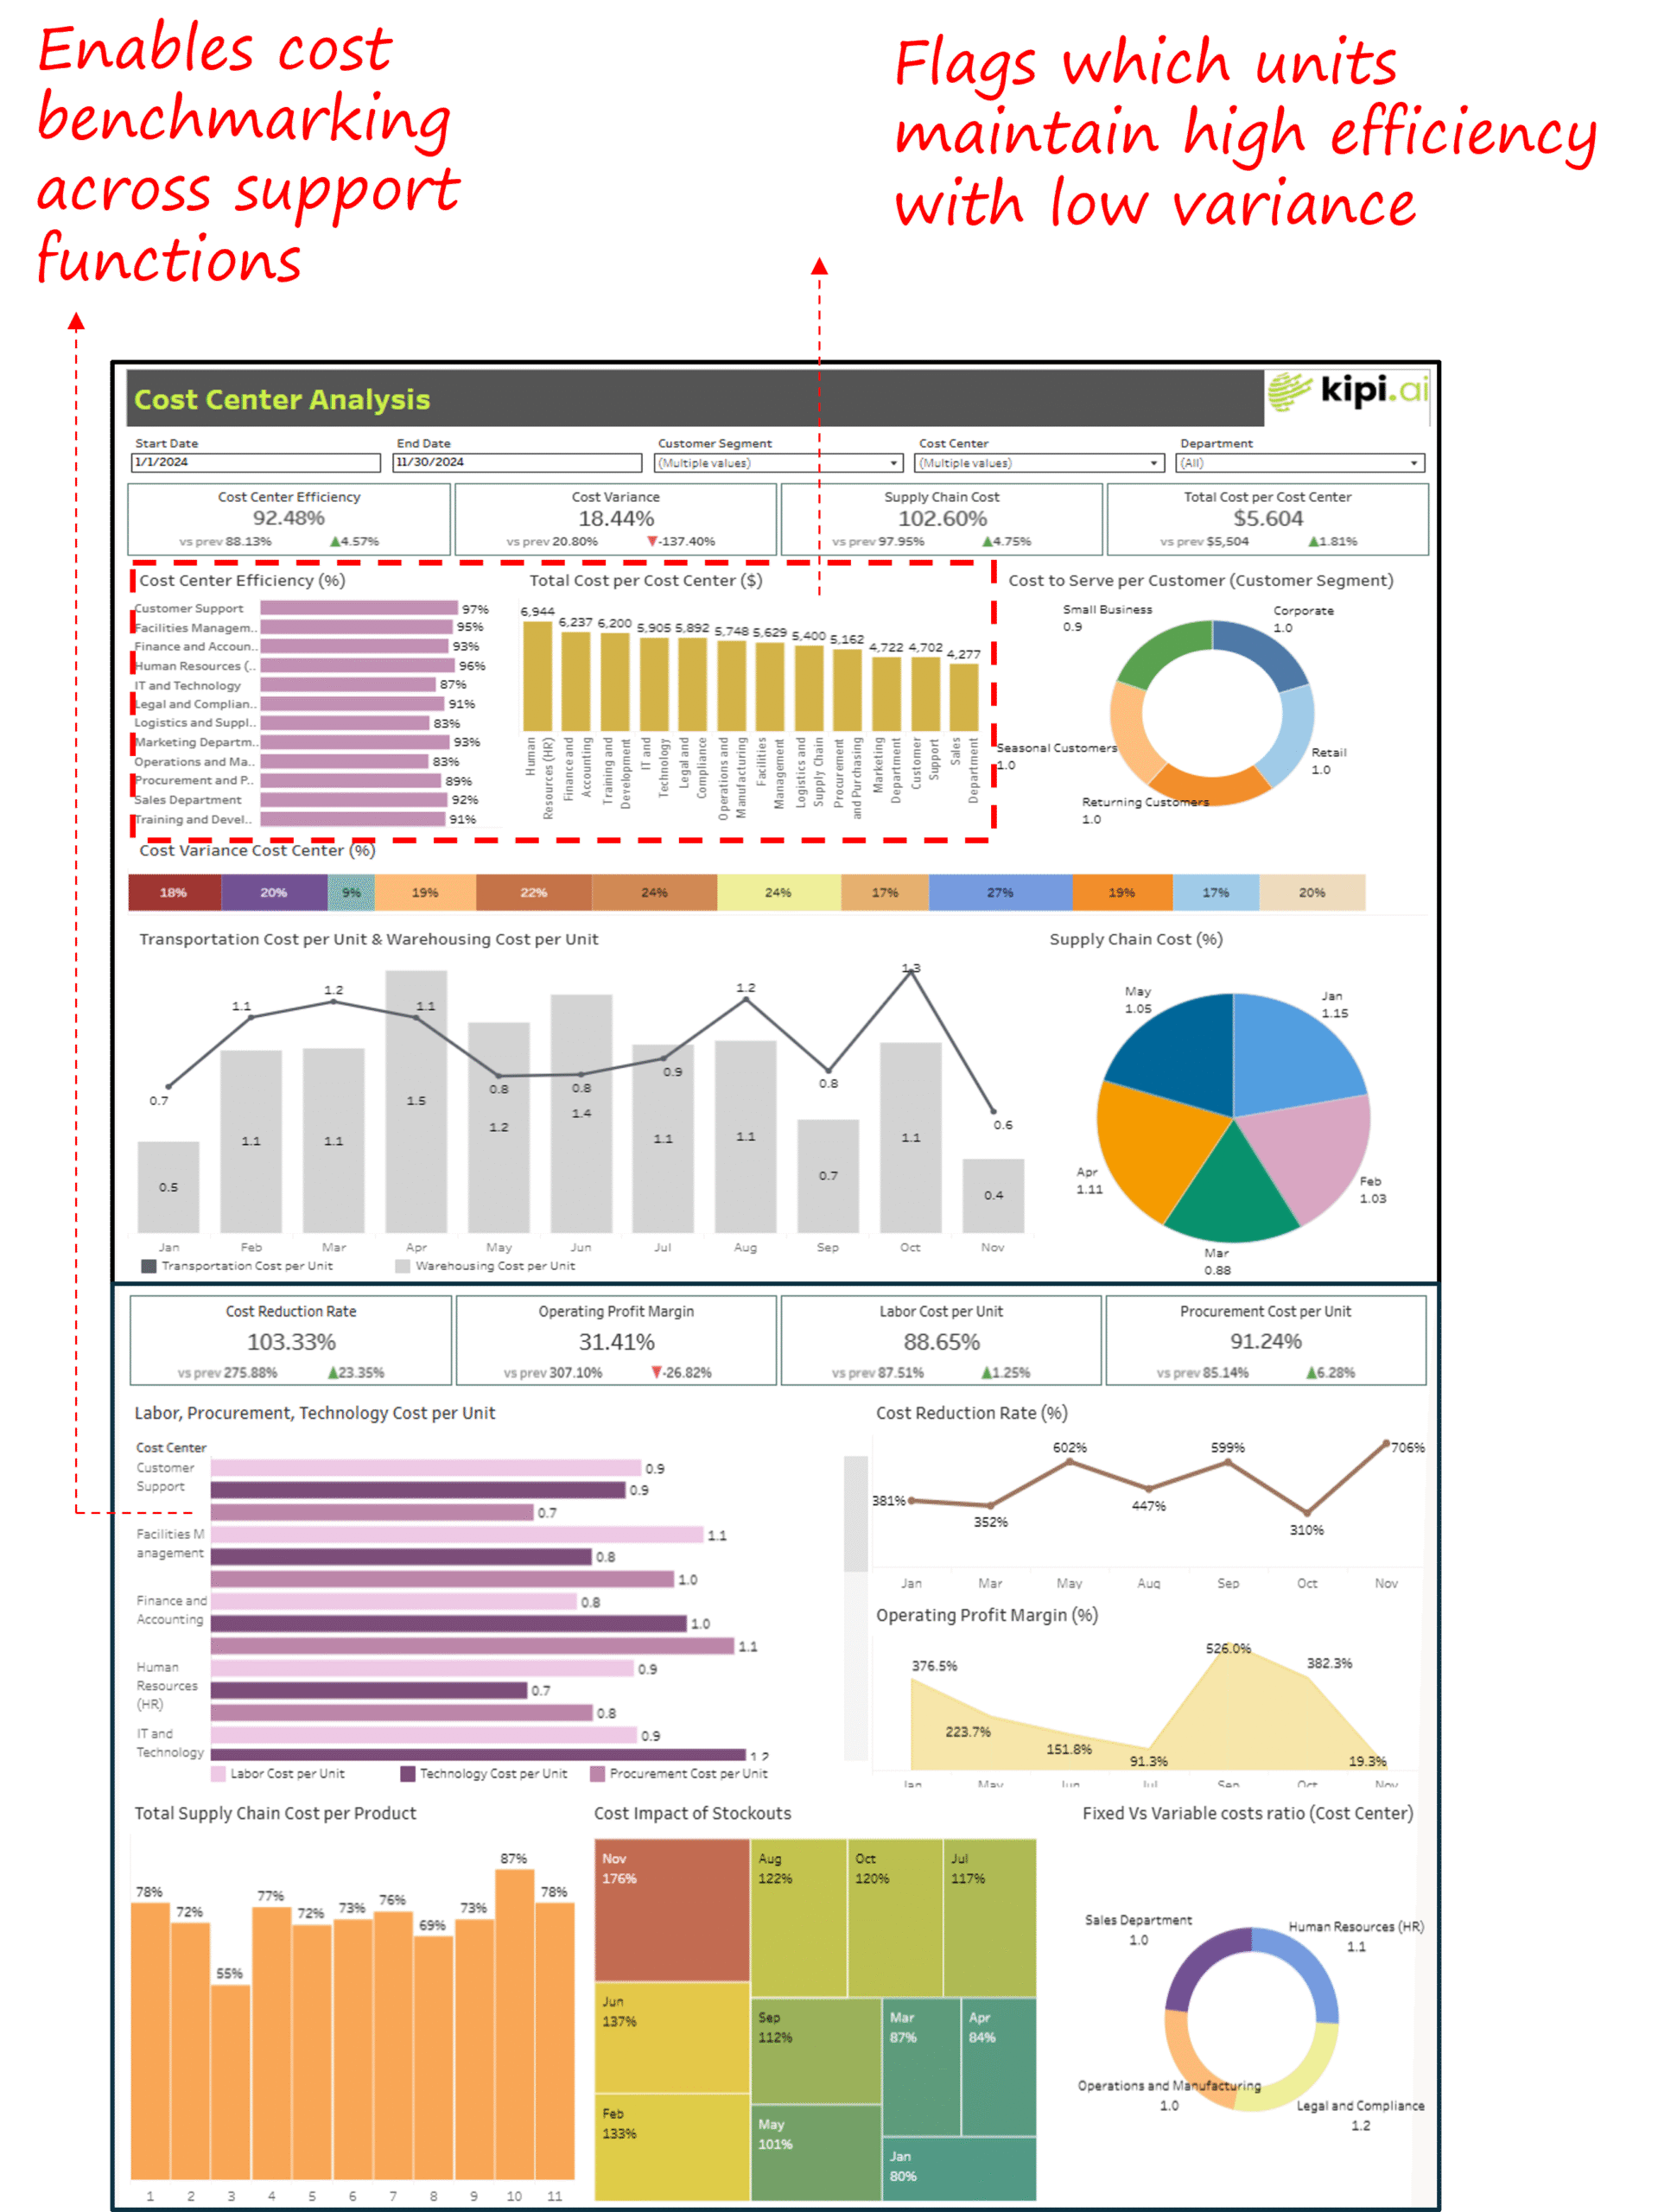
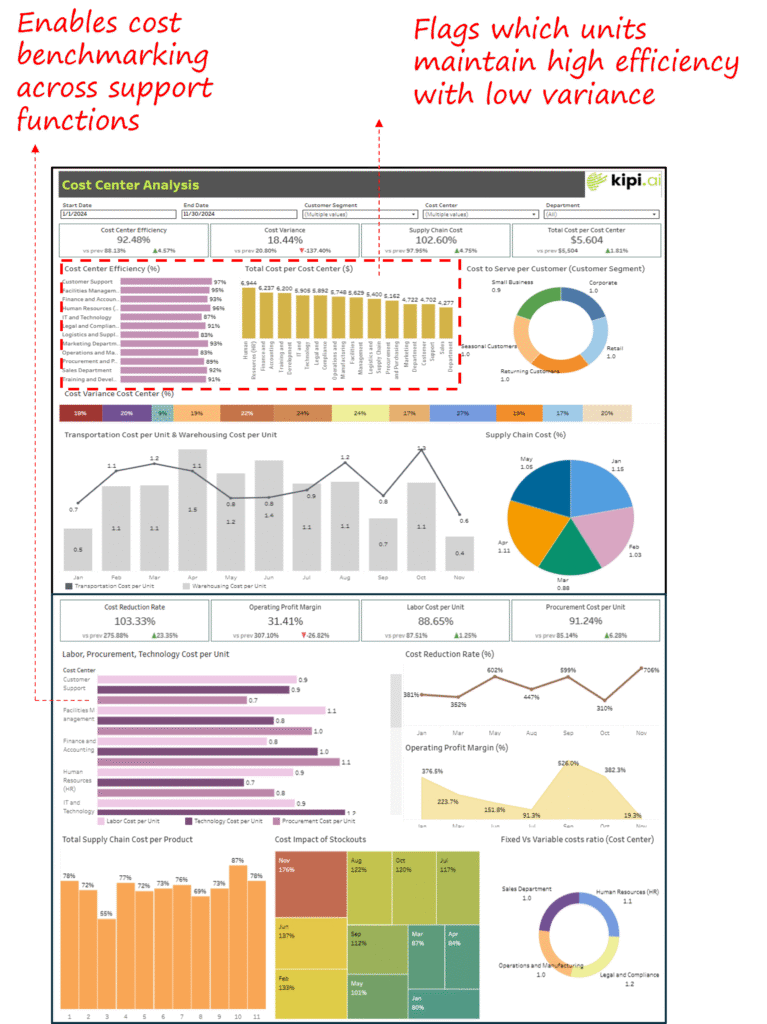
13. Cost Centre Efficiency and Profitability Dashboard
- Source: Tableau Public
- Industry Fit: Cross-industry (especially relevant for shared service-heavy enterprises in manufacturing, pharma, and BFSI)
- Relevance For: Heads of Operations, Shared Services, Cost Controllers, Strategy Teams
Objective: Track cost efficiency, variance, and profit margins across functional cost centres to drive continuous improvement and cost control
What’s Good About This Dashboard:
- Combines efficiency, cost, and margin metrics in one view for both operational and financial clarity
- Allows direct comparison of cost centres (HR, Finance, IT, Procurement, etc.) using multiple unit cost and efficiency measures
- Exposes outliers in stockouts, transportation inefficiencies, and cost-to-serve variance by customer segment
- Enables faster decisions on where to tighten cost or restructure internal service delivery
Closing Note
In today’s complex and fast-moving operational landscape, world-class execution is defined not just by experience, but by the quality of insight and speed of actionable intelligence. The dashboards curated here empower C-suite leaders and operational executives to move decisively, driving efficiencies, managing risks, and aligning resources for maximum value across the enterprise.
By embracing a portfolio that now spans personnel utilization, supply chain resilience, financial performance, project health, and beyond, organizations can break out of siloed reporting and shift to a single, executive-ready view of operations. As you implement these dashboards, you will equip your teams–from the boardroom to the shop floor–with the clarity and control needed to outperform in today’s era of intelligent operations.
The path to operational excellence begins with visibility. The future belongs to those who turn data into decisive action.
Operations teams commonly work with Tableau Consultants or hire Power BI consultants to build dashboards that integrate ERP, production, and logistics data, ensuring efficiency, scalability, and secure access across all levels.
Each month, we curate the latest updates, insights, and trends for senior leaders in data analytics and AI in our CXO Analytics Newsletter.
Our mission is “to enable businesses to unlock value in data.” For over 20 years, we’ve partnered with more than 100 clients—from Fortune 500 companies to mid-sized firms—to solve complex data analytics challenges. Our services include Advanced Analytics Consulting, Generative AI Consulting, and Business Intelligence (Tableau Consultants, Power BI Consultants and Looker Consultants) turning data into strategic insight. We would love to talk to you. Do reach out to us for a free consultation.