


In many organizations, dashboards are shared across multiple teams, departments, or regions. While it’s useful to keep everything in one place, not every user should see every piece of data.
- A regional sales manager, for instance, would be interested in seeing sales for their own region.
- A team lead should see only their team’s performance, not the other teams.
Showing all data to everyone not only creates information overload but can also raise privacy and compliance concerns. That’s where Row-Level Security (RLS) comes in.
What is Row-Level Security?
Row-Level Security is a method of restricting data at the row level so that each user sees only the information/rows relevant to them. Instead of creating multiple dashboards for different audiences, one dashboard can serve all users—while dynamically tailoring the view to their access rights.
This makes dashboards:
- Secure – Users only see the data they’re meant to.
- Relevant – Each person gets insights tied to their role or region.
- Efficient – A single dashboard can serve many audiences without duplication.
Let’s understand through an example
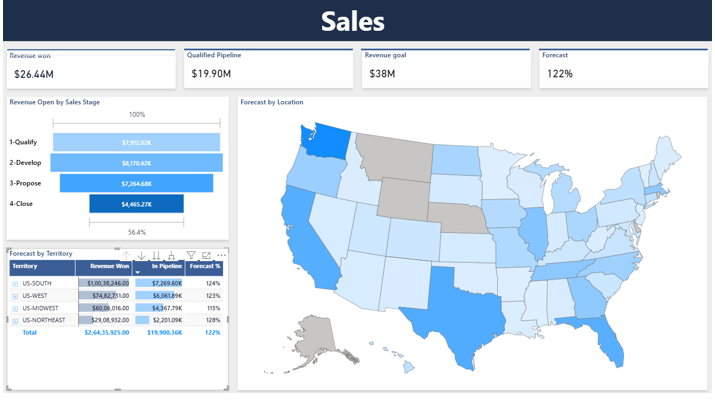
Here is a Sales Performance dashboard showcasing 4 regions –
Overall – Standard Dashboard with no RLS
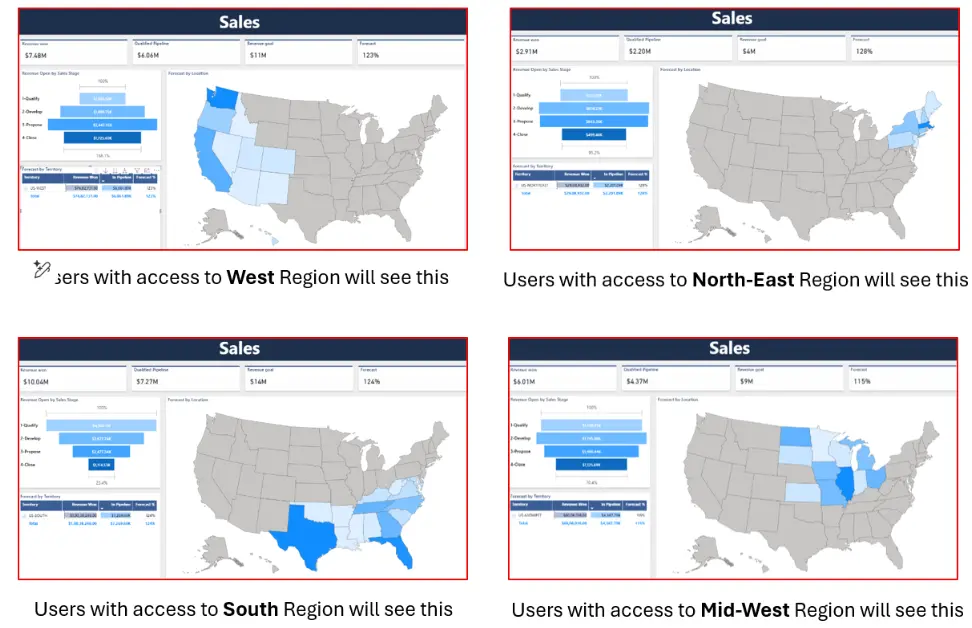
Now, we want to show the tailored data to each specific user. To achieve this, we applied RLS to the dashboard, and here are the results.
The pictures shows the dashboard when users from different regions open it.
How to Implement Row-Level-Security
Let’s take a look at the different methods we can follow, depending on the type of dataset distribution available with us.
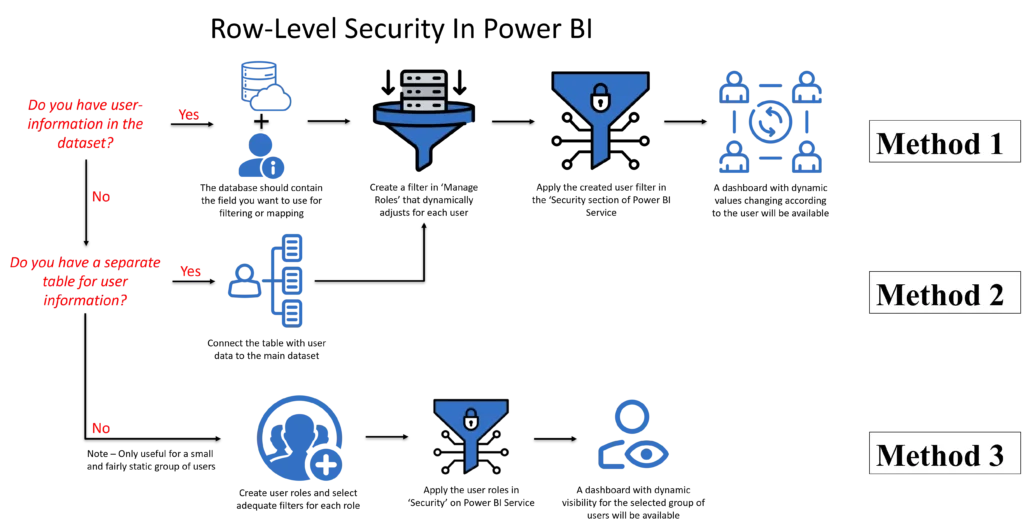
- Email connected directly to the database – We can utilise username() or userprincipalname() DAX function to identify the user, map it to the username/email field in the dataset and filter the data accordingly
- A separate table is available for user mapping – If the username/email is not directly available in the dataset but have a table containing the email and their corresponding regions, you can connect it to the main dataset and then use it for row-level-security.
- Creating specific use– In-case of no direct connection of the email available in the dataset, you can manually create different filters for different roles that might be of separate regions, states, products, etc allowing the people in a Role to only see specific and relevant data.
Use the following flowchart to determine your ideal method for implementing RLS in Power BI.
Solution 1: Email connected directly to the database
We utilised User-to-Data Mapping, to filter the data according to the signed in user.
This can be used where we already have a security/user field mapped to the data, which will be used as a reference to filter the data in the dashboard. So, we leveraged a simple DAX Function to add a filter to the data source.
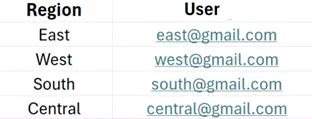
For example – We need to show data connected to the individual in the ‘User’ column of the dataset. Here is the sample dataset –
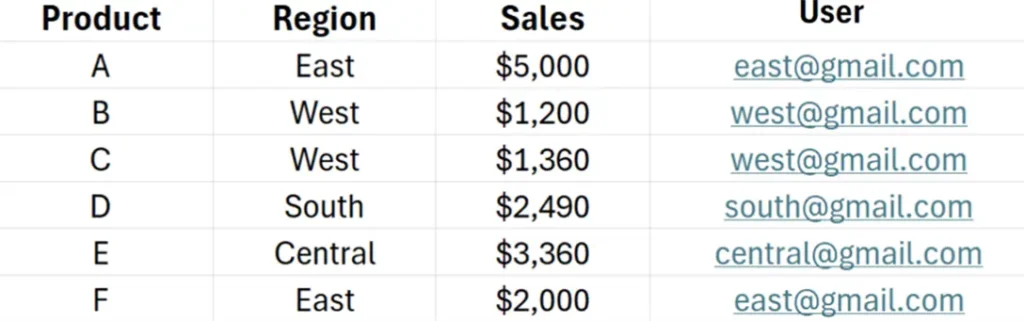
Now to apply RLS, follow the following steps.
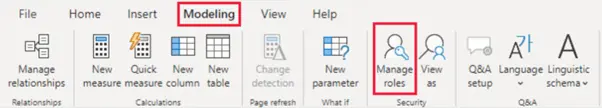
Select Modelling > Manage Roles
Choose DAX editor and enter the desired code that would return a binary value.
[User] = USERPRINCIPALNAMEE()
(Table Field) = (DAX Function that returns the Username)
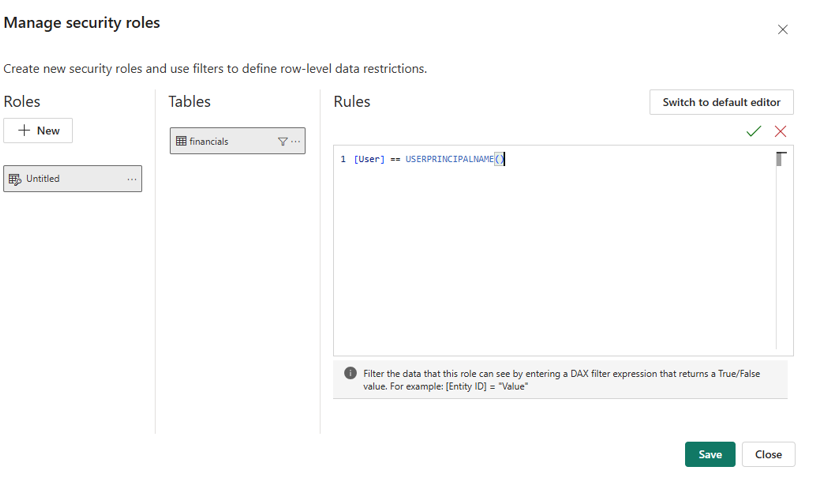
After creating the DAX function, for comparing the USERPRINCIPALNAME() to the relevant user field, click on save.
This would filter out everything else and each user will only see the rows they’re allowed to see, that is the data linked with their username.
To execute the created Row-Level Security, you need to follow a certain steps as given in the “Applying the created ‘Roles’ on published dashboards” section at the end.
At this level of complexity, many companies prefer to hire Power BI consultants so they can validate role definitions and avoid misconfigured rules.
Solution 2: A separate table is available for user mapping
This is almost the same as Method 1 with the only difference being the email or username field is not present in the main dataset but as a separate table with a common column to the main dataset that can be used to connect it.
So just by adding a precursor step of connecting the mapping table to the main dataset, and then following the same steps as mentioned above, we can implement row-level security.
For example if your data looks like this –
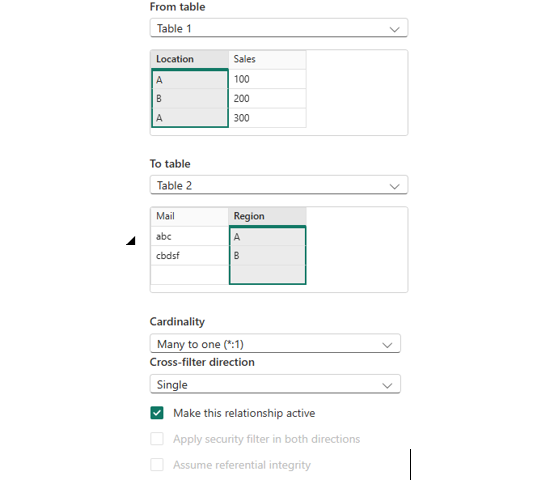
Then connect them in the modelling tab as given below, and follow the same line of steps as Method 1.
Solution 3: Creating a user group
When there is no kind of data available regarding the users/emails in the dataset, then this method can be used as an alternative. Here we can select different users and choose the data that they would be able to see in the dashboard.
This procedure is best for a small and fairly static set of users or groups, and only a small number of workbooks that need user filters.
Select Modelling > Manage Roles menu again. Then select the field you want to use for filtering the view, such as Region.
Create a new ‘Role’ and define the set of filters you want to use for users under this ‘Role’.
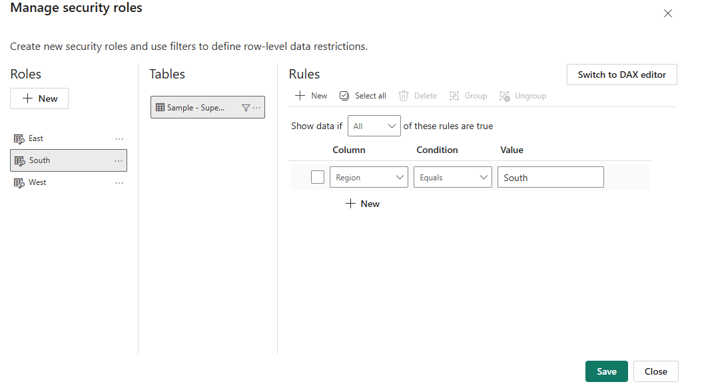
Create any number of ‘Roles’ that would serve the purpose, and to implement them, we shall fall onto the next step
Applying the created ‘Roles’ on published dashboards
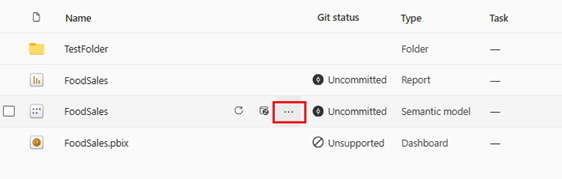
As the final step, we must enforce the created ‘Roles’ in the published dashboard using the Fabric. In Fabric, select the More options menu for a semantic model/dataset. This menu appears when you hover on a semantic model/dataset name.
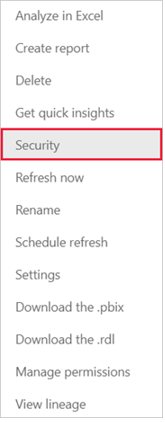
Select ‘Security’ from the options
Security takes you to the Role-Level Security page where you add members to a role you created.
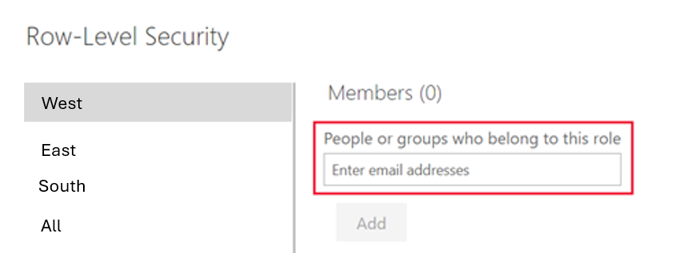
For following Method 1 – Add all to a single role (User)
For following Method 2 – Add the users according to the data you want them to see. In this case according to their Region (East, West, South)
The dashboard is ready and equipped with Row-Level Security.
Results: Seamless Security
By using any of the three given methods, depending on the use-case and environment, you can achieve the following benefits
- Only authorized data shown
- Maintained performance across all views
- Scalable and reusable security model (For solutions 1 and 2)
- Reduced risk of data leaks
Building dashboards for diverse users or regions?
Then apply Row-Level Security in Power BI to ensure each user sees only the data relevant to them—delivering both security and clarity in an efficient manner using a single dashboard.
Each month, we curate the latest updates, insights, and trends for senior leaders in data analytics and AI in our CXO Analytics Newsletter.
Our mission is “to enable businesses to unlock value in data.” For over 20 years, we’ve partnered with more than 100 clients—from Fortune 500 companies to mid-sized firms—to solve complex data analytics challenges. Our services include Advanced Analytics Consulting, Generative AI Consulting, and Business Intelligence (Tableau Consultants, Power BI Consultants and Looker Consultants) turning data into strategic insight. We would love to talk to you. Do reach out to us for a free consultation.