A Data-Driven Blueprint for Growth in the Insurance Industry
Insurance | January 20, 2026


Introduction
According to Swiss Re, of the $7.186 trillion of global direct premiums written worldwide in 2023, $3.226 trillion (44.9%) were written in the United States, making it the largest market in terms of premiums, creating a huge scope for application of analytics to draw insights from this sea of data.
With rising claims costs, evolving customer expectations, and regulatory shifts, insurers are under growing pressure to manage risk and do so with agility, efficiency, and profitability. As digital channels, insurtech partnerships, and AI-driven underwriting redefine the competitive landscape, leadership teams must focus on the right performance levers to boost retention, optimise loss ratios, and maintain financial strength.
At Perceptive Analytics, we collaborate with insurers across property & casualty, life, and health segments to unlock value from their data, turning operational complexity into strategic clarity. In this article, we explore the key performance drivers shaping the future of U.S. insurance and demonstrate how advanced analytics can convert those drivers into sustained competitive advantage.
Speak with our Insurance Analytics Experts today. Book a free 30-min session now
Understanding the Insurance Sector’s Core Performance Drivers
As the U.S. insurance industry continues to evolve, performance management is emerging as a strategic imperative.
It’s no longer enough just to issue more policies—insurers must focus on improving underwriting discipline, claims efficiency, customer retention, channel performance, and profitability, all while navigating regulatory demands and digital disruption.
Here, at Perceptive Analytics, we focus on what matters most: the key performance drivers that determine financial sustainability, operational scalability, and long-term competitiveness in the insurance sector. Below, we outline the most critical performance drivers that every U.S.-based insurance company should measure, monitor, and improve.
Explore more executive analytics perspectives: From Liquidity to Profitability: Must-Have Dashboards for CFOs
1. Strength of Underwriting Discipline & Loss Ratio
Loss ratio is calculated as claims paid divided by premiums earned. It is the most direct indicator of underwriting performance. E.g. Loss ratios for property and casualty insurance (e.g. motor car insurance) typically range from 70% to 99%. Such companies are expected to collect premiums more than the amount paid in claims.
Why it matters: High loss ratios indicate poor pricing or adverse selection and erode profitability.
How it drives performance: Lowering the loss ratio improves underwriting profitability and frees capital for innovation and growth.
Strategy: Monitor loss ratio by product, geography, and risk segment. Use predictive analytics to proactively detect and correct risk-prone portfolios.
2. Underwriting Accuracy & Automation Rate
Underwriting determines the quality of risk accepted. Automated underwriting systems now allow instant approvals for low-risk cases.
According to NerdWallet’s 2017 Driving in America Report, 10% of Americans who have ever had car insurance admit to intentionally providing inaccurate information when purchasing a new car insurance policy. Automating the process of collecting and analyzing initial quote data can significantly enhance efficiency and accuracy.
Why it matters: Inconsistent underwriting leads to mispriced policies, high claims, and customer dissatisfaction.
How it drives performance: High underwriting accuracy improves portfolio health and keeps combined ratios under control.
Strategy: Track automation rates, rework rates, and post-issuance adjustments. Deploy AI/ML models to enhance consistency and speed.
3. Claim Settlement Time & Efficiency
Timely, fair claim settlement is central to customer trust and operational efficiency. Average industry turnaround ranges from 10–40 days, depending on the product line.
In the US, insurance claim settlement times vary by state and type of claim, as simple claims are often settled faster, within 10-20 days, while more complex claims can take longer.
Why it matters: Delayed settlements lower satisfaction, increase customer churn, and may lead to regulatory fines.
How it drives performance: Fast settlements reduce administrative overhead, improve retention, and limit litigation risk.
Strategy: Monitor the settlement cycle by claim type and geography. Identify bottlenecks and automate low-value claim reviews.
4. Control Over Operational Profitability
The combined ratio measures overall underwriting profitability (loss + expense ratios). A ratio below 100% signals profitability from core operations.
The net combined ratio for the US property and casualty industry in 2024 reached its lowest level in over a decade, according to an analysis by S&P Global Market Intelligence. The industry’s aggregated property and casualty (P&C) lines posted a net combined ratio of 96.5%, marking the best annual performance since 2013, when it was 96.2%. This figure represents a significant improvement from the previous year’s net combined ratio of 101.6%.
Why it matters: It captures total cost efficiency across underwriting and claims.
How it drives performance: Managing combined ratios improves operational sustainability and signals financial strength to investors and regulators.
Strategy: Track this ratio by product line and agent channel. Use dashboards to model how pricing, claim reserves, and expenses affect combined outcomes.
5. Customer Loyalty & Retention Strength
Retention is a key growth driver in mature markets. Churn rates vary by product line—home and auto typically range from 10–20%.
According to market estimates, it costs between five and 25 times more to acquire a new customer than to retain an existing one. Insurers are increasingly tracking and reporting on customer retention. As a result, retention has become the most important customer-related issue for insurers.
Why it matters: Acquiring new customers is 5–7x more expensive than retaining existing ones.
How it drives performance: Higher retention increases customer lifetime value and stabilizes revenue.
Strategy: Track renewal conversion, reasons for churn, and segment retention trends. Implement NPS-based feedback loops and personalized engagement campaigns.
The CIO’s View: IT Dashboards Driving Reliability and Security
6. Distribution Channel Performance
The quickest summary of a distribution channel for insurance products is the process by which consumers buy insurance from licensed agents who have been contracted with a carrier to sell their products.
Performance varies widely across brokers, agents, bancassurance, and digital channels. Measuring productivity is key to improving sales ROI.
Why it matters: Unproductive channels increase acquisition cost and reduce speed to market.
How it drives performance: Channel optimization improves conversion rates, reduces CAC, and accelerates growth.
Strategy: Monitor new policies, lead conversion, and persistency by agent/channel. Benchmark commission costs and implement performance-based rewards.
7. Claims Ratio & Resilience Against Fraud
The claims ratio (claims paid ÷ premiums) helps detect loss trends. Rising claim severity or fraud cases can inflate costs dramatically.
An estimated 10% of P&C insurance claims are fraudulent, resulting in a US$122 billion loss annually.
Why it matters: Undetected fraud erodes margins and exposes the company to reputational risk.
How it drives performance: Reducing fraudulent or inflated claims improves profitability and pricing discipline.
Strategy: Implement anomaly detection models. Track flagged vs confirmed fraud claims. Train adjusters on red-flag identification protocols.
8. Regulatory Compliance & Solvency Margin
Regulatory metrics like risk-based capital (RBC) and solvency ratios protect against insolvency and ensure financial stability. Put simply, it indicates how solvent a company is, or how prepared it is to meet unforeseen exigencies. It is the extra capital that an insurance company is required to hold.
Why it matters: Non-compliance can result in fines, sanctions, and business restrictions.
How it drives performance: Ensures readiness for stress events and investor confidence.
Strategy: Use compliance dashboards to monitor exposure vs thresholds, file readiness, and capital adequacy.
9. Product Profitability & Portfolio Mix
Different products (e.g., term life, whole life, auto, health) have varying margins, risk levels, and market potential.
Why it matters: Low-margin or loss-making products can quietly drag overall performance.
How it drives performance: Portfolio optimization aligns resources toward higher-return offerings.
Strategy: Benchmark profitability by product and segment. Phase out underperformers and invest in niche offerings with growth potential.
Analytics Ideas for the Insurance Industry
Identifying the right performance drivers is essential, but executive success depends on the ability to precisely monitor and act on them. At Perceptive Analytics, we design dashboards and analytical tools that empower leadership teams to make faster, smarter decisions—unlocking operational efficiency, financial discipline, and long-term scalability.
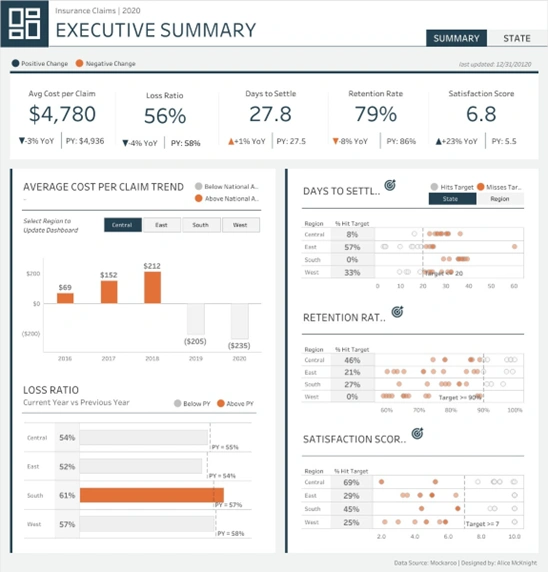
1. Executive Dashboard
Objective – Provide a real-time, high-level view of key insurance metrics for informed decision-making.
Key Benefits – Enables faster, data-driven actions by consolidating critical insights and factors in one place.
2. Risk Assessment Model
Objective – Effectively predict and evaluate premium prices without human interventions Key Benefits – Reduce Manual work and increase risk evaluation accuracy
3. Fraud Detection Tool
Objective – Flag fraudulent claims by training a model using existing data
Key Benefits – Draw attention to and filter out claims with clear signs of fraud
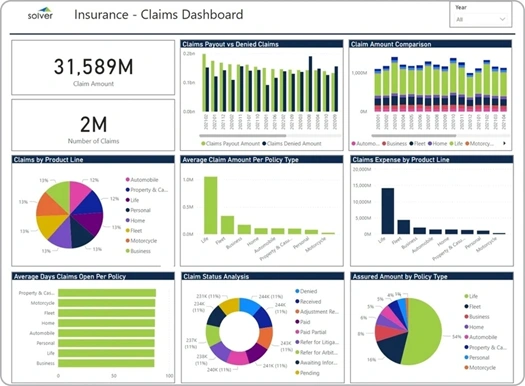
4. Claims and Operations Dashboard
Objective – Flag fraudulent claims by training a model using existing data
Key Benefits – To monitor the working efficiency and claim settlement time and factors
5. Customer Feedback Dashboard and ML Script
Objective – To analyse the consensus among the customers
Key Benefits – Will help monitor customer experience and complaints to get to the pain points
6. Customer Retention Analytics
Objective – Deep dive into the customer retention and churn rate for different regions and products
Key Benefits – Pinpoint concerning regions/areas that are losing customers


7. Customer Profiling
Objective – This Model/tool will help us utilize the existing customers’ data to create personas/profiles, which will be used to effectively modify our targeting strategies
Key Benefits – This will increase the conversion rate as we would use targeted campaigns and approach for each persona, boosting our ROI on promotional campaigns
Customer Service at the Executive Level: Dashboards for Action
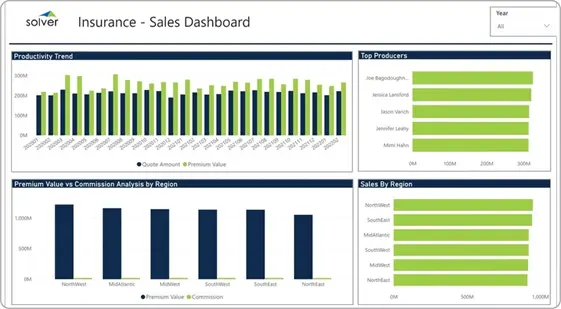
8. Sales Dashboard
Objective – Dashboard consisting of all major metric related to sales displayed in a systematic and insightful layout
Key Benefits – Acts as a one-stop solution of important insights for sales executives
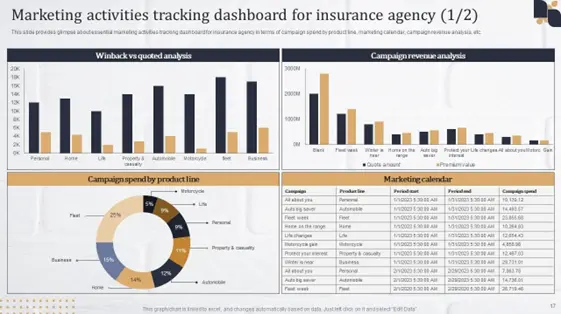
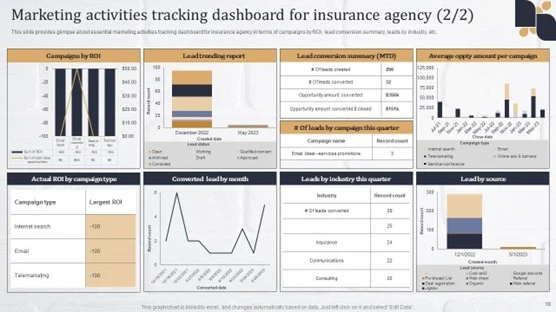
9. Outreach and Marketing Dashboard
Objective – Create a dashboard for displaying information related to promotional and marketing campaigns and their effectiveness
Key Benefits – Helps us identify effective means of outreach with good ROI, so we can focus more on them.
10. AI Financial Summarizer tool
Objective – Creates a report after analyzing all the financial data of the company, summarizing it into a simple, structured report that conveys the exact financial situation of the organization Key Benefits – Helps higher executives to get to critical information directly in a much simpler manner, without parsing through any data or dashboards. They can then take a detailed dive into the dashboards if they want.
Final Word
For insurance companies, growth without control is risk. Financial sustainability depends on disciplined underwriting, efficient claims handling, smart distribution, and customer-centric retention strategies—all underpinned by real-time performance monitoring.
At Perceptive Analytics, we help insurers move beyond static reports to insight-driven dashboards and predictive models that reveal what’s working, what’s not, and where to improve—so you can grow profitably, sustainably, and strategically.
Talk with our Insurance Analytics Experts today. Book a free 30-min session now