5 Ways to Make Analytics Faster
Analytics | January 20, 2026


For CXOs, analytics works best when it keeps up with the speed of decision-making. The best dashboards don’t just show numbers—they make it immediately clear where to look, what it means, and what to do next.
When insights are easy to absorb and action naturally follows, analytics becomes a true business accelerator. And when leaders can quickly see what’s changing, why it matters, and where to focus, analytics moves beyond reporting to become a real enabler of decision-making.
In this article, we’ll walk through five simple, practical ways (plus a bonus tip) to make analytics faster, sharper, and more effective.
For leaders balancing performance, cost, and scale across analytics systems, this cloud data warehouse decision guide can help align tools with business needs.
Speak with our Analytics Experts today. Book a free 30-min session now
1. What-If Analysis: Accelerating Decisions with Scenario-Driven Insights
CXOs need to make decisions on the fly, and by embedding what-if analysis directly into dashboards, they can test assumptions, compare outcomes, and weigh trade-offs instantly. There’s no need to wait for separate analyses or follow-up reports—leaders can immediately see how different choices impact results, saving valuable time and keeping decisions moving forward.
This accelerates decision-making, turning dashboards into proactive tools that not only clarify the current situation but also point directly to the actions required to achieve business objectives.
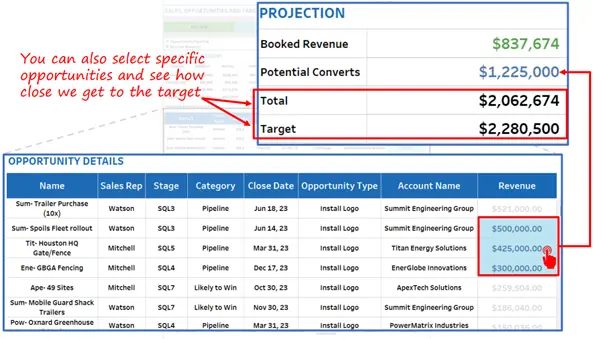
For example, in the dashboard given below, the user can see how the potential conversion of specific opportunities would contribute to their ‘Total Revenue’ and bring it closer to the set ‘Target’.
This helps them quickly decide which opportunities to focus on to reach the target, making decision-making faster and more agile.
Clear accountability around data flows and outcomes boosts confidence in what-if analyses and decision models. Explore how to align your data strategy with decision impact.
2. Pre-Baked Common Analyses
Executives don’t have time to dig through data or run calculations. Dashboards work best when common analyses are already done upfront—like showing which customers are growing or declining, or which products are performing well and which aren’t. This makes insights quicker to understand and easier to act on.
By pre-building these insights into the dashboard, you remove the need for drill-downs, filters, or mental math. Leaders get instant clarity on what matters most, which helps them move faster from seeing the data to deciding the next step.
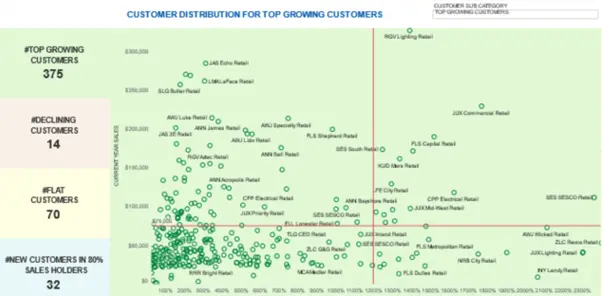
In the example below, a scatter plot groups customers into clear segments, making priorities obvious. An executive can quickly decide whether to focus on reviving declining customers or improving flat ones, with all the relevant details available upfront
3. Use of Embedded Micro-dashboards – Get on-demand details
CXOs need a clear big picture, with the option to dive into details when needed. Micro-dashboards make this easy by giving quick access to deeper insights—such as regional performance, department-level metrics, or product trends—without cluttering the main dashboard.
This keeps the primary view simple and fast, while still offering depth on demand. Executives can scan the summary at a glance and drill into supporting data only when they choose, keeping focus and decision speed high.
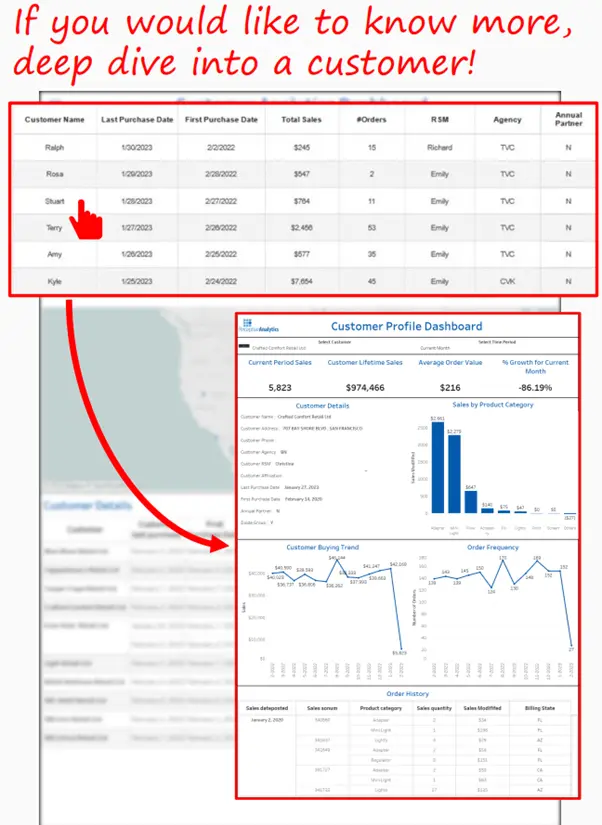
In the example below, clicking on any customer opens a dedicated Customer Profile dashboard. This gives instant access to trends and insights for that specific customer, letting the user explore details seamlessly and on their own terms.
4. Prioritized focus – Draw attention to the matter at hand
Dashboards work best when they make it easy to focus. To keep analytics fast, the design should clearly highlight what matters most at any moment. Visual cues like color, size, and placement can naturally guide an executive’s attention to key metrics, risks, or opportunities that need immediate action.
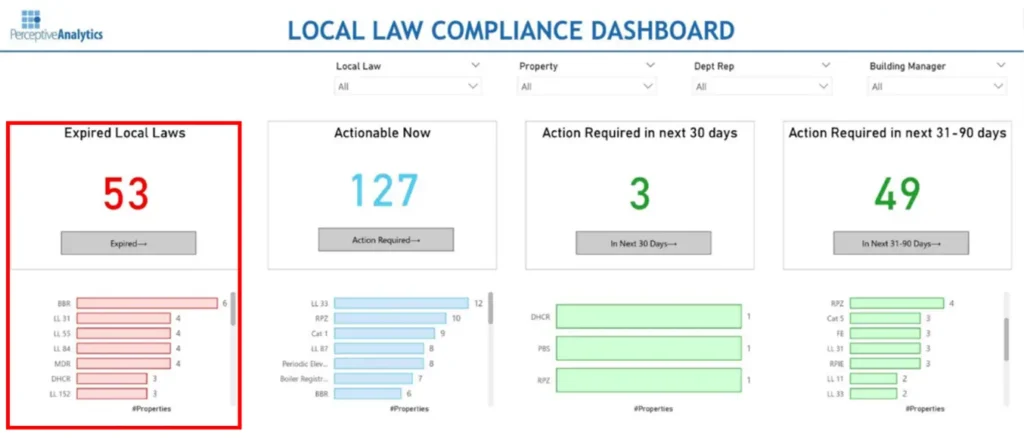
This way, leaders don’t spend time searching for important information—the dashboard brings it right to them.In the example below, locations and properties that need urgent attention are consistently highlighted in red. This makes them hard to miss and helps ensure quick and focused follow-up.
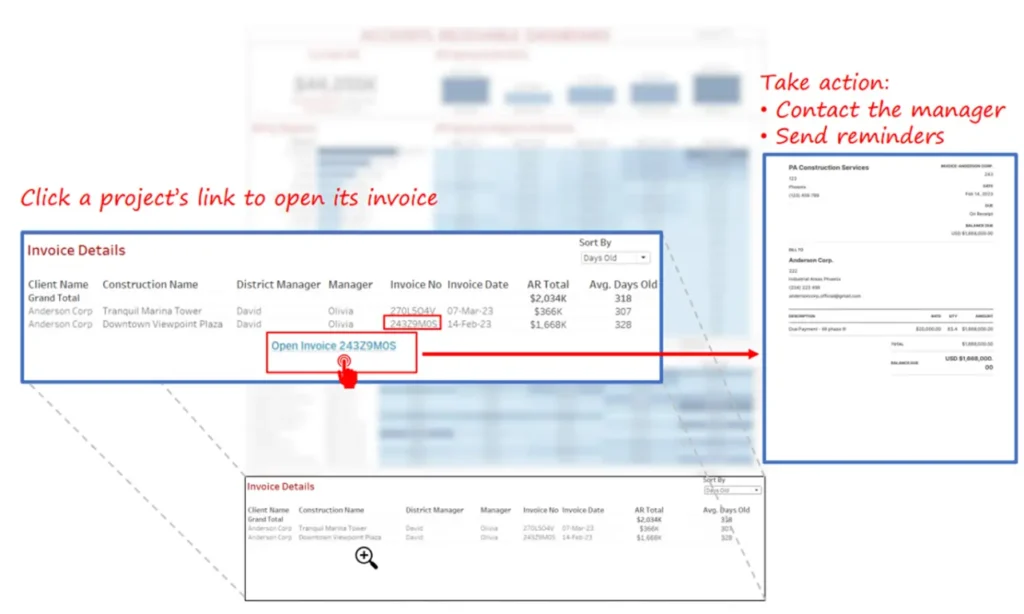
5. Action-Oriented Dashboards – From Insights to Action
Dashboards shouldn’t just show data—they should guide the next step. A well-designed dashboard connects insights directly to action, helping executives move forward without having to interpret numbers or hunt for follow-ups. By reducing analysis time, the dashboard makes it clear what needs attention and what should be done next.
This could mean flagging overdue projects with a one-click link to the project summary, highlighting at-risk accounts with direct access to client details, or showing missed rental payments along with the responsible property manager. The goal is simple: shorten the time between spotting an issue and taking action.
In the example below, if a user notices a high Accounts Receivable amount for a client, they can instantly open the related invoices, understand the situation, and take the right action—without breaking their flow.
When dashboards depend on timely data, understanding pipeline strategies is critical. See how event-driven and scheduled pipelines balance speed and cost.
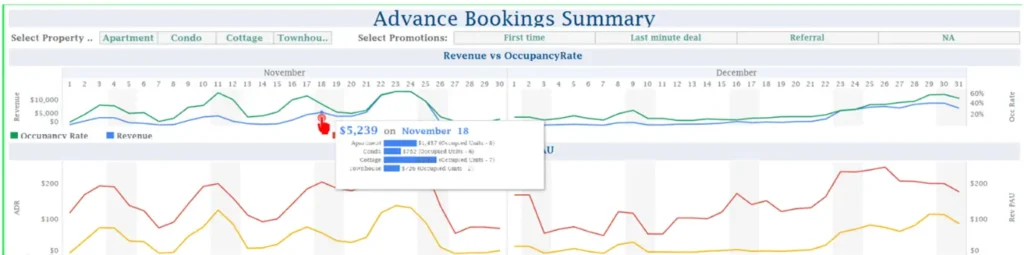
Bonus – Impactful Tooltips – Enhance Clarity with additional insights
Executives value speed and clarity. When dashboards are packed with labels and explanations, they slow people down. Tooltips offer a simple way to keep the view clean while still providing context exactly when it’s needed.
By placing definitions, explanations, or trend notes inside tooltips, dashboards stay uncluttered but informative. CXOs can quickly scan the dashboard and, if they need more detail, simply hover to get instant context—no extra screens or digging required.
In the example below, hovering over the Revenue line graph instantly shows the amount and its breakdown. This gives a quick sense of how properties are performing without crowding the main dashboard.
Conclusion
Dashboards for CXOs are not just about presenting information, they are about enabling faster decisions. By incorporating any of the given design philosophies organizations can create dashboards that cut through complexity and deliver clarity at speed. Ultimately, faster analytics means faster decisions—and faster growth.
To translate insights into competitive advantage, many organizations partner with advanced analytics consultants who help surface deeper patterns and predictive signals from data.
Talk with our Analytics Experts today. Book a free 30-min session now