


In insurance, every decision — from claims settlement to underwriting — runs on data. Yet even the most data-mature insurers encounter a persistent bottleneck: analytics workflows that are slow, fragmented, and too dependent on manual effort.
Many insurers have invested heavily in top-tier BI tools like Power BI or Tableau. Yet, despite these investments, performance often lags. Dashboards don’t refresh on time. Teams spend hours reconciling numbers between systems. Reports differ by region or product. It’s not a tools problem — it’s a workflow problem.
When your data flow gets stuck, so does your business flow.
The Hidden Cost of Fragmented Analytics
Most insurers operate in a complex data ecosystem — legacy systems, multiple data warehouses, and an array of operational tools managing claims, policies, and customer data. This complexity often leads to three major bottlenecks:
- Disconnected data sources: Policy, customer, and claims data often sit in separate silos. Analysts spend more time moving data than interpreting it.
- Reconciliation loops: Teams waste hours validating numbers from one report to another, resulting in conflicting KPIs that slow down decisions.
- Manual reporting burdens: Static reports and refresh processes consume analysts’ time — up to 50 hours per week in some cases — leaving little time for strategic analysis.
When data workflows are manual and disjointed, organizations lose speed, consistency, and context. These inefficiencies directly impact claim cycle times, underwriting accuracy, and executive trust in analytics.
A Real Story: 50+ Hours Lost Every Week
Consider the case of a mid-sized health insurer that managed monthly claims reports manually. Every week, analysts exported data from multiple systems, merged Excel files, and verified totals by cross-checking with department heads. The effort looked thorough — but it wasn’t sustainable.
Each cycle consumed more than 50 analyst hours weekly. Errors in manual data merges often went unnoticed until claim settlements were delayed. Leadership lacked real-time visibility, and operational decisions lagged by weeks.
They weren’t missing better tools. They were missing automated flow.
“This operational shift builds on what we call Decision Velocity — the new performance metric redefining insurance analytics.”
Step Back: The Framework That Solves It
To fix analytics performance issues, high-performing insurers have adopted a simple but transformative framework — Integrate → Automate → Activate.
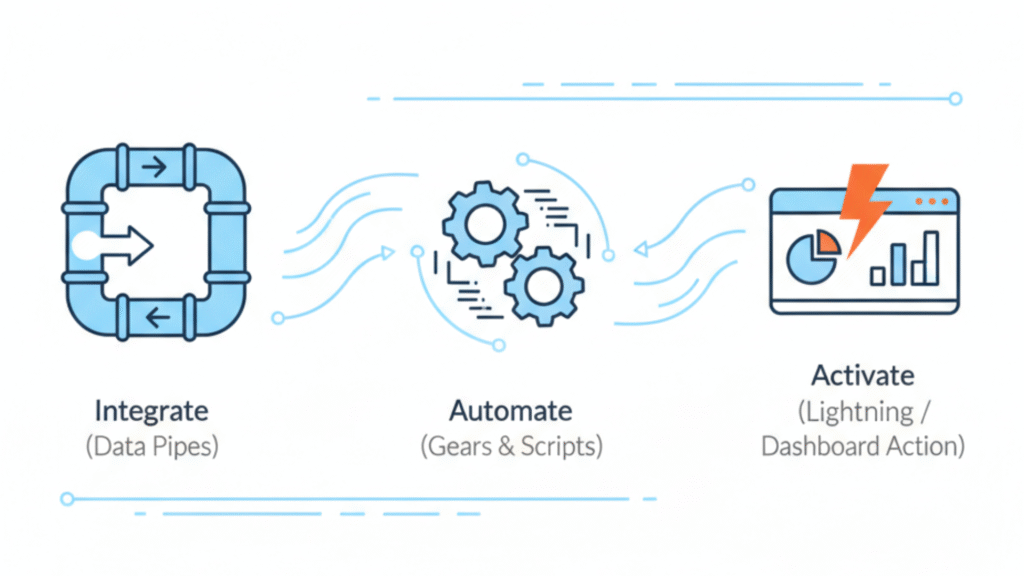
Let’s break it down.
1. Integrate: Build Seamless Data Foundations
The first step is to unify data sources. Integration creates the single source of truth that insurers can rely on for consistent insights.
Many insurance teams still manage multiple data pipelines — policy management data in one place, claim workflows in another, and financial reporting in yet another. Integration eliminates the friction between these systems.
At this stage, success depends on:
- Assessing and mapping all current data sources.
- Defining clear data ownership roles across teams.
- Using APIs or ETL processes to unify policy, claims, and underwriting data into one warehouse or BI model.
For a leading general insurer, automated ingestion pipelines built on Azure Data Factory reduced manual data prep from 10 hours to just under 1 hour per refresh. The result: teams got clean, verified data daily — not weekly.
Integration isn’t glamorous. But it’s the bedrock of smart analytics.
2. Automate: Eliminate Manual Loops
Once data is unified, the next bottleneck to unlock is automation. Automation ensures critical analytics processes — refresh cycles, report distribution, and validations — run independently of manual intervention.
Automation makes analytics continuous instead of periodic.
For insurers, this means:
- Scheduled data refreshes for operational dashboards.
- Automated alerting when metrics deviate from thresholds.
- Auto-generated claim summaries or policy performance reports emailed to teams daily.
Automation also builds reliability. When executives open dashboards, they trust what they see, knowing it reflects the latest available data. The energy once spent chasing numbers now goes into interpreting them.
In the earlier health insurer example, automation helped them cut the report generation cycle from 5 days to a few hours. Analysts regained their week. And leadership gained a live view of claim performance.
3. Activate: Turn Insights Into Operational Impact
Integration gives you visibility. Automation gives you consistency. Activation closes the loop — converting analytics into action.
Activation happens when analytics is embedded directly into daily operations — claims processing, fraud monitoring, agent performance tracking, and customer experience analysis.
Here’s how that looks:
- Dynamic dashboards alert claims teams to outliers in real time.
- Underwriting managers see risk trends before policy renewals.
- Leadership gets a daily execution snapshot across all KPIs.
When analytics activation happens at this level, every user becomes a decision maker, not just a data consumer.
One global insurer integrated Power BI dashboards directly into their claims management platform, reducing claim decision-making time by 40 percent. In high-volume operations, that translated into hundreds of hours saved monthly and faster turnaround for customers.
The Transformation Payoff
Workflow modernization doesn’t just reduce reporting time — it builds a more adaptive organization. High-performing insurers that have automated their analytics flows report measurable improvements across several key metrics:
- Claim cycle time: 25–45% reduction after implementing automated claims dashboards.
- Reporting turnaround: From days to minutes with auto-refresh pipelines.
- Team productivity: 35–50% higher as analysts focus on insights, not operations.
- Decision speed: 40% faster due to ready-to-use reports and alerts.
These outcomes matter because insurers today compete not just on product or pricing, but on responsiveness — how quickly they can turn data into action.
When workflows improve, so does ROI from your BI stack.
It’s not about adding tools; it’s about orchestrating flow.
Read how AI is transforming insurance claims into real-time operations.
Why It Matters Now
The insurance industry sits at a digital crossroads. Customer expectations are shifting fast — they expect instant updates, seamless claims, and data-driven engagement. Regulatory pressures are also demanding greater transparency and accuracy in reporting.
Against this backdrop, manual analytical workflows simply cannot scale. Insurers who still depend on static Excel reporting or delayed data refreshes risk falling behind both regulators and competitors.
Modern BI platforms like Power BI, when fully automated, are now essential for sustainable operational excellence.
Analytics modernization also transforms the analyst’s role. Instead of being “report producers,” analysts evolve into “decision enablers.” When workflows flow, analysts focus on what matters — uncovering trends, predicting risk, and enabling faster claims cycles.
The Human Side of Automation
Automation may sound technical, but it ultimately improves human performance. When repetitive work is replaced with intelligent processes, teams get to focus on collaboration and strategic analysis.
That’s where empathy meets analytics.
Consider the impact on your workforce:
- Less time spent checking numbers, more time understanding customers.
- Fewer silos between IT, analytics, and operations.
- More confidence in data-driven decision-making.
When workflows are modernized, the entire organization moves more fluidly — data, decisions, and people aligned toward one goal: better outcomes for policyholders.
This is the subtle power of workflow design — enabling people to do their best work.
Learn why human insight remains irreplaceable in AI-driven analytics.
The New Analytics Equation for Insurers
Let’s redefine what success looks like in analytics for insurance firms:
Performance=Tools+Workflows+People
Performance=Tools+Workflows+People
Most insurers already have the first component — industry-leading tools. What’s missing is the right workflow design that connects everything.
When integrated and automated, analytics workflows no longer compete with operations for attention; they become part of operations.
For insurers, this integration delivers:
- 24/7 reporting consistency.
- Predictive insights on claims, premiums, and risk pools.
- Real-time oversight that drives better compliance and customer satisfaction.
Operational excellence in analytics is no longer optional; it’s the foundation for building sustainable, scalable insurance businesses.
From Dashboards to Decisions — Intelligently
At Perceptive Analytics, we believe analytics should flow as fast as your business does. We’ve helped insurers unify fragmented pipelines, automate reporting loops, and activate insights that directly boost business performance.
Our automation-first approach has empowered analytics teams to move beyond maintenance and focus on decision intelligence.
Because analytics isn’t a tool problem — it’s a flow problem.