Executive Introduction
Today’s CFOs operate in a climate of shrinking margins, volatile forecasts, and rising pressure to deliver real-time answers. Static reports and lagging metrics are no longer sufficient. What’s needed is a layer of executive-ready dashboards that don’t just report the numbers but drive decision-making.
This article curates 12 essential finance dashboards that enable CFOs and senior finance leaders to take control of liquidity, profitability, compliance, and strategic planning. From working capital to credit lines, from tax exposure to product margins, each dashboard is selected for its clarity, operational relevance, and business impact.
Several are built by Perceptive Analytics based on real-world client engagements. Others are best-in-class industry examples. Together, they reflect how modern financial leadership is anchored in data visibility, scenario agility, and forward-looking insight.
| No. | Dashboard | Key takeaway — why this matters for CFOs |
| 1 | CFO Executive Dashboard | Gives CFOs a unified view of revenue, costs, profits, and segment performance, enabling rapid boardroom-ready decisions |
| 2 | Cash Flow Dashboard | Tracks inflows/outflows across operating, investing, and financing, ensuring liquidity planning and early risk detection |
| 3 | Working Capital Dashboard | Monitors receivables, payables, and inventory efficiency, surfacing cash conversion cycle risks and opportunities |
| 4 | Accounts Receivable Dashboard | Highlights overdue exposure and client-level risks, helping prioritize collections and reduce bad debt |
| 5 | Accounts Payable Dashboard | Ensures payment discipline and vendor trust by tracking overdue liabilities and payment cycles |
| 6 | Budget vs Actual Performance Dashboard | Flags budget adherence at unit/property level, spotlighting persistent overruns and high-performing sites |
| 7 | Budget vs Forecast Variance Dashboard | Connects forecast deviations to profit impact, helping refine forecasting accuracy and cost allocation |
| 8 | Profit & Loss (P&L) Actuals Dashboard | Provides multi-entity P&L visibility with drill-downs, enabling CFOs to detect anomalies and manage cost shifts |
| 9 | Product Profitability Dashboard | Identifies high-margin winners and loss-making products, guiding pricing, promotions, and mix optimization |
| 10 | Credit Line Scenario Planning Dashboard | Simulates inflows/outflows under multiple scenarios, helping CFOs optimize credit utilization and negotiations |
| 11 | Investment Evaluation & Scenario Dashboard | Models ROI, valuation, and macro-scenario impacts, supporting informed strategic investment decisions |
| 12 | Tax Exposure & Audit Lifecycle Dashboard | Tracks tax dues, exposure, and audit progress across jurisdictions, reducing compliance risks and surprises |
1. CFO Executive Dashboard
Industry Fit
Cross-industry; suitable for mid-to-large enterprises with diverse product lines or regional operations.
Relevance For
Chief Financial Officers, Finance Directors, FP&A Heads
Objective
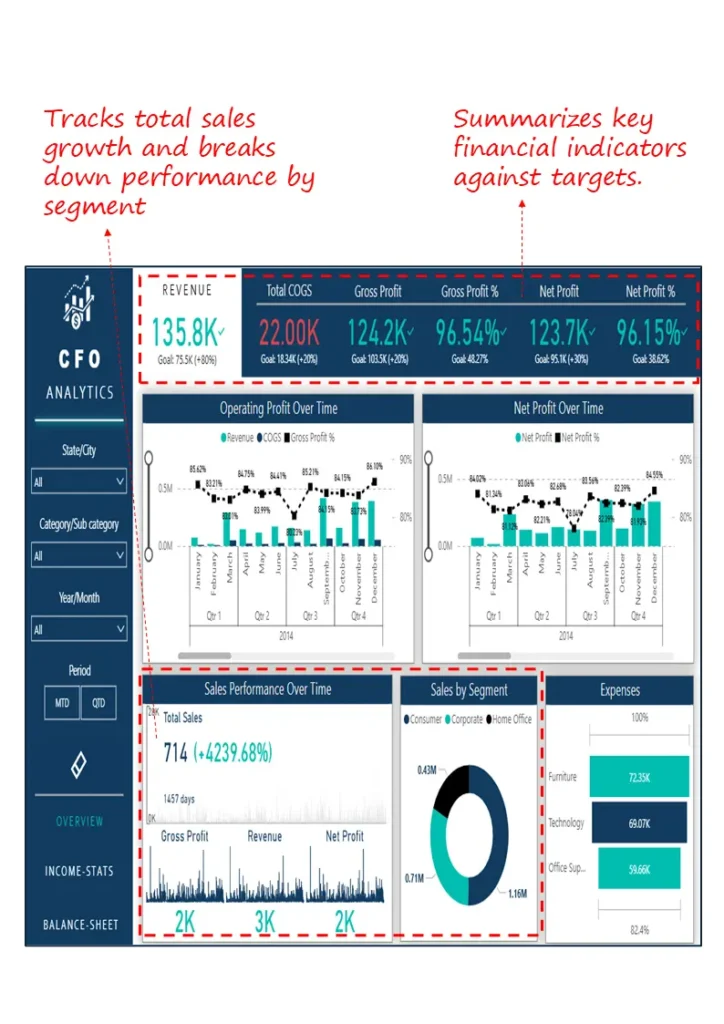
To provide an at-a-glance view of sales, costs, profits, and segment-level performance aligned with targets for rapid executive decision-making.
What’s Good About This Dashboard
- Tracks total revenue, gross profit, and net profit against predefined goals for immediate performance health checks
- Highlights operating profit and margin trends over time to spot volatility or pattern shifts
- Breaks down sales performance by product category and segment, aiding resource reallocation
- Offers a clear summary of expense distribution, supporting cost structure evaluation
2. Cash Flow Dashboard
Industry Fit
Applicable across sectors, especially capital-intensive industries such as manufacturing, construction, or energy.
Relevance For
CFOs, Treasury Heads, Corporate Controllers
Objective
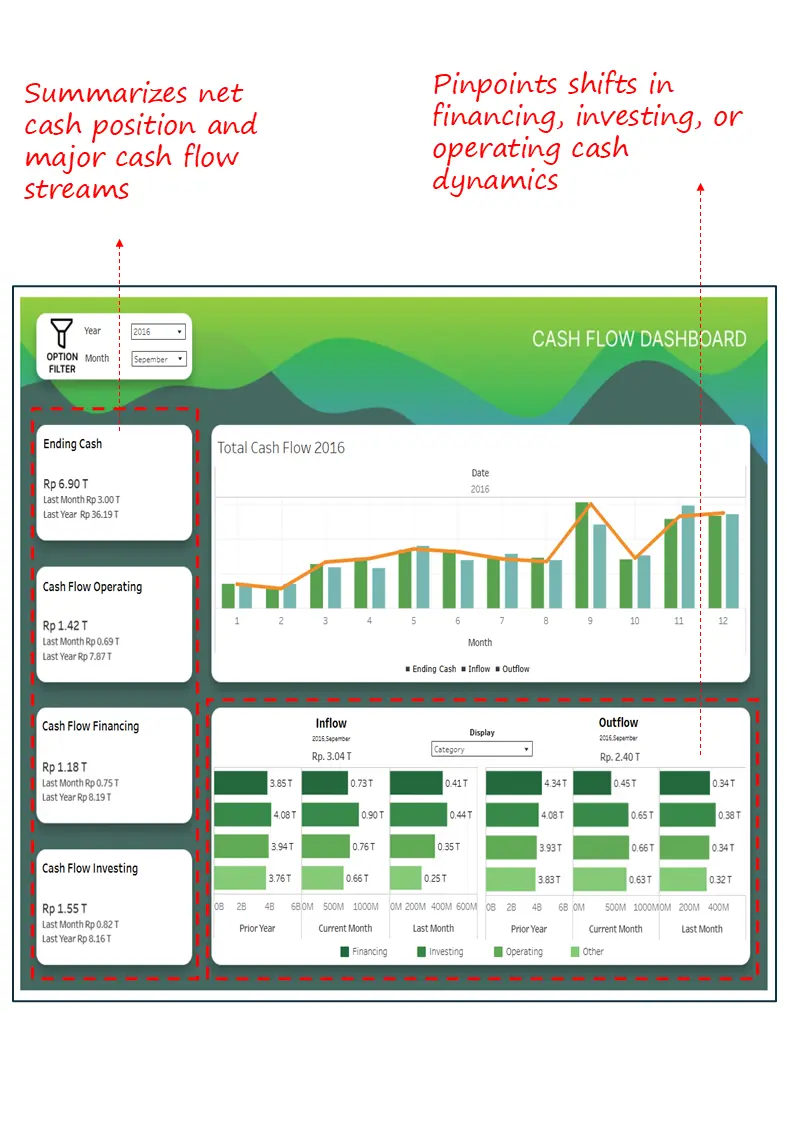
To track net cash position and major cash flow movements across operating, investing, and financing activities enabling liquidity planning and early risk detection.
What’s Good About This Dashboard
- Summarizes ending cash position and compares it with last month and last year for directional clarity
- Breaks down cash inflow and outflow trends across operating, investing, and financing streams
- Visualizes monthly net cash flow movements to highlight liquidity inflection points
- Enables side-by-side comparison of inflow/outflow sources across time periods to detect pattern shifts

3. Working Capital Dashboard
Industry Fit
Ideal for sectors with high inventory turnover and receivables risk such as retail, manufacturing, and distribution.
Relevance For
CFOs, FP&A Leads, Working Capital Optimization Teams
Objective
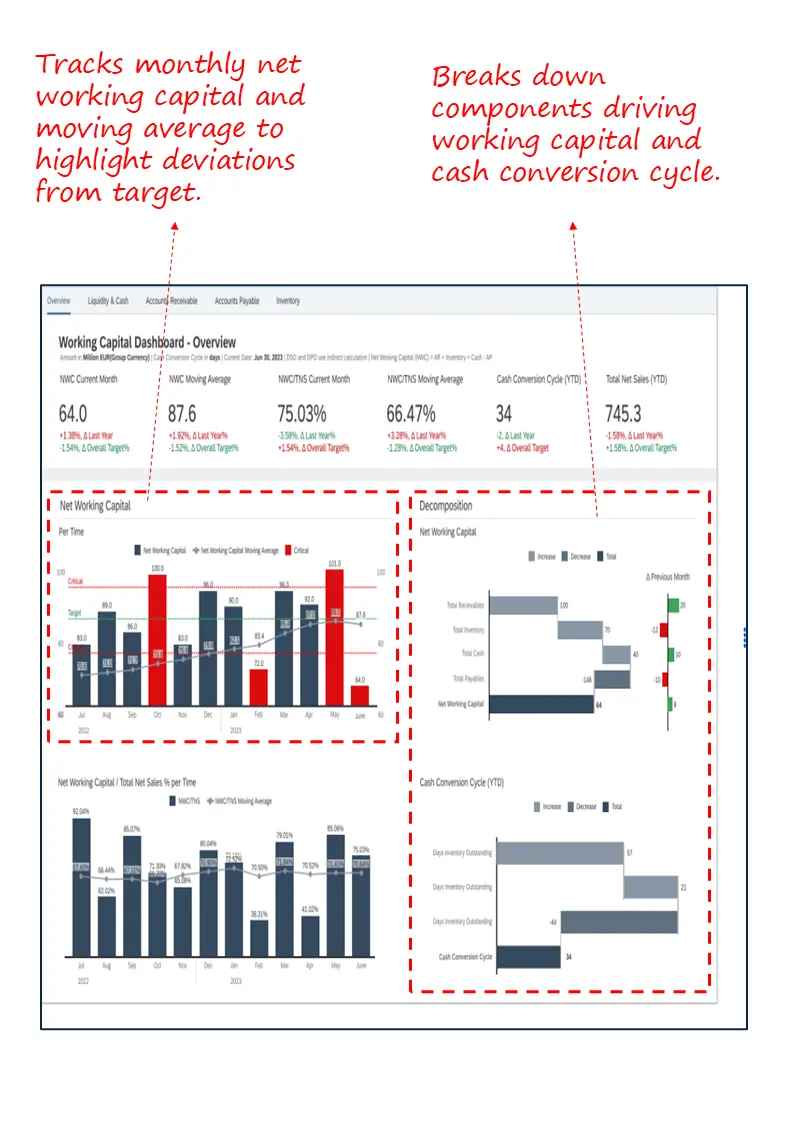
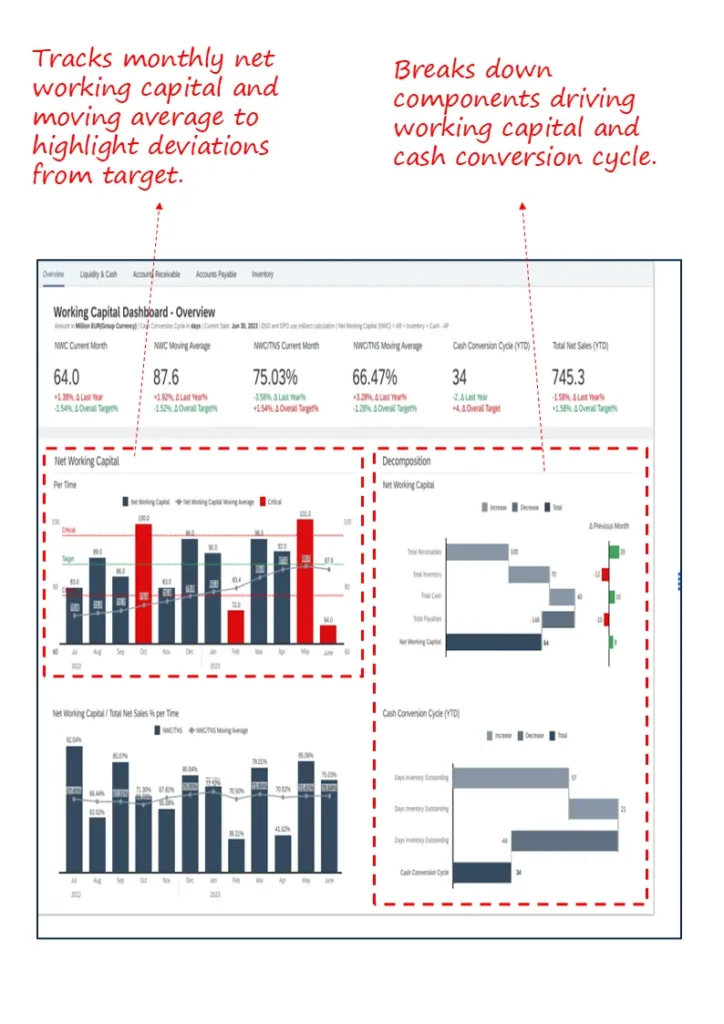
To monitor net working capital trends, diagnose deviations from targets, and analyze the cash conversion cycle across key components.
What’s Good About This Dashboard
- Tracks net working capital and moving average over time to surface seasonal or structural deviations
- Decomposes drivers such as receivables, payables, and inventory for root-cause analysis
- Visualizes the cash conversion cycle to expose working capital inefficiencies
- Benchmarks current performance against prior month and goal thresholds to prompt corrective action
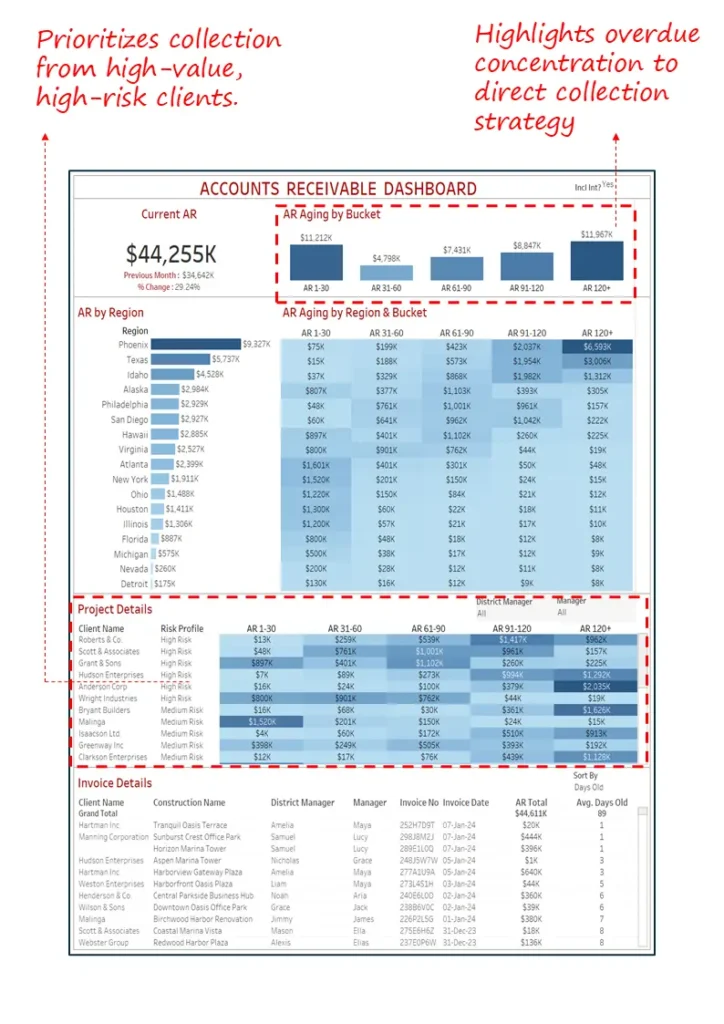
4. Accounts Receivable Dashboard
Industry Fit
Ideal for B2B companies with high invoice volumes and long payment cycles such as construction, professional services, and wholesale distribution.
Relevance For
CFOs, Credit & Collections Managers, Accounts Receivable Teams
Objective
To monitor receivables aging, prioritize collection efforts, and reduce overdue exposure through region- and client-level targeting.
What’s Good About This Dashboard
- Segments outstanding receivables by aging buckets for risk profiling and prioritization
- Highlights high-risk, high-value clients to direct collection focus
- Visualizes overdue concentration by region and project to guide field-level action
- Provides invoice-level details for granular tracking and escalations
5. Accounts Payable Dashboard
Industry Fit
Relevant for companies with complex vendor ecosystems such as manufacturing, pharmaceuticals, or logistics.
Relevance For
CFOs, Payables Teams, Procurement Finance Leads
Objective
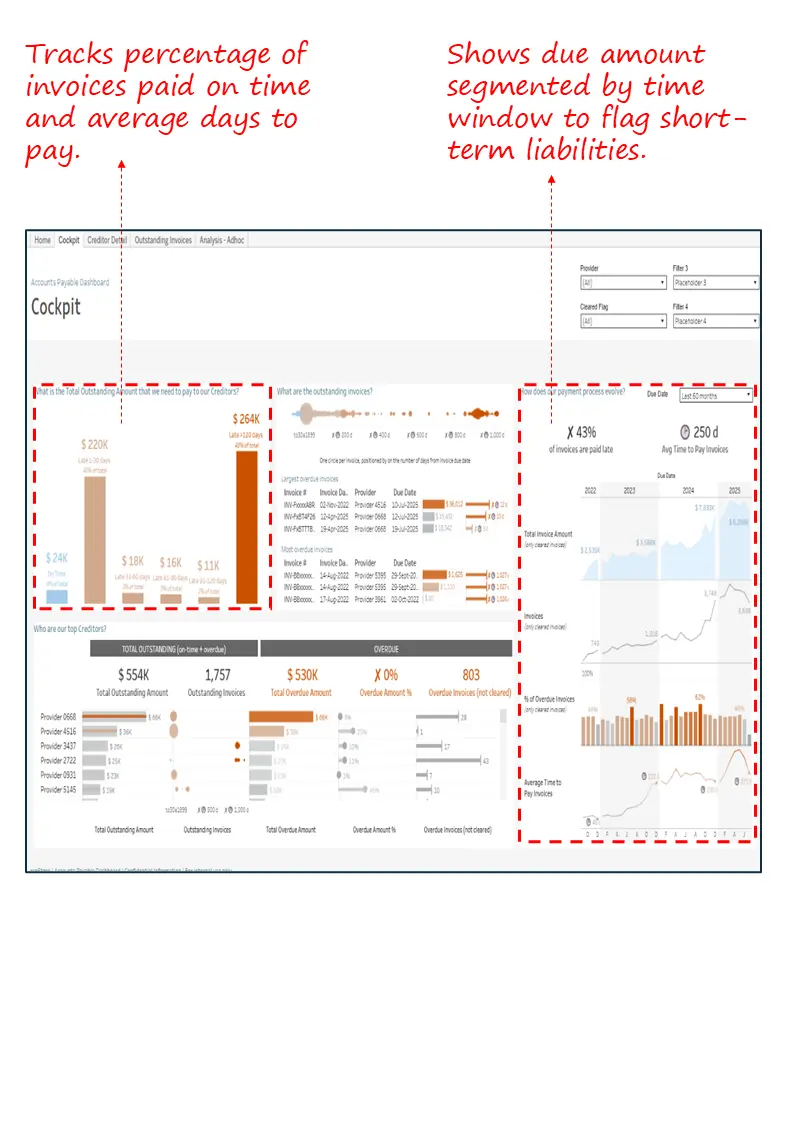
To monitor payment discipline, track overdue liabilities, and improve vendor relationship management through timely disbursements.
What’s Good About This Dashboard
- Tracks percentage of invoices paid on time and average days to pay critical for supplier trust
- Flags overdue amounts segmented by time buckets to highlight urgent liabilities
- Offers a breakdown of outstanding payables by vendor, region, or business unit
- Enables AP teams to prioritize disbursements based on risk and payment history

6. Budget vs. Actual Performance Dashboard
Industry Fit
Works well in multi-location enterprises such as real estate, hospitality, healthcare, or retail—where budget discipline is tracked across sites or business units.
Relevance For
CFOs, Financial Controllers, Business Unit Heads
Objective
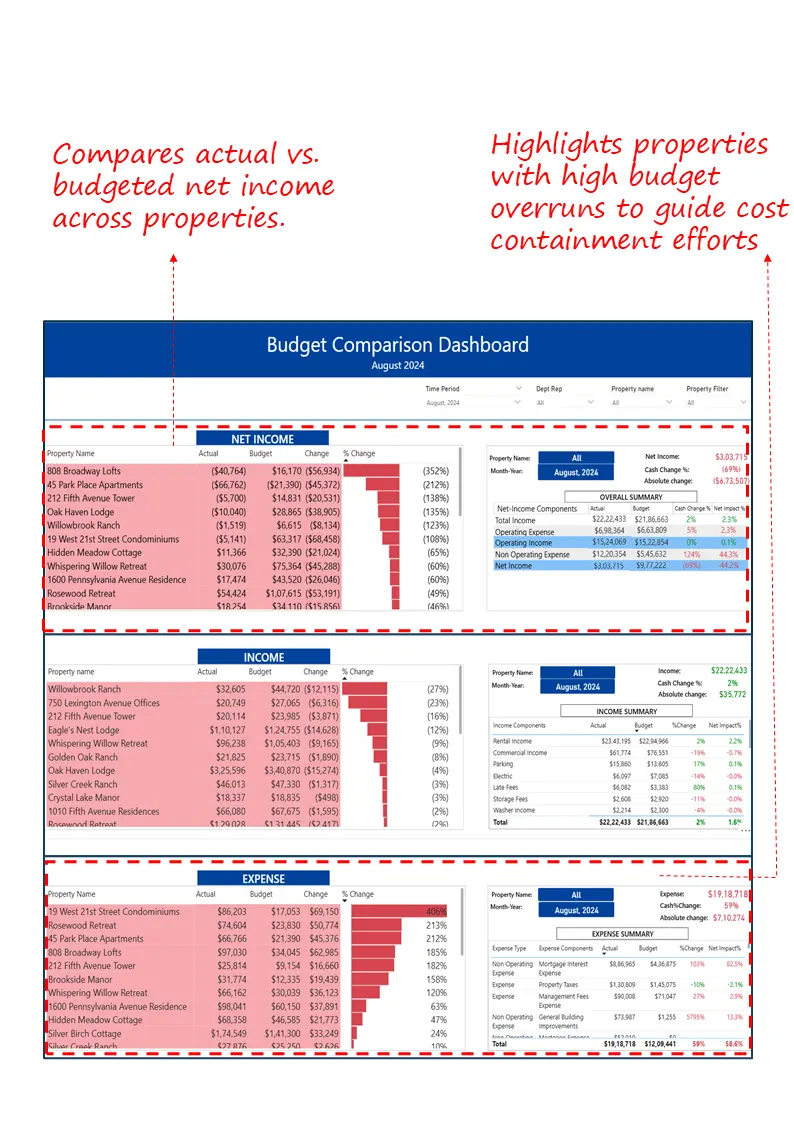
To monitor budget adherence across income, expenses, and net income, and identify cost overruns at the property or unit level.
What’s Good About This Dashboard
- Compares actual vs. budgeted values for income, expenses, and net income in a compact layout
- Flags top-performing and underperforming units by variance to focus management attention
- Highlights properties or cost centres with persistent budget overruns
- Supports monthly review cadence with ready-to-use visuals for financial steering

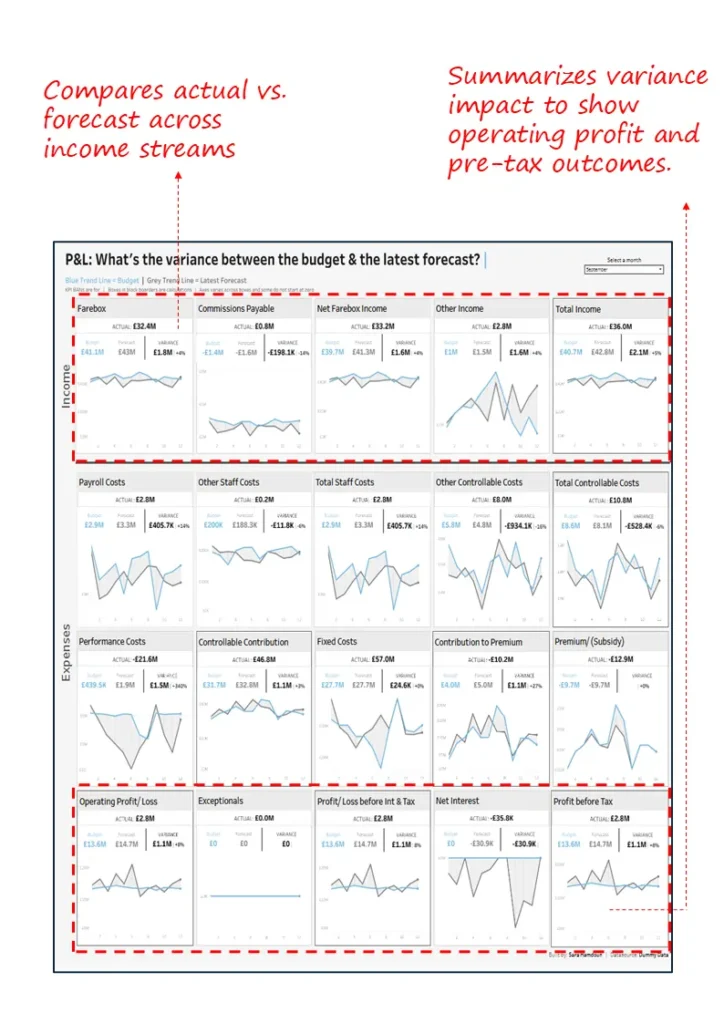
7. Budget vs. Forecast Variance Dashboard
Industry Fit
Applicable across industries where monthly forecasting and budget adherence are key such as transportation, telecom, SaaS, and insurance.
Relevance For
CFOs, FP&A Leaders, Business Finance Partners
Objective
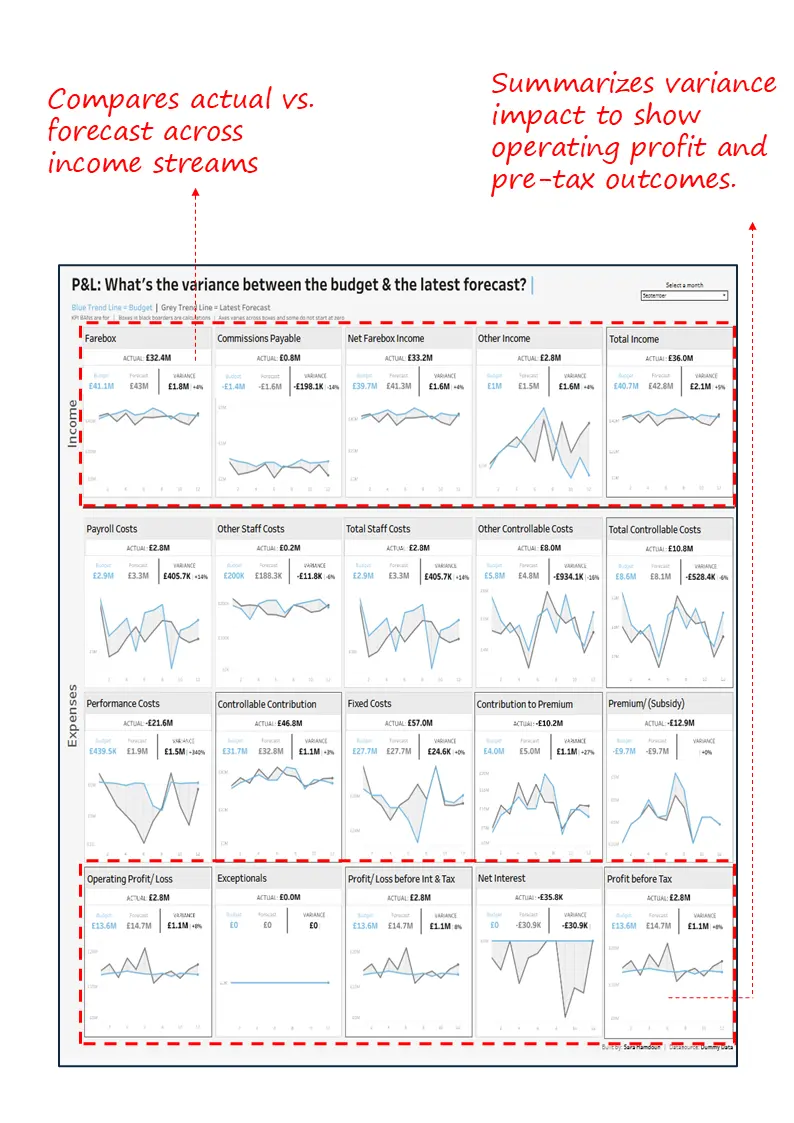
To compare actual vs. forecast values for income and expenses and quantify their variance impact on operating and pre-tax profit.
What’s Good About This Dashboard
- Displays actuals vs. forecast across multiple income and expense lines for variance tracing
- Breaks down cost categories to isolate root drivers of overspend or underspend
- Highlights impact of variances on operating margin, interest, and pre-tax profit
- Helps FP&A teams refine forecast accuracy and prioritize budget reallocation
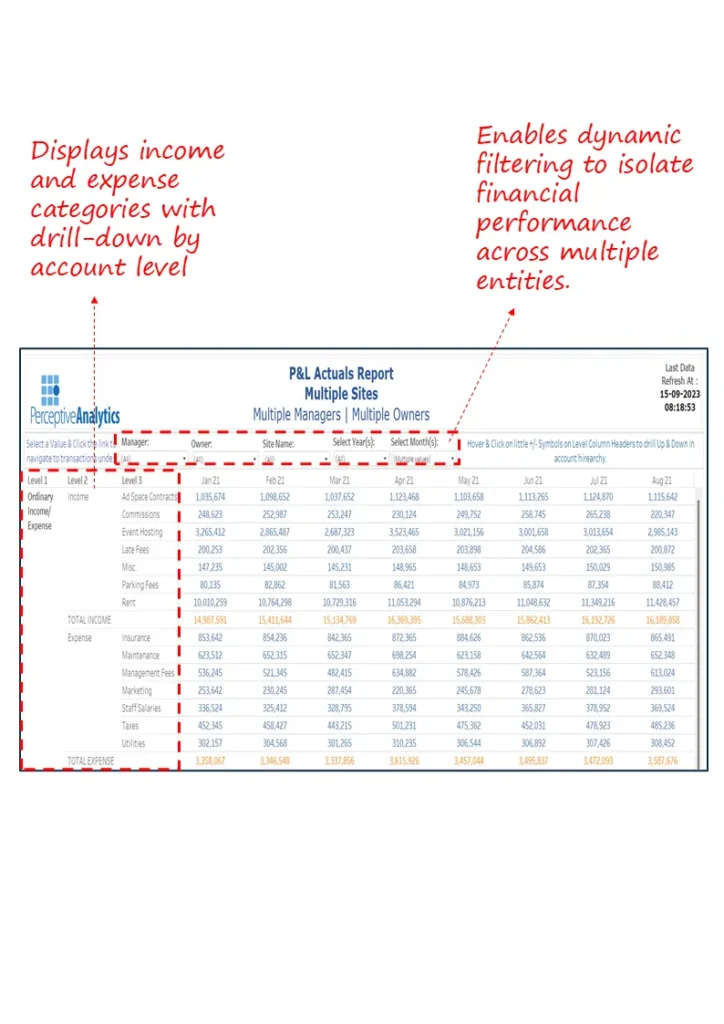
8. Profit & Loss (P&L) Actuals Dashboard
Industry Fit
Highly relevant for organizations with multi-entity, multi-department operations such as conglomerates, real estate, or franchised networks.
Relevance For
CFOs, FP&A Leads, Group Finance Managers
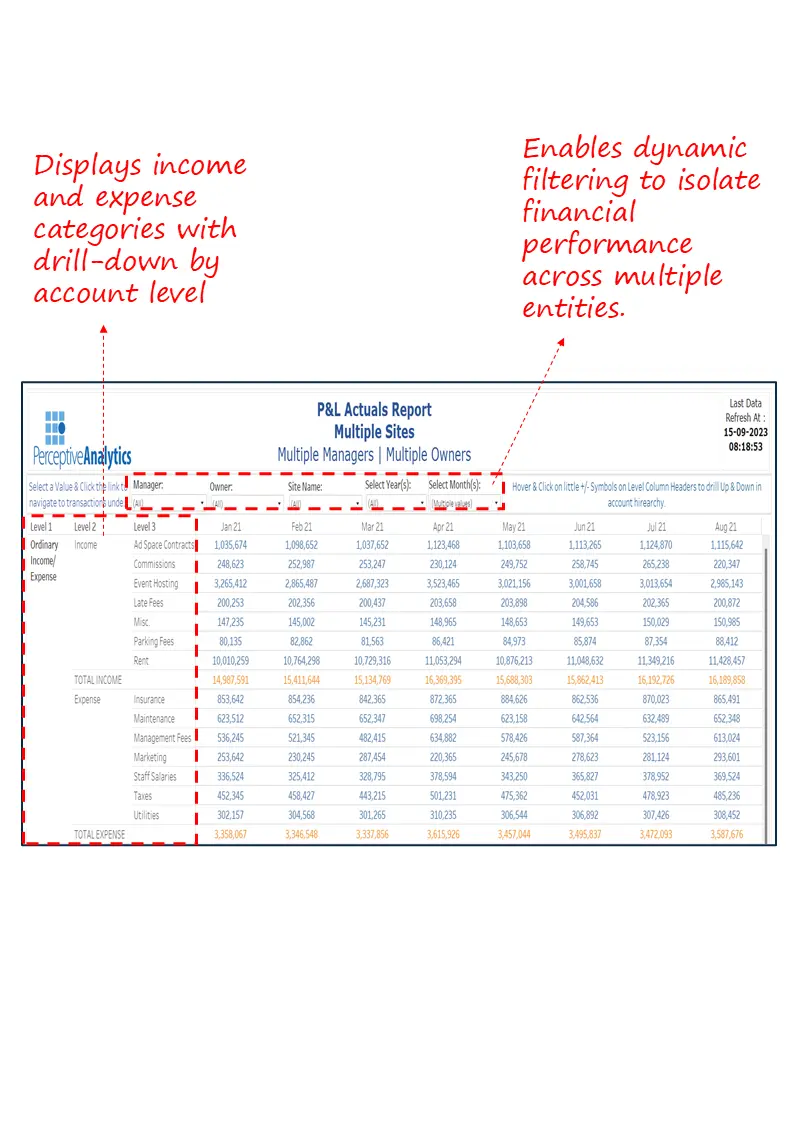
Objective
To review income and expense actuals across multiple business units, enabling dynamic drill-down into account-level drivers and inter-entity variances.
What’s Good About This Dashboard
- Displays P&L actuals by income and expense categories across sites or entities
- Enables filtering by manager, owner, or cost centre for targeted financial reviews
- Supports monthly tracking to detect anomalies and shifts in spending patterns
- Offers drill-down visibility to specific accounts for root-cause financial analysis
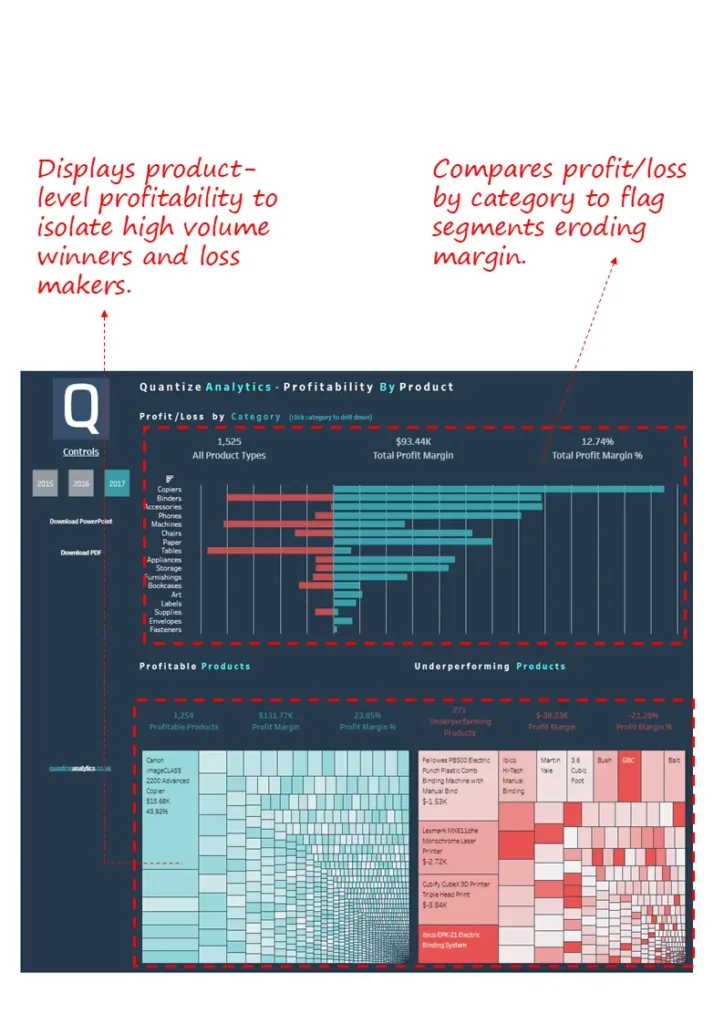
9. Product Profitability Dashboard
Industry Fit
Ideal for consumer goods, retail, e-commerce, and industrial manufacturing anywhere product-level margin clarity is key.
Relevance For
CFOs, Product Line Controllers, Category Managers
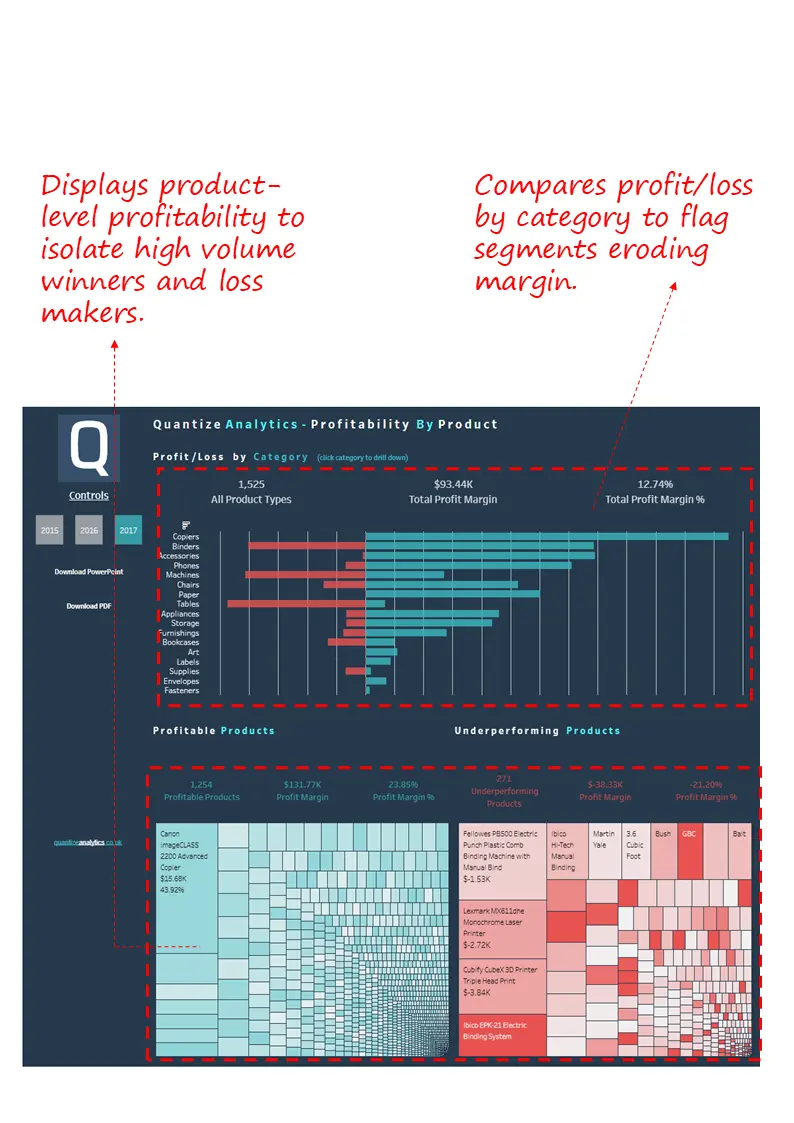
Objective
To isolate high-margin winners and underperforming products, enabling better pricing, promotion, and product mix decisions.
What’s Good About This Dashboard
- Compares profit/loss by product category to surface margin dilution areas
- Segments products into profitable and underperforming groups for targeted actions
- Highlights high-volume loss-makers that require pricing or cost revision
- Enables margin optimization at both category and SKU levels through tree maps and bar charts
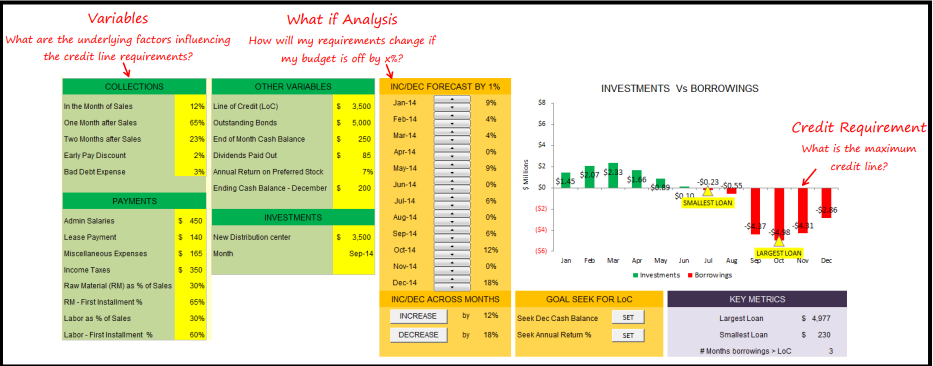
10. Credit Line Scenario Planning Dashboard
Industry Fit
Suited for mid-sized to large businesses with seasonal cash flows and credit dependencies such as consumer electronics, retail, and manufacturing.
Relevance For
CFOs, Treasury Leaders, Financial Planners
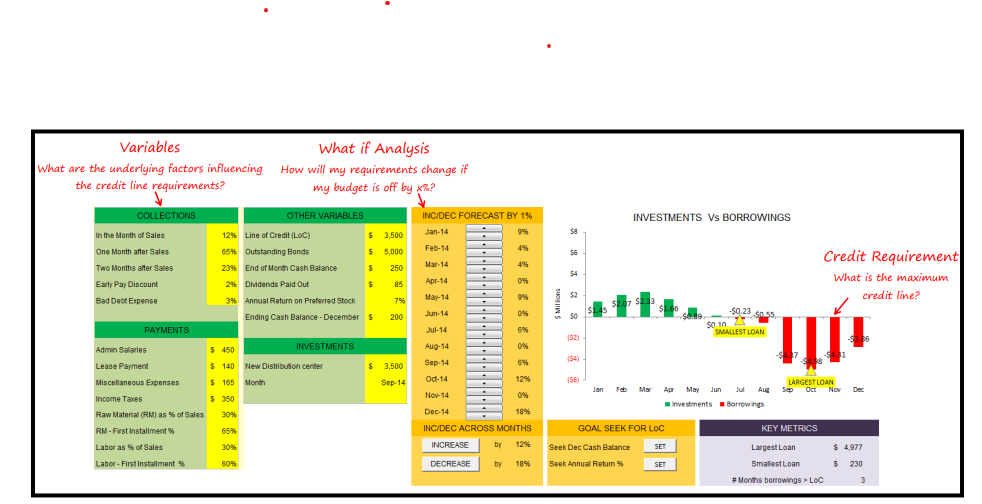
Objective
To forecast cash flow volatility, evaluate credit line utilization under different assumptions, and support strategic negotiations with lenders.
What’s Good About This Dashboard
- Simulates monthly inflows and outflows across collections, payments, and investment plans
- Enables dynamic what-if analysis to estimate credit needs under varied revenue and cost conditions
- Highlights peak and low credit usage periods to inform renegotiation and timing of financing
- Supports goal-seeking for year-end cash balance or target return, improving capital efficiency
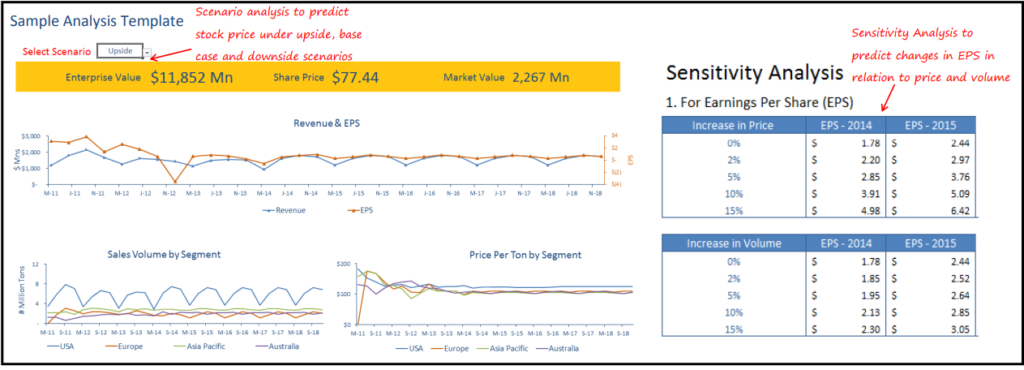
11. Investment Evaluation & Scenario Dashboard
Industry Fit
Relevant across sectors for CFOs evaluating strategic equity or asset-based investments especially in energy, mining, and capital markets.
Relevance For
CFOs, Corporate Strategy Heads, M&A Analysts
Objective
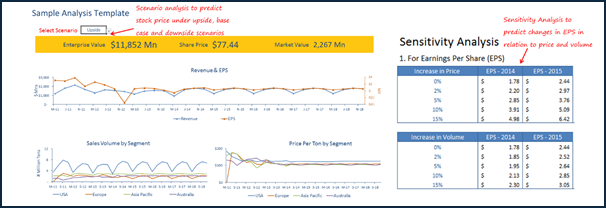
To support investment decision-making through earnings projections, enterprise valuation, and macro-scenario modelling.
What’s Good About This Dashboard
- Projects earnings and cash flows over a 5-year horizon using key financial drivers
- Performs scenario analysis (upside, base, downside) for price, volume, and cost variables
- Conducts DCF and sensitivity analysis to estimate enterprise value and ROIC implications
- Helps quantify the impact of external macro trends on investment return metrics
12. Tax Exposure & Audit Lifecycle Dashboard
Industry Fit
Relevant for large multinationals, especially those operating across multiple jurisdictions such as pharma, manufacturing, or consumer goods.
Relevance For
CFOs, Heads of Tax, Internal Audit Leaders
Objective
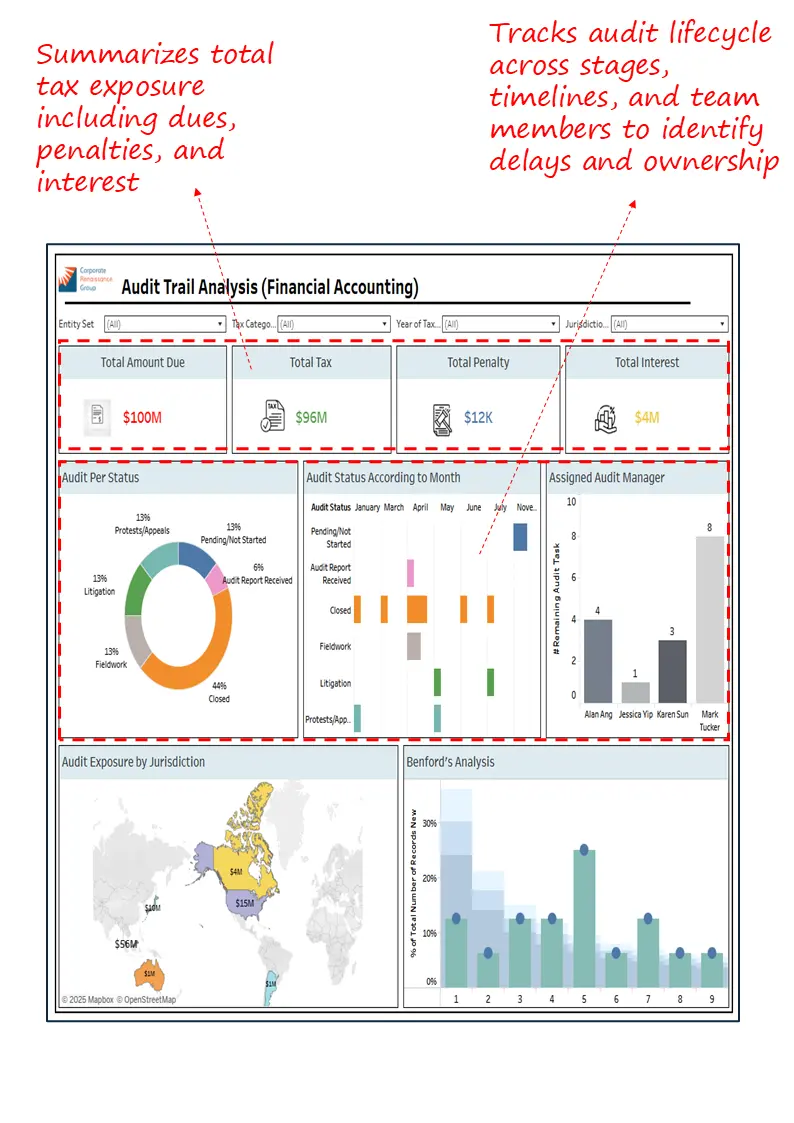
To monitor total tax exposure and manage audit lifecycle stages across time, geography, and responsible teams.
What’s Good About This Dashboard
- Summarizes total dues, penalties, and interest to quantify tax-related exposure
- Tracks audit status by stage and timeline to prevent delays and ensure accountability
- Highlights exposure by jurisdiction for risk concentration and compliance tracking
- Flags anomalies using Benford’s analysis to guide further investigation

Closing Note
In a landscape where financial agility is as critical as accuracy, dashboards are no longer optional—they are foundational. The twelve dashboards presented here empower CFOs to shift from reactive reporting to proactive financial leadership. They support faster decisions, tighter controls, and sharper forecasting across the enterprise. At Perceptive Analytics, we partner with finance teams to design executive-ready dashboards that connect operational metrics to boardroom priorities. Whether it’s working capital optimization, scenario planning, or profitability tracking, our solutions are built for real-world complexity.
Each month, we curate the latest updates, insights, and trends for senior leaders in data analytics and AI in our CXO Analytics Newsletter.
Our mission is “to enable businesses to unlock value in data.” For over 20 years, we’ve partnered with more than 100 clients—from Fortune 500 companies to mid-sized firms—to solve complex data analytics challenges. Our services include Advanced Analytics Consulting, Generative AI Consulting, and Business Intelligence (Tableau Consulting, Power BI Consulting and Looker Consultants) turning data into strategic insight. We would love to talk to you. Do reach out to us for a free consultation.