The P&C Industry Made $63B – So Why Are Mid-Market Carriers Still Losing Profit?
Insurance | April 30, 2026


From Leaky to Bulletproof: How Data Foundations Close the Profitability Gap
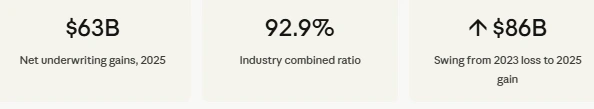
$63B in industry gains. A 92.9% combined ratio. And yet many mid-market carriers are still explaining margin erosion to their boards.
If your results don’t match the headline, the problem isn’t your market position. It’s what’s happening, or not happening, inside your data infrastructure.
Join the May 14 session to find out where the leak is.
Talk with our consultants today. Is your combined ratio moving in the wrong direction while the industry headline looks strong? Perceptive Analytics can show you exactly where the data foundation is leaking. Book a session with our experts now.
Executive Summary
- The U.S. P&C industry just delivered one of its strongest underwriting performances in years: $63B in gains, a 92.9% combined ratio. The industry headline looks excellent. Many mid-market carrier results do not.
- The gap between industry-wide performance and individual carrier outcomes is not a pricing problem or a market problem. It is a data foundation problem, and it is structural, not cyclical.
- Mid-market carriers operating on fragmented, siloed data are making underwriting and claims decisions on lagged signals. By the time the number reaches the decision, the damage is already done.
- The May 14 session goes into the specific architecture decisions that separate carriers closing the gap from those still explaining it to their boards. Perceptive Analytics has documented the data foundation patterns that drive this divergence in our data-driven blueprint for insurance growth and our breaking the bottleneck: how high-performing insurers rebuilt their analytics workflows research.
The Headline Everyone Sees. The Story Most Miss.
The numbers look strong, but Verisk’s own assessment made something clear: 2025’s gains were driven by unusually low catastrophe losses, not a structural shift in industry risk.
- Catastrophe variability hasn’t changed it just went quiet for one year
- Rate momentum is moderating heading into 2026
- Legal system costs remain elevated across key lines
- This window should be treated as a reset not validation
Our insurance analytics practice works with carriers who understand this distinction and are building for the conditions that follow a quiet catastrophe year, not for the quiet year itself.
The Winners Didn’t Just Get Lucky
When catastrophe losses normalize, and they will, the carriers still standing will be the ones who built something defensible. Not the ones who benefited from a quiet hurricane season.
The performance gap inside the industry is already visible.
The aggregate combined ratio sits at 92.9%. But commercial multi-peril liability posted a 114.9% combined ratio in 2024. Commercial auto liability hasn’t posted a sub-100% result since 2015.
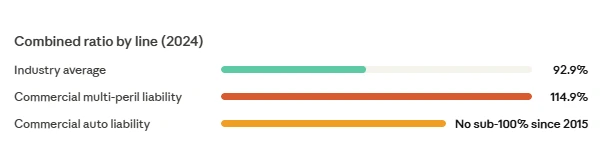
These aren’t outlier lines. They’re core business for most mid-market carriers.
The divergence between top and bottom performers isn’t market exposure. It’s operating infrastructure, specifically, how quickly and accurately risk signals reach decisions. The new metric for insurers: decision velocity we described in our insurance research captures exactly this dynamic: the carriers compounding advantage are those where the time between a risk signal appearing and an underwriting or pricing decision changing is measured in hours, not weeks.
The risk isn’t underperformance. It’s falling permanently behind.
Where the Leak Actually Is
Most mid-market carriers know their combined ratio is under pressure.
Fewer can tell you exactly why it’s moving.
Because the data feeding that answer lives in disconnected systems. Policy administration, claims, third-party enrichment data, and external risk signals rarely speak to each other in real time.
The result:
- Underwriting decisions built on snapshots, not signals
- Pricing that reacts to loss trends instead of anticipating them
- Reserve positions that surprise
This isn’t a technology problem. It’s a data foundation problem, and the distinction matters enormously for how you fix it.
Mid-market carriers face a specific structural challenge that large Tier 1 players don’t: too complex for quick fixes, not resourced for enterprise-scale transformation.
The solution isn’t to build what the top 10 carriers have. It’s to sequence the foundation correctly so that every dollar of data investment closes the right gap first.
The right sequencing: how high performers are fixing it
- Step 1 — Unify: Connect policy, claims, and external risk signals into a single governed data layer (data integration architecture)
- Step 2 — Trust: Build data observability and automated quality monitoring before analytics go on top
- Step 3 — Analyse: Layer pricing, reserving, and fraud detection models onto the clean foundation
- Step 4 — Surface: Put signals into dashboards underwriters and claims leaders actually use
The insurance sales dashboard and 6 to 9 month data layer modernisation guide illustrate how this sequencing is executed in practice for mid-market carriers who cannot afford to wait for an enterprise-scale transformation.
What This Means Heading Into 2026
Verisk and APCIA were explicit: 2025 should be treated as a reset, not a new normal.
Rate momentum is moderating. Legal system costs remain elevated. Catastrophe variability hasn’t changed; it just stayed quiet for one year.
The carriers that use this window to fix their data foundation will compound the advantage. The ones that read the $63B headline as validation will not.
The Looker consulting and marketing analytics capabilities Perceptive Analytics brings to this problem are designed specifically for the window that exists right now: a moment of industry-level profitability that creates the budget and board attention to make the data infrastructure investments that will matter when conditions tighten again.
Built for This Moment
The gap is already forming, and it won’t close on its own.
In this May 14 session, we’ll break down the exact data architecture, sequencing, and decisions mid-market carriers are using right now to protect profitability when market conditions tighten.
This blog highlights the problem. The session shows you how to fix it.
Reserve your seat for May 14, 2026
Talk with our consultants today. Ready to use this profitability window to build a data foundation that holds when the market tightens? Perceptive Analytics is here to help. Book a session with our experts now.