


Introduction
Leaders don’t need more charts. They need clear answers—what’s working, what’s at risk, and where to act right now. This Power BI set works like an executive cockpit: one place to see performance, spot trends, and move resources with confidence. Each dashboard below explains when to use it, who benefits most, and the business value it unlocks.
To make navigation simple, we grouped the dashboards into three decision areas: Strategic Performance & Growth, Operational Excellence & Efficiency, and Risk, Innovation & ESG. Start where your biggest questions are, then expand as you go.
| Sr. | Dashboard | Key takeaway — why this matters for enterprise leaders |
| 1 | Executive Summary Dashboard | A unified monthly snapshot across revenue, margin, customer, and operations so you can steer without digging through reports. |
| 2 | Financial Overview Dashboard | Connects sales, profit, discounts, and growth so you can find profit leakage and act in time. |
| 3 | Sales Analysis Dashboard | Brings bookings, renewals, pipeline health, and conversion trends into one view to protect the quarter. |
| 4 | Executive Marketing Dashboard | Links marketing spend to outcomes so budget moves toward what truly works. |
| 5 | Project & Resource Performance Dashboard | Tracks project status, utilization, and revenue efficiency so you can protect margin and timelines. |
| 6 | Service & Operational Efficiency Dashboard | Highlights outlet efficiency, utilization, and capacity gaps to lift productivity and experience. |
| 7 | Customer Service Balanced Scorecard Dashboard | Aligns service KPIs, risks, and initiatives to protect retention and brand reputation. |
| 8 | Human Capital & Workforce Health Dashboard | Gives clear visibility into workforce composition, diversity, and mobility to plan capacity and growth. |
| 9 | Enterprise Risk Management Dashboard | Maps risks by severity and priority so executives act on the critical few. |
| 10 | Innovation Report Dashboard | Tracks innovation pipeline, value versus cost, and regional traction so funding follows results. |
| 11 | Sustainability & Energy Efficiency Dashboard | Measures energy use, emissions, and efficiency improvements so ESG goals are visible and actionable. |
Strategic Performance & Growth
Start here when the question is “How are we trending and what’s driving it?” These views keep revenue, margin, and customer health front and center so you can course-correct before the quarter is gone.
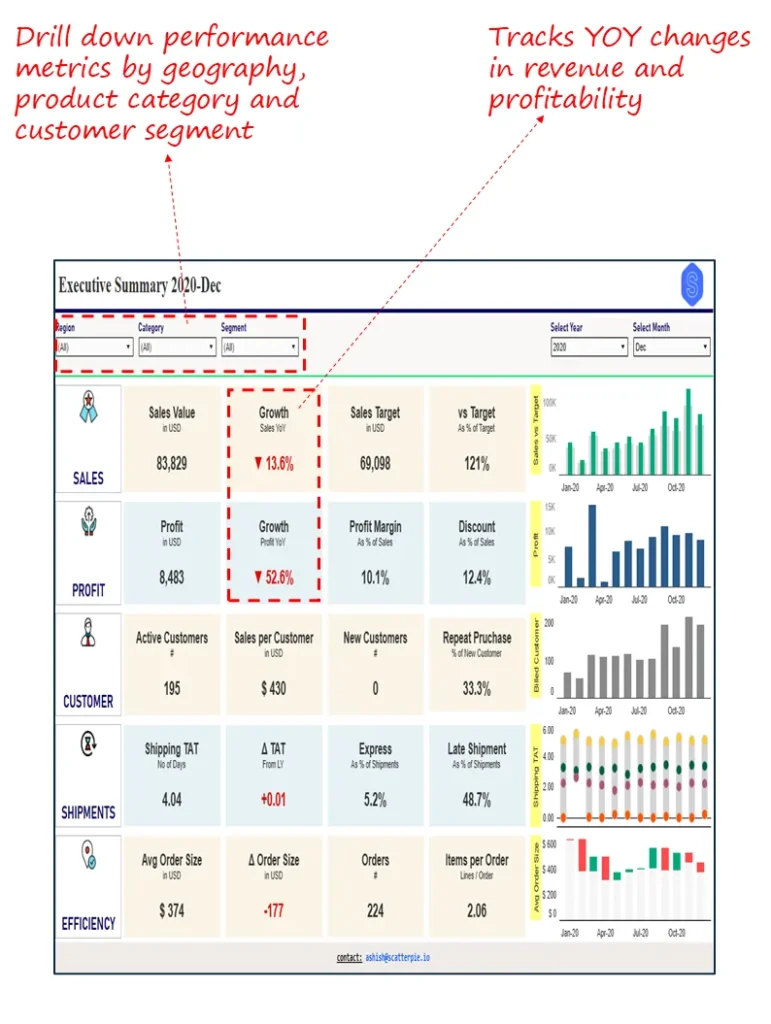
1. Executive Summary Dashboard
When you want one page to run the business, this is it. Sales, profitability, customer signals, and operational cadence come together so decisions don’t wait for decks.
Industry Fit: Retail, manufacturing, logistics, e-commerce, and enterprises that want a monthly snapshot across commercial, customer, and operations.
Most Relevant For: CEOs, COOs, CFOs, CMOs, and senior sales or operations leaders.
Objective: Provide a unified view connecting revenue, margins, customer trends, and operational performance to guide resource allocation fast.
What’s Good About This Dashboard:
- Comprehensive snapshot blending revenue, profit, customer, shipment, and efficiency KPIs.
- Trend tracking to monitor seasonality and momentum at a glance.
- Customer focus with repeat rate, sales per customer, and active counts to protect retention.
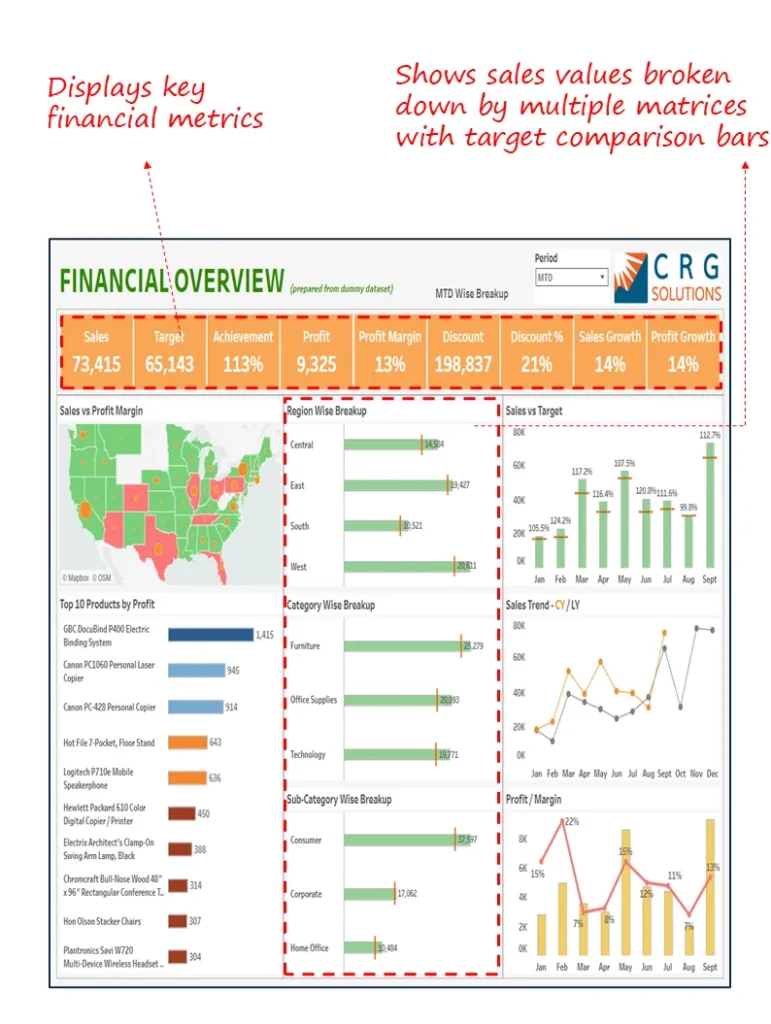
2. Financial Overview Dashboard
This is where finance links performance to action. Sales, margin, discounting, and growth sit together so interventions happen in time, not after the close.
Industry Fit: Sales-driven operations across retail, manufacturing, distribution, and technology services.
Most Relevant For: CFOs, CEOs, and Finance Directors.
Objective: Deliver a high-level financial snapshot that highlights profit drivers and informs portfolio optimization.
What’s Good About This Dashboard:
- Holistic view of sales, profit, discount rates, and growth in one layout.
- Segmented analysis by region, category, and sub-category for focused diagnostics.
- Targets vs. trends with multi-year context to guide course corrections.
Real-World Impact: Read our detailed case study to discover how a CFO transformed decision-making with a data-driven credit line analysis.
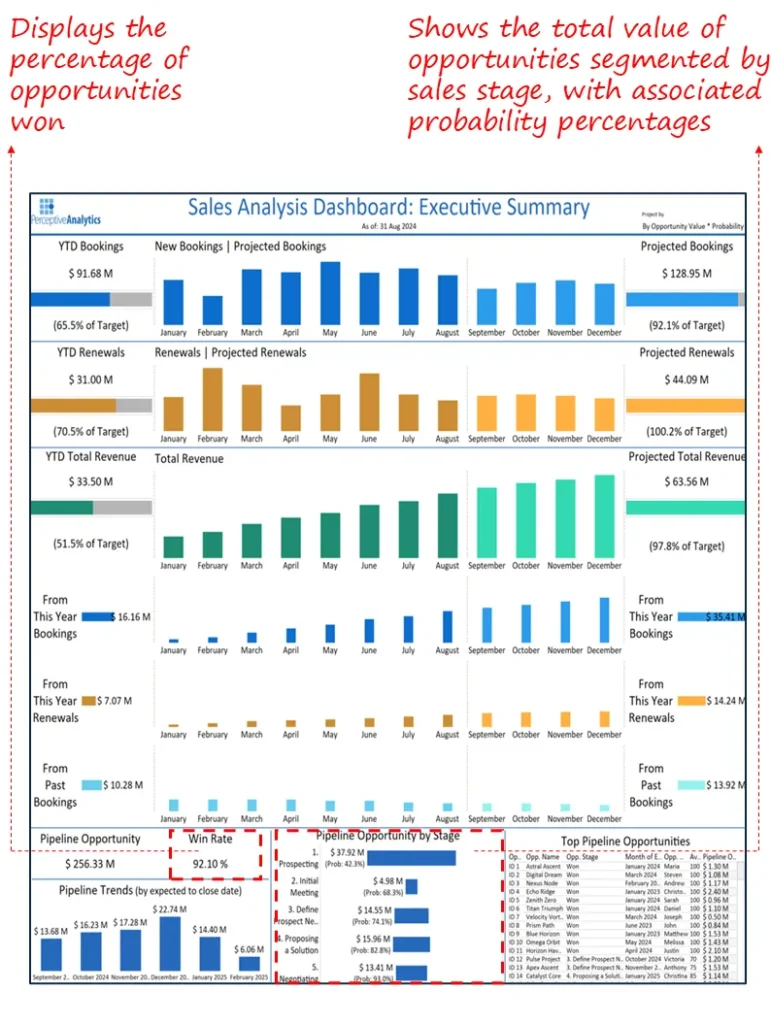
3. Sales Analysis Dashboard: Executive Summary
Keep a live pulse on bookings, renewals, and pipeline. It’s the fastest way to protect the quarter, unblock deals, and staff with confidence.
Industry Fit: B2B and B2C with complex cycles or recurring revenue models.
Most Relevant For: CSOs, VPs of Sales, Sales Ops, and Revenue leaders.
Objective: Provide clarity on performance, pipeline health, and projected revenue for proactive management.
What’s Good About This Dashboard:
- Performance tracking for YTD and projected bookings, renewals, and revenue.
- Pipeline health with value, win rate, and stage distribution.
- Growth source clarity separating new, renewal, and past bookings.
See it in action: Explore our sales analysis dashboard case study to learn how an AI finance provider transformed forecasting, retention, and deal prioritization with real-time analytics.
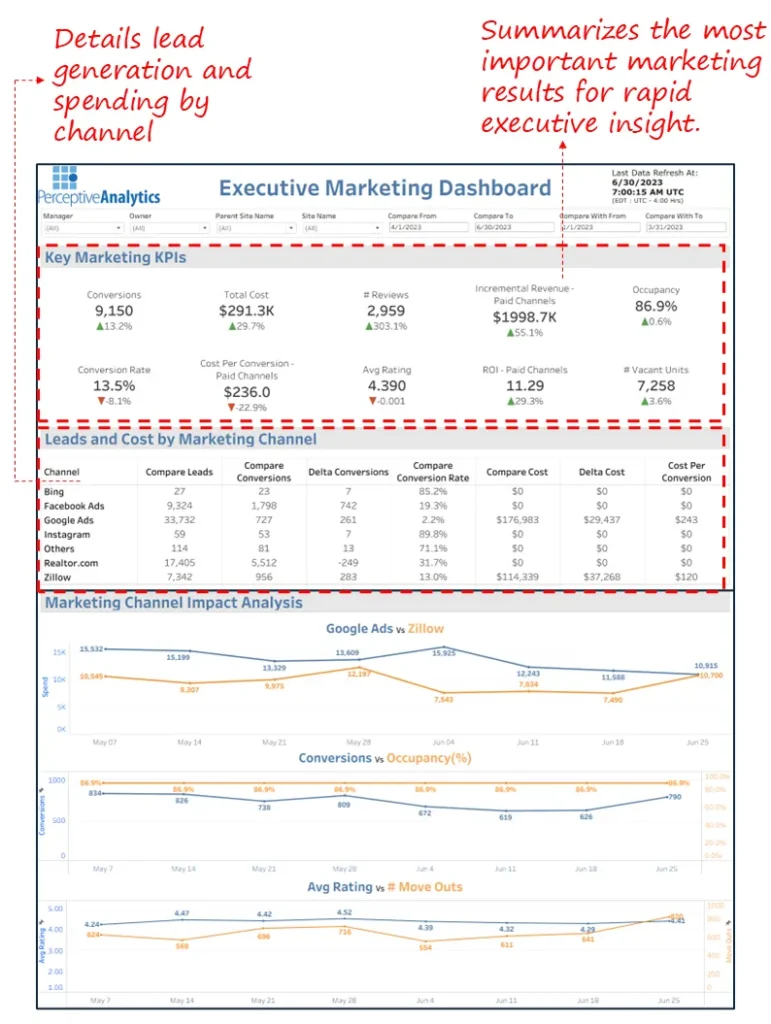
4. Executive Marketing Dashboard
When spend must move toward results, this view ties channels to conversions and revenue so budget decisions are grounded in impact, not opinion.
Industry Fit: Real estate, retail, e-commerce, hospitality, and subscription businesses.
Most Relevant For: CMOs, CROs, and leaders accountable for acquisition and growth.
Objective: Connect marketing investments with conversion and revenue outcomes to optimize allocation.
What’s Good About This Dashboard:
- Multi-channel visibility across paid and organic.
- ROI linkage that ties spend directly to revenue and occupancy.
- Channel insight into conversion rates, costs, and ratings per channel.
Want to see results in action? Explore our executive marketing dashboard case study to learn how a property management firm optimized conversions and campaign ROI with data-driven insights.
Want to walk into exec reviews with a live, trusted Power BI view instead of static decks?
Talk to Our Power BI Experts →
Operational Excellence & Efficiency
If strategy sets the destination, operations get you there. These views help you staff correctly, remove bottlenecks, and maintain quality at scale.
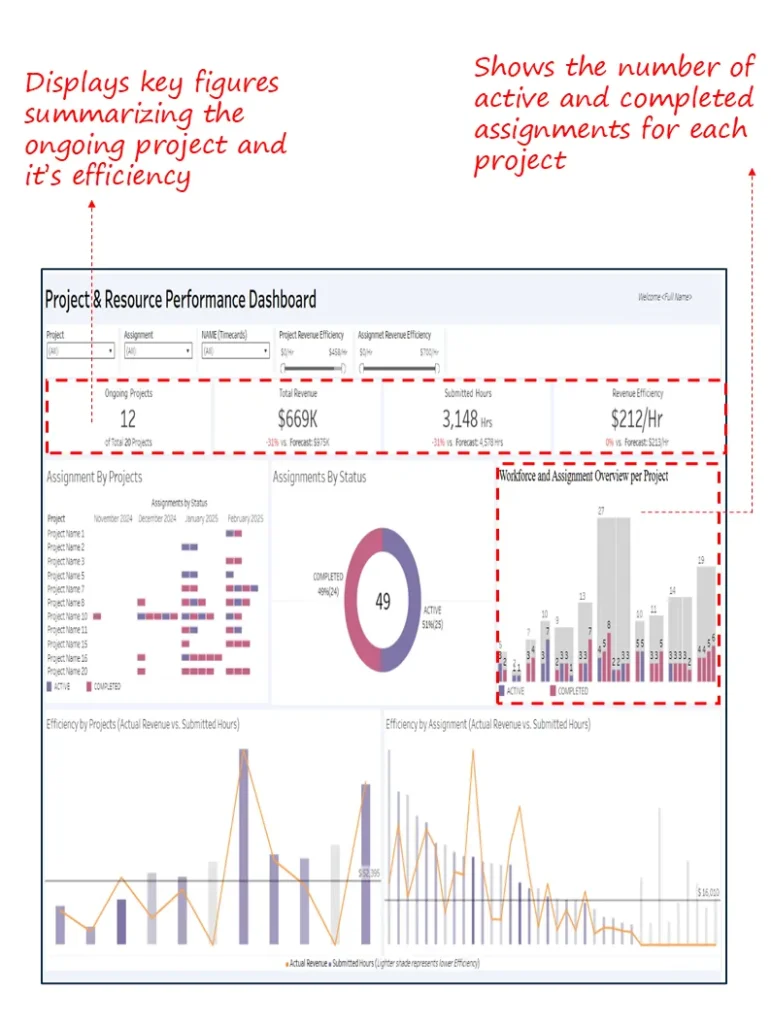
5. Project & Resource Performance Dashboard
Ideal for project-based work where utilization and on-time delivery drive margin. You see where profit is earned or lost, as it happens.
Industry Fit: Consulting, IT services, agencies, and professional services.
Most Relevant For: COOs, PMO heads, Delivery Directors, and Resource Managers.
Objective: Provide real-time visibility into project status, utilization, and revenue efficiency to optimize staffing and profitability.
What’s Good About This Dashboard:
- Balanced visibility across project and assignment performance.
- Efficiency measurement comparing revenue to submitted hours.
- Workload distribution that shows completion rates and engagement.
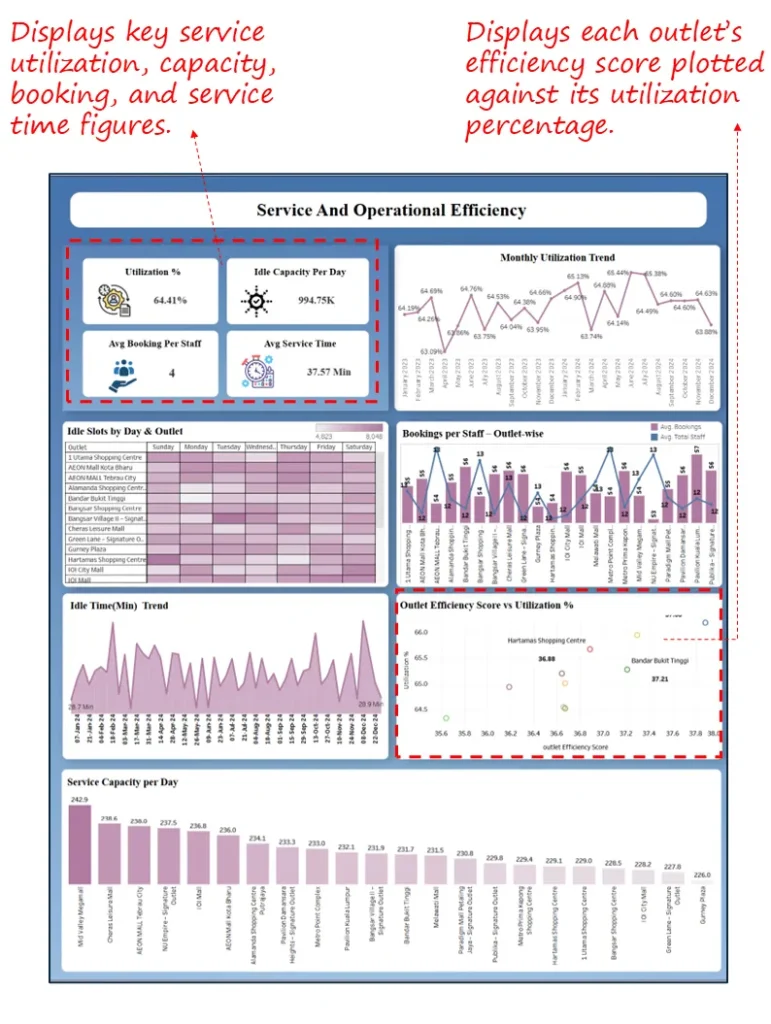
6. Service & Operational Efficiency Dashboard
Run multi-site operations? This view brings throughput and experience together so you can scale best practices and fix what drags performance down.
Industry Fit: Retail, hospitality, healthcare, and field services.
Most Relevant For: COOs, Operations Directors, Service Delivery and Regional Managers.
Objective: Monitor utilization, outlet efficiency, and capacity trends to improve allocation and service performance.
What’s Good About This Dashboard:
- Core KPIs like utilization, idle capacity, service time, and bookings per staff.
- Outlet-level insights to surface underperforming locations.
- Efficiency scoring to compare outlets and drive adoption.
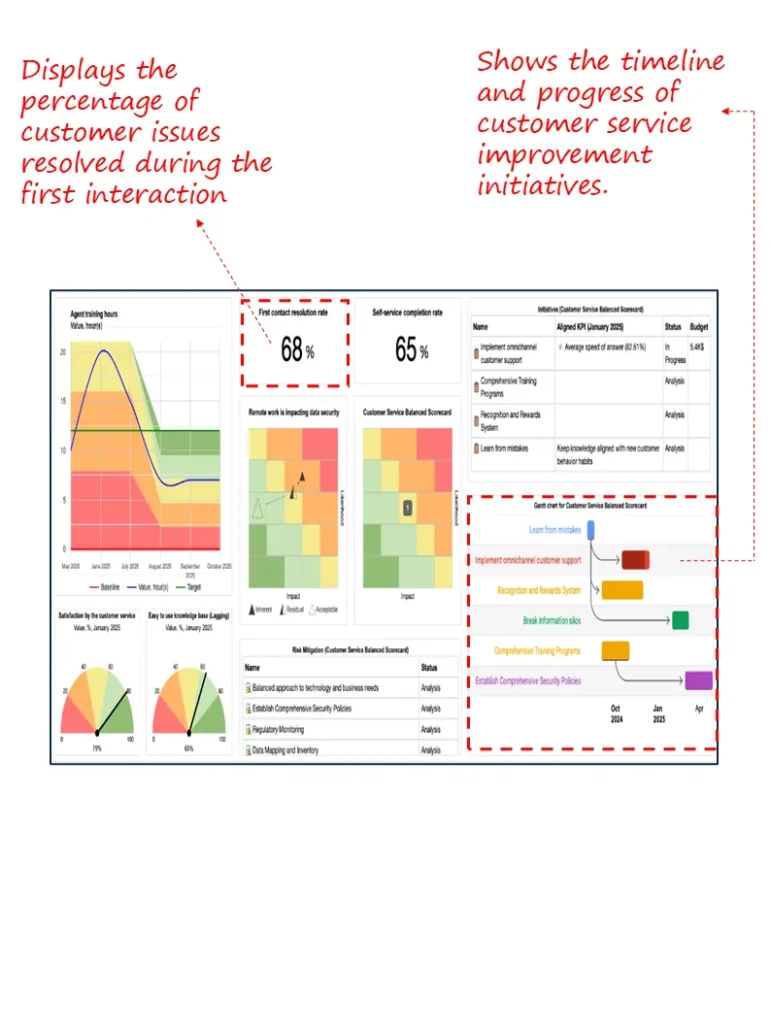
7. Customer Service Balanced Scorecard Dashboard
When experience drives retention, this puts KPIs, risks, and initiatives on one page so teams focus on what customers feel first.
Industry Fit: Any service-sensitive industry where retention and brand perception matter.
Most Relevant For: Chief Customer Officers, Heads of CX, Operations Directors, and Service Quality leaders.
Objective: Align service performance with improvement plans and risk management to lift outcomes.
What’s Good About This Dashboard:
- Integrated tracking of FCR, self-service, and backlog.
- Risk visualization to prioritize service issues.
- Initiative timelines to prove progress and accountability.
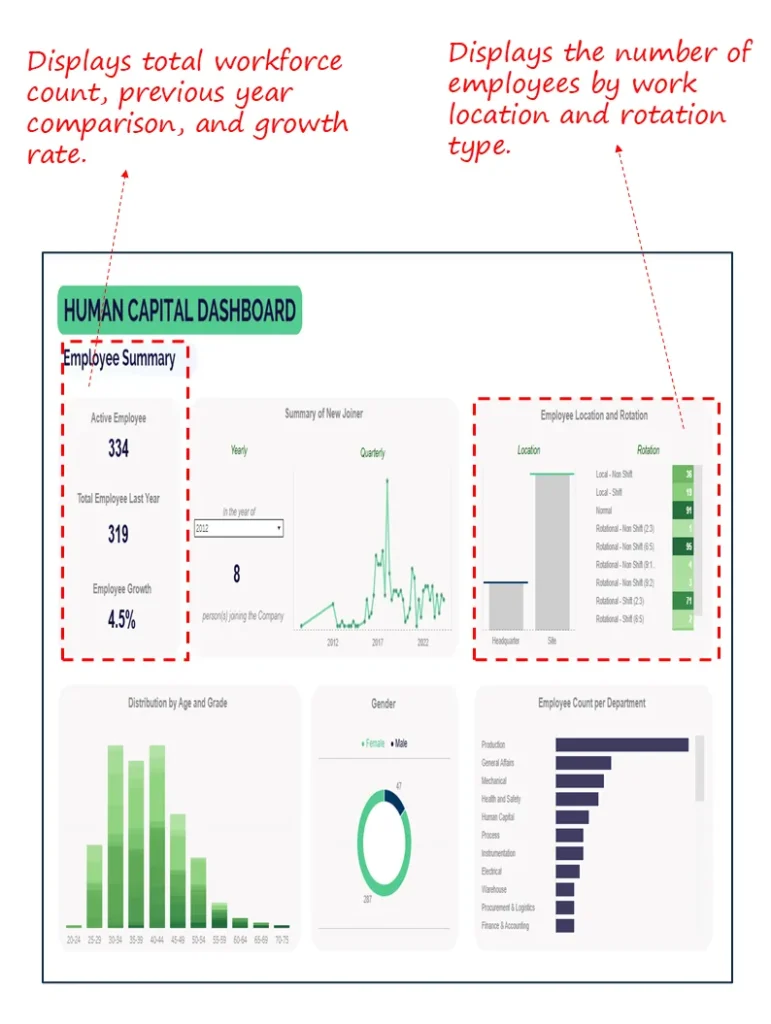
8. Human Capital & Workforce Health Dashboard
Talent capacity is a leading indicator of delivery. This view shows composition, diversity, and mobility so you can plan confidently and close gaps early.
Industry Fit: Organizations with large or diverse workforces where talent directly impacts execution.
Most Relevant For: CHROs, CEOs, and COOs.
Objective: Provide leadership with a clear view of workforce health to support strategic planning and optimization.
What’s Good About This Dashboard:
- Workforce overview with headcount, growth, and hiring trends.
- Diversity visibility by age, gender, and department.
- Mobility insights by location and rotation type.
If utilization fire drills and delivery risks are constant, let’s make work-in-progress and capacity visible—this month.
Book a Free Consultation →
Risk, Innovation & ESG
Resilience and readiness matter as much as growth. These views clarify exposure, show where innovation is paying off, and keep ESG progress transparent and auditable.
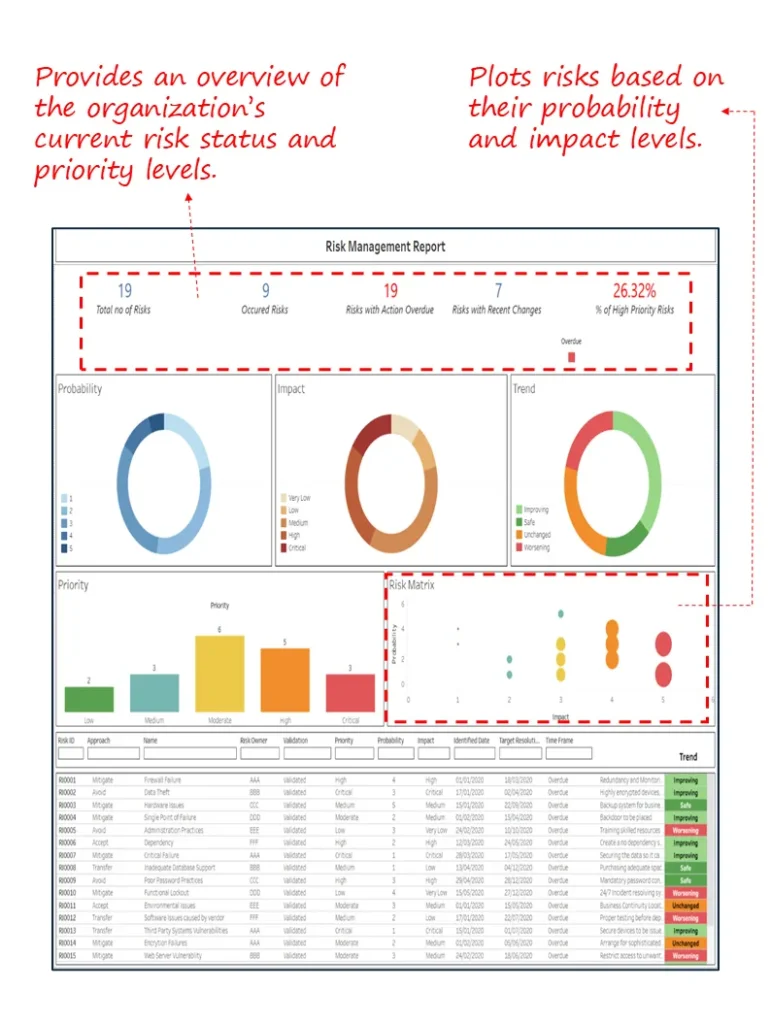
9. Enterprise Risk Management Dashboard
Get a living picture of strategic, operational, and compliance risk. Clear ownership and due dates keep the right actions moving.
Industry Fit: Finance, IT, manufacturing, energy, healthcare, and other risk-intensive sectors.
Most Relevant For: CROs, Compliance and Audit teams, and Operations heads.
Objective: Provide a clear overview of risks, their impact, and resolution status to prioritize and mitigate effectively.
What’s Good About This Dashboard:
- Actionable matrix ranking probability, impact, and priority.
- Overdue alerts that surface items needing immediate attention.
- Trend tracking to monitor status changes over time.
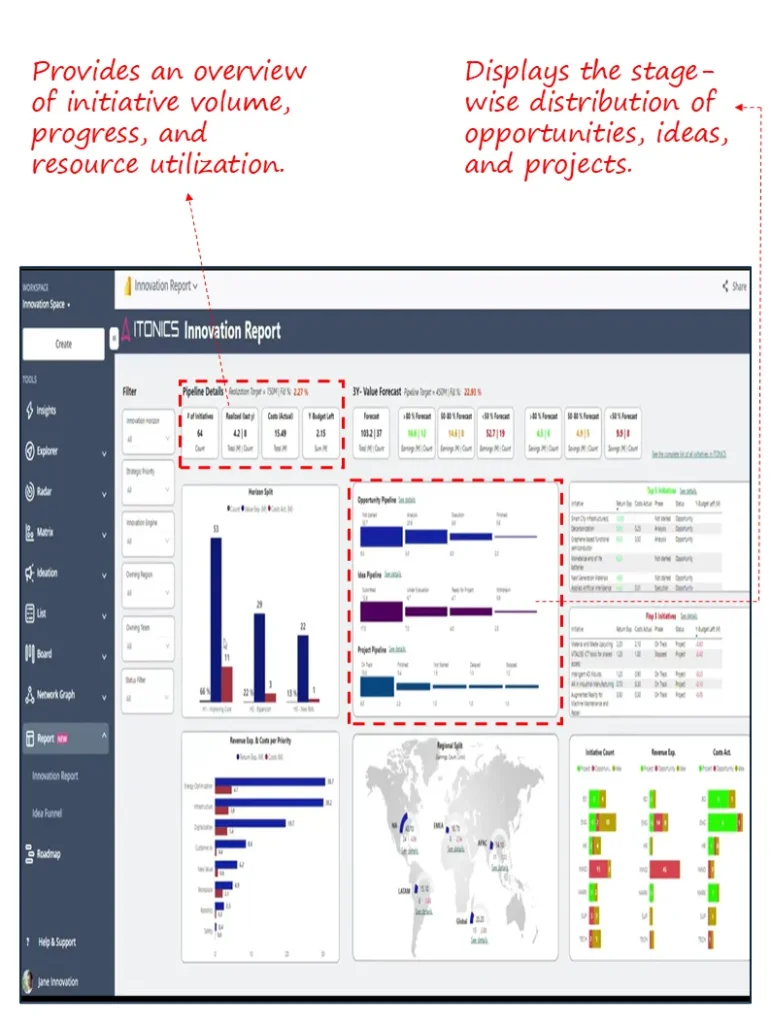
10. Innovation Report Dashboard
Innovation scales with transparency. See pipeline health, value versus cost, and adoption by region so investment follows evidence, not hope.
Industry Fit: Organizations with structured innovation programs or R&D portfolios.
Most Relevant For: Chief Innovation Officers, R&D heads, Product leaders, and Strategy teams.
Objective: Give executives visibility into status, value, and impact to guide funding and portfolio alignment.
What’s Good About This Dashboard:
- Pipeline visibility by horizon, stage, and status.
- Value vs. cost comparisons to justify investment.
- Geographic insight into where innovation gains traction.
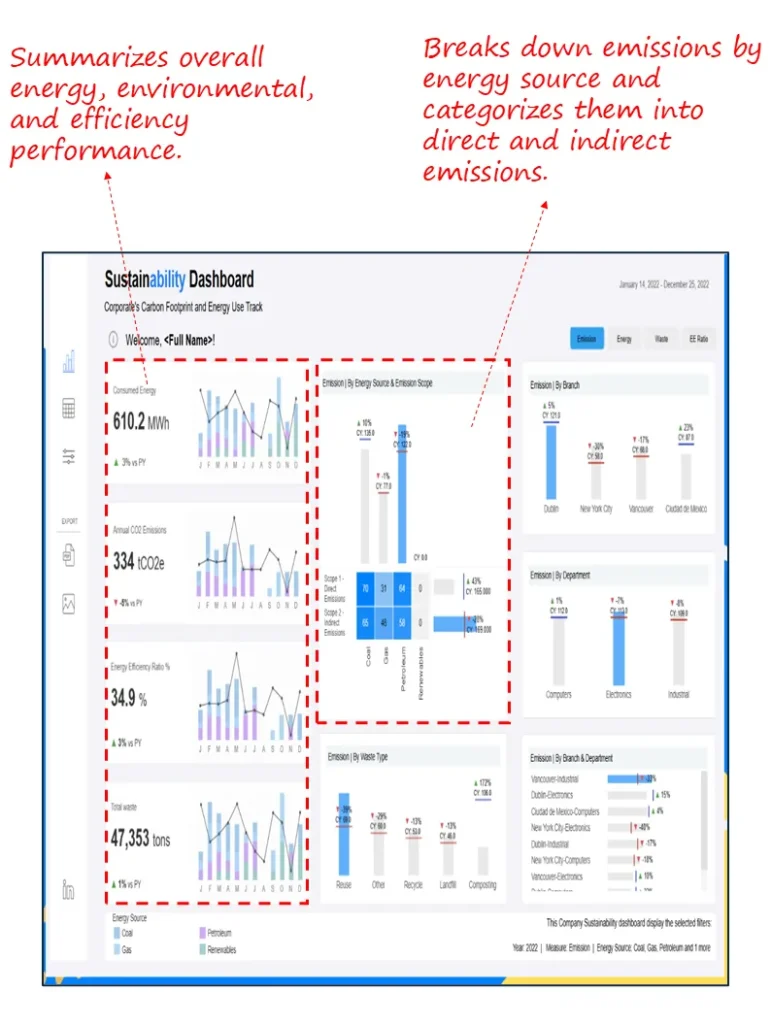
11. Sustainability & Energy Efficiency Performance Dashboard
ESG progress is a leadership issue, not just a reporting exercise. Track energy use, emissions, and improvements so goals are measurable and credible.
Industry Fit: Corporations with ESG mandates, especially energy-intensive sectors like manufacturing, logistics, and large-scale retail.
Most Relevant For: CSOs, ESG teams, and Operations leaders.
Objective: Monitor environmental performance and energy efficiency to hit targets and stay compliant.
What’s Good About This Dashboard:
- Environmental view of energy use, emissions, and efficiency.
- Breakdowns by branch, department, and energy source.
- Progress tracking with year-over-year comparisons.
Need a single risk register with owners and due dates everyone can see—before the next audit?
Talk to Our Power BI Experts →
Closing Note
These dashboards bring the business into one conversation. With a shared, real-time view across revenue, operations, risk, and ESG, leaders make decisions faster and with greater confidence. Start with the questions that matter most today and expand the cockpit as needs grow.
Organizations frequently partner with Tableau Consultants or hire Power BI consultants when scaling executive dashboards across departments to guarantee accurate metrics, proper governance, and consistent decision-making.
Prefer a pragmatic first step? Let’s review your current dashboards and outline a two-week path to a live executive view your team will actually use.
Book a Free Consultation →