


When Slow Data Kills Fast Decisions
In consulting, speed is currency.
Clients hire you to think faster, decide faster, and execute faster than they can on their own.
But in too many firms, a silent drag is eating away at that promise — the slow dashboard.
It’s subtle. It’s technical. But it’s killing your delivery credibility.
If you’ve ever had a client glance at a chart and ask,
“Wait… is this data from today or last week?”
You already know the sinking feeling.
You’ve lost momentum before the real conversation even begins.
A slow dashboard isn’t just an inconvenience — it’s a symptom of systemic lag.
Your data pipeline can’t keep up with the pace of business.
And that lag creates friction at every stage: from analysis to recommendation to execution.
Recent benchmarks across 60+ consulting firms show that data latency is one of the top three causes of delivery delays — right up there with scope creep and client-side indecision.
For an industry built on agility and insight, that’s a massive hidden cost.
Read our insights on moving from dashboards to decisions- From Dashboards to Decisions: Why Consulting Firms Must Redefine Analytics in 2026
The Real Price of Data Lag
Slow dashboards don’t just waste minutes. They quietly erode profit, morale, and trust.
1. Time and Budget Overruns
Every minute a consultant waits for a dashboard to refresh is a margin killer.
Teams lose up to 10 hours per week chasing stale data or re-running broken queries.
That’s time billed without impact — or worse, time written off.
When you multiply that across dozens of engagements, the economics get ugly fast:
lost billable hours, delayed deliverables, and an invisible drain on your P&L.
2. Team Frustration and Burnout
Top consultants want to solve business problems, not troubleshoot SQL errors.
When analysts spend most of their week cleaning data instead of crafting insights, their morale nosedives.
You don’t just lose time — you lose talent.
And replacing frustrated analysts is far costlier than fixing a data pipeline.
3. Damaged Client Confidence
Speed signals competence.
When your dashboards stall, it doesn’t just slow down the meeting — it slows down trust.
Clients start to question the numbers. Then the logic. Then the recommendations.
And that hesitation spreads quietly through every follow-up call and every steering committee deck.
“A five-minute data lag becomes a five-week trust deficit.”
— Engagement Director, Perceptive Analytics
Five Hidden Causes Behind Slow Dashboards
A slow front end is rarely the real issue. The problem usually hides deep in the data-to-decision pipeline.
Here’s what our benchmark analysis across global consulting firms uncovered:
1. Fragmented Data Prep
Consultants often pull data from a dozen systems — CRM, ERP, financial, third-party APIs — each with different formats and data quality.
Manual blending and cleanup become the silent time sink that eats 60–70% of project hours.
2. Outdated Refresh Cycles
Many dashboards still rely on overnight batch jobs.
By the time you present data at 10 a.m., it’s already 8–10 hours old — completely misaligned with the client’s “live” operations.
3. Weak Governance
Without a single source of truth, everyone builds their own version of “reality.”
Metrics drift. Definitions vary.
By the time numbers hit the executive slide, reconciliation takes days — sometimes weeks.
4. Manual Reporting Loops
Analysts still export data into Excel or PowerPoint to send “final” decks.
Not only is this slow and error-prone, it opens security risks and guarantees version chaos.
5. Unscalable Infrastructure
Legacy on-prem servers and under-optimized cloud setups choke under heavy queries.
The result? Dashboards that time out mid-presentation or take minutes to render a single chart.
“Slow dashboards aren’t a tech failure. They’re a process failure — multiplied by habit.”
— Chief Data Officer, Consulting Analytics 2026 Study
Check out how consulting firms measure decision velocity ROI- The Economics of Decision Velocity: Measuring ROI in Consulting Analytics
The Perceptive Data Acceleration Framework
Fixing lag isn’t about making dashboards prettier.
It’s about making data move at the speed of decisions.
That’s why Perceptive Analytics built the Data Acceleration Framework —
a proven approach to eliminate friction across the entire data value chain for consulting delivery.
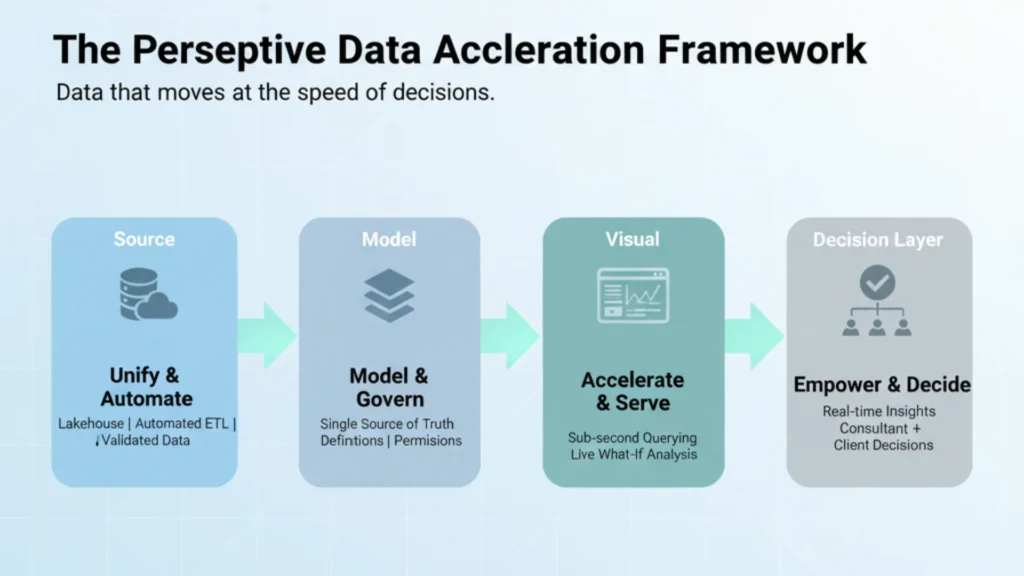
1. Unify & Automate
Consolidate every data source into a high-performance lakehouse or warehouse.
Automate 90% of manual prep with ETL orchestration and validation scripts.
Clean data once, use it everywhere.
2. Model & Govern
Build a centralized data model with consistent definitions and clear permissions.
No more metric mismatches or version confusion. Everyone works from the same truth.
3. Accelerate & Serve
Optimize your query engine and pipelines for sub-second load times.
Empower consultants to explore “what-if” scenarios live, in the room — not after another overnight refresh.
4. Empower & Decide
Deliver insights through interactive, self-service dashboards that enable both consultant and client to decide in real time.
When analytics stop being static, engagement speed doubles — and impact multiplies.
The ROI of Acceleration
The business case for fixing dashboard latency is clear — and quantifiable.
According to our Consulting Analytics 2026 Report, firms that implemented the Data Acceleration Framework achieved:
- 40–50% faster decision-making cycles
- 75% fewer data-related errors in deliverables
- Up to 20% higher project throughput in the first year
That speed has a compounding effect:
- Projects close faster → margins rise.
- Analysts deliver more → capacity expands.
- Clients act quicker → outcomes improve.
In short, time saved becomes value earned.
“When your analytics load faster, everything downstream accelerates — from insights to invoices.”
— Partner, Mid-Market Consulting Firm
Discover how AI is scaling decision intelligence — AI Analytics: Building Decision Intelligence at Scale
Trinity Consulting: A Case in Speed and Scale
Trinity, a mid-sized strategy firm, partnered with Perceptive to eliminate their persistent data delays.
Before:
- Dashboards took up to 45 seconds to load.
- Analysts spent 60% of their time preparing data.
- Client QBRs required a week of manual prep.
After implementing the Perceptive framework:
- Dashboard performance improved by 98%.
- Weekly reporting time dropped from 20 hours to 4.
- The team delivered 3× more client engagements without expanding headcount.
The ROI was immediate — higher margins, happier teams, and measurable client satisfaction gains.
The Human Impact of Faster Data
Speed doesn’t just improve numbers — it improves people.
Consultants working with responsive analytics spend their time solving problems, not chasing data.
Client conversations become dynamic, data-driven, and forward-looking.
Confidence replaces hesitation.
That shift in momentum compounds over every engagement, every renewal, every referral.
Fast data doesn’t just inform — it inspires.
Your Next Step: Stop Waiting, Start Accelerating
Slow dashboards are not a technical inconvenience.
They are a strategic liability — one that quietly eats away at your margins, your culture, and your credibility.
In 2026, data velocity is the new differentiator.
The firms that win won’t have the prettiest dashboards — they’ll have the fastest ones.
It’s time to stop waiting for insights and start accelerating outcomes.