What are the Caching and Aggregation Strategies to Keep Power BI Dashboard Performance at Scale?
Power BI | April 30, 2026


A practical guide to accelerating BI dashboards through smarter caching, summarisation, and model design
Data volumes are growing at an unprecedented rate, and enterprises are becoming increasingly dependent on dashboards for real-time decision making across executive leadership and frontline teams. Cloud warehouses have become the analytical core, and business users expect answers as fast as they think.
As cloud adoption is growing, performance issues move beyond the data team into leadership conversations. Slow and inconsistent dashboards lead to delays in decision making which trigger infrastructure upgrades soaring costs without even addressing the core problem.
Perceptive Analytics POV
At Perceptive Analytics, we see performance becoming the biggest barrier to scale. Even well-designed dashboards suffer not because of visuals but because too much computation is happening at the moment they are used. We have seen load time drop drastically (often by more than 4x) when computation is shifted upstream to warehouse or semantic layer.
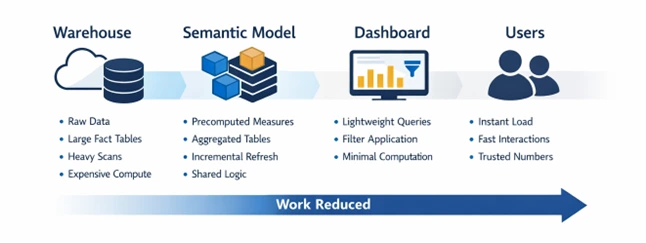
A simple way to think about dashboard performance is to focus where majority of the processing happens across the data pipeline. Caching, aggregation and right server-side strategies optimise processing at different points in this flow, keeping dashboards fast and effective. The techniques below reflect what we apply in real implementations to make BI truly real-time.
At Perceptive Analytics, we also adhere to the Five-Second Rule when creating executive dashboards, where key information needs to be presented fast enough so that executives can immediately identify priorities. For CXOs, speed is not an abstract measure, it is a determinant of the level of trust they have on the dashboard.
Talk with our consultants today. Is your Power BI environment slowing under scale? Perceptive Analytics can identify where computation is happening and shift it upstream. Book a session with our experts now.
Caching Strategies
Executive Insight: For Power BI, caching strategies reduce work at view time by storing query results, precomputing heavy metrics, refreshing only incremental data, and using Dual mode to serve frequently used dimensions from in-memory cache instead of DirectQuery.
Enabling Query Caching accelerates repeated queries by storing past answers in memory
Dashboards often repeat the same questions (e.g., “What were sales last quarter?”). Query Caching allows Power BI to store those answers in memory, so they are delivered instantly instead of being recalculated every time. It is available in Power BI Premium for import semantic models and can be turned on in the Power BI online service. Our Power BI optimisation checklist and guide documents the full set of configuration standards we apply.
Precomputing metrics eliminate run-time overhead by storing heavy metrics in advance
Calculations like profit margin, year-to-date revenue, or churn rate take extra processing if dashboards compute them on the fly. Precomputing means these values are worked out and stored in advance, so the dashboard only needs to display them. Create these as part of the dataset model (import connection) or during data processing (live connection).
At Perceptive Analytics, our teams merge the skills of BI engineers with experts from various sectors, such as insurance, retail, healthcare, or manufacturing, to make sure that performance optimisation always happens without compromising on its relevancy for the business.
Incremental refresh speeds up dataset updates by processing only new or changed data
In practice, we have seen that many teams invest heavily in caching but continue to refresh entire datasets completely. Without a careful refresh design, other caching gains are short-lived and issues cripple back again. When connecting large datasets through import mode in Power BI, choose incremental refresh for datasets that keep adding rows to already existing data.
For more information about full refresh vs incremental refresh, refer to our article here.
Use Dual mode to keep dimensions in-memory and accelerate visual interactions
When working with large DirectQuery fact tables, convert high-reuse dimension tables like date, region etc to Dual mode. This lets Power BI resolve filters from the in-memory cache first if there are used as slicers or use direct query mode when used as part of a visual. This helps optimise queries that are sent to the data warehouse significantly improving performance.
Server-Side Pre-Warming with REST API for Zero-Latency First Loads
Use Power BI REST API or scheduled subscription triggers to “pre-hit” reports 10 to 30 minutes before executive usage. The server executes queries in the background and stores them in tile/query cache, so when users open dashboards later, visuals render from memory instead of recalculating DAX computations. This is very useful when doing monthly reviews, weekly check-ins or when viewing KPI pages. Our Power BI consulting and Power BI developer consultant teams configure pre-warming as a standard component of every enterprise deployment.
Aggregation Strategies
Executive Insight: Aggregation Strategies in Power BI rely on summary tables to limit use of large fact tables only during drill-downs and centralising logic in a semantic model that can be connected to various reports.
Aggregation mapping redirects expensive queries to lightweight summary tables
Power BI can answer high-level questions about monthly revenue or regional sales by pulling data from small, pre-aggregated tables. This prevents Power BI from scanning large fact tables every time the dashboard is checked. This is achieved by mapping group-by fields and summary tables directly to the original fact tables. Teams struggle here because they build summary tables that don’t match how teams actually use those dashboards. Our Snowflake consulting team builds the warehouse-level pre-aggregation layer that feeds these summary tables cleanly and consistently.
Pro Tip: Instead of a single summary table, use a 3-tier aggregation model (daily to monthly to yearly). Power BI selects the smallest aggregation needed, reducing fact table scans and improving performance.
Smart drill-down design improves performance by loading granular data only when needed
The most effective dashboards should show your main KPIs first. You should only see the fine details if you choose to drill down into a specific number. This design keeps the initial load light and responsive for executives who just need a quick status update or view high-level information. To prevent the report from hanging while you select multiple categories, you can enable a setting that only applies filters when the user clicks an “Apply” button. This prevents the dashboard from loading each time a filter is changed and also prevents accidental interactions.
Shared semantic models centralise heavy logic and deliver faster, consistent analytics
A semantic model in Fabric or Analysis Services places all the important calculations, hierarchies, and pre-calculated KPIs into one optimised layer. Several Power BI reports can point to this semantic layer where the refresh process will involve refreshing only one layer rather than individual reports. Our standardising KPIs in Tableau and Power BI for modern executive dashboards guide demonstrates how this semantic standardisation is designed and governed.
The reason why the semantic layer is created is not just for scalability but also for future-proofing. It is created in a way such that when a company expands its business, acquires another business entity, or introduces a new metric, it does not need to redesign the whole dashboard structure.
Server-Side Performance Strategies
Executive Insight: Server-side tuning keeps dashboards fast under load by scaling capacity when needed, pushing processing to the source, and keeping critical models in memory for instant access.
Enable Auto-Scale for Peak Concurrency Windows
Power BI Premium offers an option to scale out additional cores if you encounter limits of either memory or CPU. It would be preferable not to opt for an increased capacity but try out auto-scale with a burst of 2 or 4 cores. Many organisations only enable this feature once their reports become delayed. By enabling auto-scale early, one may avoid any crashes associated with Monday morning load peaks.
Ensure Query Folding to Push Heavy Processing Back to the Source
Do not define the order of your steps so that folding occurs prematurely. The process will be interrupted if there is any kind of custom column calculation before filtering or joining tables. Make sure to order your steps in such a way that filtering and grouping are done earlier to delegate the workload to the SQL database. This can be verified via the “View Native Query” option available upon clicking right on any particular step.
Pin Critical Semantic Models to Memory to Avoid Eviction Cycles
You may keep the critical models from falling out of the memory cache by configuring the capacity configuration. Allocate more memory to your most frequently accessed datasets or place them into a separate capacity to ensure that all dashboards are always ready to use. This will eliminate the problem known as the cold start, when the server needs 10 seconds to generate visuals.
Pro Tip: Use XMLA/timeout rules to auto-cancel long-running jobs and deprioritise paginated/deep drill-reports during peak load.
Speed at Scale Comes from Shifting Work Away from the Dashboard
In short, dashboard performance depends on doing less work at the moment of use. Smart caching eliminates repeated computation, and thoughtful aggregation minimises how much data each query touches. Used together, they keep dashboards fast and responsive at scale. A bigger picture involves not just fast dashboards but also taking the analyst teams out of routine maintenance and firefighting work for their performance. Here at Perceptive Analytics, our main concern is to provide analysis in a capsule to client-side analysts through the means of governance in dropdowns, cleaner data, validation, and easy self-service structures. Our Power BI implementation services and Power BI development services deliver these optimisations as structured engagements, not one-off configurations.
In most enterprises, performance issues don’t appear in the beginning but emerge gradually as teams start to rely more on dashboards, expectations from leadership increase and overall usage increases.
If you’d like help assessing where your dashboards are losing performance, we’re happy to review your setup and share recommendations tailored to your environment.
Talk with our consultants today. Ready to build a Power BI environment that stays fast as data and users scale? Book a session with our experts now.